1349
Simultaneous T1 and T2 mapping with QuantoRAGE: a new MP2RAGE variant using T2-prepared inversion1Siemens Healthcare AG, Bern, Switzerland, 2Magnetic Resonance Methodology, Institute of Diagnostic and Interventional Neuroradiology, University of Bern, Bern, Switzerland, 3Translational Imaging Center, sitem-insel, Bern, Switzerland, 4Donders Institute for Brain Cognition and Behaviour, Radboud University, Nijmegen, Netherlands, 5Advanced Clinical Imaging Technology, Siemens Healthcare AG, Lausanne, Switzerland, 6Department of Radiology, University Hospital (CHUV) and University of Lausanne (UNIL), Lausanne, Switzerland, 7LTS5, École Polytechnique Fédérale de Lausanne, Lausanne, Switzerland
Synopsis
T1 and T2 relaxometry provide important quantitative information and can serve as imaging biomarkers thanks to their sensitivity to pathology. However, quantitative imaging requires long scan times for high-resolution whole-brain coverage. Magnetization-prepared approaches combined with fast sequences allow for high isotropic resolution, but they are often biased due to other relaxation mechanisms than the one being probed. To account for this effect, we introduce QuantoRAGE: a new method that uses a T2-prepared inversion within an accelerated MP2RAGE sequence for simultaneous T1 and T2 mapping. Preliminary tests demonstrate the feasibility to obtain high-resolution simultaneous T1 and T2 relaxometry at 3T.
INTRODUCTION
Quantitative imaging plays an important role in the study of brain pathologies and has the potential to support diagnosis in several clinical applications [1]. However, accurate relaxometry requires long acquisition time (TA) for high isotropic spatial resolution and volumetric coverage. Additionally, methods tailored to estimate a single MR parameter are often biased by relaxation mechanisms that are not accounted for in the model. This is especially the case for T2/T1ρ mapping methods based on magnetization preparation and segmented gradient-echo acquisitions that are biased by non-negligible T1 relaxation effects [2-4].Here, we introduce a new method based on the MP2RAGE sequence [5], where a modified T2-preparation (T2p) is used to invert the longitudinal magnetization while encoding T2 contrast in the subsequent T1 recovery. The so-called QuantoRAGE sequence uses a combination of T2p and inversion times such that the acquired signal depends on both T1 and T2, so that quantitative maps can be reconstructed with extended-phase-graph (EPG) based dictionary fitting [6]. We validated the method in a phantom and compared preliminary in vivo results to reference mapping techniques.
METHODS
IRB-approved experiments were performed at 3T (MAGNETOM Prisma, Siemens Healthcare, Erlangen, Germany). For validation, a phantom with five compartments with different concentrations of MnCl2·4H2O (Siemens Healthcare) was scanned using a clinical 20-channel RX head/neck coil. For proof of concept, one healthy volunteer (female, 21 yo) was scanned using a clinical 64-channel RX head coil.Images were acquired with a segmented 3D FLASH [7] prototype sequence employing a 5.1-fold accelerated Cartesian sampling pattern [8]. In each TR, two FLASH blocks were acquired at different inversion times (TI1,2) after a modified T2p [9,10], with a center-out radial-like trajectory (Figure 1). An adiabatic T2-prepared inversion [11,12] was obtained with the following series of pulses: rectangular tip-down, two hyperbolic-secant refocusing, and another rectangular tip-down. The tip-down/tip-down inter-pulse duration (T2p-time) was changed to obtain different T2 weightings. Four scans were performed each with different T2p-times and TIs: TI1/2=19/1382 ms for T2p-time=26, 50 ms, TI1/2=19/2482 ms for T2p-time=80, 120 ms. TI1 was the shortest possible in all scans. Each scan provided two image volumes at TI1,2 resulting in overall eight images with different T1 and T2 weighting. Other protocol parameters were: FLASH1/2 flip angle=4°/5°, 150x2 readouts/TR, FLASH-TR/TE=6.7/2.9 ms, FOV=256x192x256 mm3, resolution=1x1x1 mm3, TR=4979 ms, TA=4:35 min/scan. Additionally, a fast (TA=12 s) turbo FLASH sequence was used to obtain a B1+ map.
Images were reconstructed on the scanner using a prototype compressed sensing algorithm [13]. T1 and T2 maps were estimated in MATLAB (The MathWorks Inc., Natick, MA) using a voxel-wise dictionary fitting on the magnitude images and the acquired B1+ map. The dictionary was generated using online available EPG simulations [14] to model the acquired signal depending on relative B1+ values in the range (0.7, 1.2), T1 values (150, 4346 ms) and T2 values (15, 434 ms).
For the phantom experiment, a 2D single-echo spin echo (SE) sequence with ten incremental TEs (TE=10 to 100 ms, TR=3 s, resolution=1.5x1.5x4 mm3, TA=5:53 min/TE) and a 2D multi-echo spin echo (MESE) sequence with seventeen incremental TEs (TE=10 to 170 ms, TR=5.5 s, resolution=1.1x1.1x3 mm3, TA=5:53 min) were used as T2 reference. An MP2RAGE sequence (TI1/2=700/2500 ms, TR=5 s, resolution=1x1x1 mm3) was used as T1 reference. Median values were computed from manually drawn ROIs in the five compartments and compared to those of the QuantoRAGE sequence with linear regression.
For the volunteer experiment, MESE and MP2RAGE were used for reference, and the latter also to segment nine bilateral volumes-of-interest (VOI) [15]. Median T2 values were extracted from each VOI in the QuantoRAGE maps and compared to the reference maps.
RESULTS
In vitro, good agreement was found for QuantoRAGE T2 values with SE (slope=1.06, offset=-4.6 ms, p<0.0002, Figure 2A-C), whereas systematically lower T2 values were observed in comparison to MESE (slope=0.93, offset=-7.5 ms, p<0.0002, Figure 2D-E). For T1 values, good agreement was found with MP2RAGE (slope=0.92, offset=21.7 ms, p<0.0002, Figure 2F-J).In vivo, good image quality was obtained in the four acquisitions (Figure 3): TI1 volumes (acquired at inverted magnetization and closest to T2p) showed prevalently T2 contrast and B1+ bias, while short-TI2 volumes showed more T1-weighted contrast and long-TI2 volumes a proton-density-weighted contrast. QuantoRAGE maps showed good depiction of the anatomy and distribution of relaxation values in comparison to reference methods (Figure 4). Similar to in vitro findings, VOI analysis resulted in good agreement of T1 medians with MP2RAGE and consistently lower T2 medians than those of MESE. Note MESE is known to overestimate T2 due to stimulated echo effects [16] (Figure 5).
DISCUSSION
The total QuantoRAGE acquisition time is currently 18:20 min for a 1-mm isotropic whole-head T1 and T2 maps. However, preliminary tests (not shown) suggest that four T2p-scans may be redundant, and the acquisition could be accelerated by using fewer scans/volumes. This as well as model-based reconstruction with inconsistent undersampling across the images remain to be investigated.CONCLUSION
High-resolution whole-brain simultaneous T1 and T2 mapping is feasible with the proposed method. QuantoRAGE showed good agreement with reference techniques in this proof-of-concept study. While further optimization and validation are warranted, this multi-parametric approach may improve the accuracy and robustness of T1 and T2 relaxometry.Acknowledgements
No acknowledgement found.References
1. Deoni SCL. “Quantitative relaxometry of the brain. Top Magn Reson imaging.” TMRI 21(2):101, 2010.2. Mussard, E. P. C., Hilbert, T., Forman, C., Meuli, R., Thiran, J. P., & Kober, T. (2017). High-resolution 3D T2 mapping of the Brain Using T2-prepared Cartesian Spiral Phyllotaxis FLASH and Compressed Sensing. In Intl. Soc. Mag. Reson. Med (Vol. 25).
3. R. van Heeswijk et al., “Free-Breathing 3 T Magnetic Resonance T2-Mapping of the Heart,” JCMG, vol. 5, no. 12, pp. 1231–1239, 2012.
4. Bonanno G, et al. (2021) Reproducible high-resolution T1ρ maps of the brain in under seven minutes using compressed sensing. Proc. Of Intl. Soc. Mag. Reson. Med. (Vol. 30) P1475.
5. Marques J. P., Kober T., Krueger G., van der Zwaag W., Van de Moortele P. F., Gruetter R. "MP2RAGE, a self bias-field corrected sequence for improved segmentation and T1-mapping at high field." Neuroimage, 49:1271–1281, 2010.
6. Cloos, Martijn A., et al. "Multiparametric imaging with heterogeneous radiofrequency fields." Nature communications 7.1 (2016): 1-10.
7. Haase A, Frahm J, Matthaei D, Hänicke W, Merboldt K‐D. FLASH imaging: rapid NMR imaging using low flip angle pulses. J Magn Reson 1986; 67: 258–266.
8. Forman C, et al. High-resolution 3D whole-heart coronary MRA: a study on the combination of data acquisition in multiple breath-holds and 1D residual respiratory motion compensation. Magn Reson Mater Phy 2014;27:435-443.
9. Brittain JH, Hu BS, Wright GA, Meyer CH, Macovski A, Nishimura DG. Coronary angiography with magnetization-prepared T2 contrast. Magn Reson Med 1995;33(5):689-696.
10. Nezafat R et al., B1-Insensitive T2 Preparation for Improved Coronary Magnetic Resonance Angiography at 3 T. Magnetic Resonance in Medicine 55:858–864 (2006)
11. Visser F et al., High-resolution magnetization-prepared 3D-FLAIR imaging at 7.0 Tesla. Magnetic Resonance in Medicine 64:194–202 (2010)
12. Gras V et al., Robust nonadiabatic T2 preparation using universal parallel transmit kT‐point pulses for 3D FLAIR imaging at 7 T. Magn Reson Med. 2019;81:3202–3208.
13. Wetzl J, Forman C, Wintersperger BJ, et al. High‐resolution dynamic CE‐MRA of the thorax enabled by iterative TWIST reconstruction. Magn Reson Med. 2017;77:833–840.
14. Malik, Shaihan J., Rui Pedro AG Teixeira, and Joseph V. Hajnal. "Extended phase graph formalism for systems with magnetization transfer and exchange." Magnetic resonance in medicine 80.2 (2018): 767-779.
15. Schmitter, Daniel, et al. "An evaluation of volume-based morphometry for prediction of mild cognitive impairment and Alzheimer's disease." NeuroImage: Clinical 7 (2015): 7-17.
16. Lukzen N.N. et al., The generating functions formalism for the analysis of spin response to the periodic trains of RF pulses. Echo sequences with arbitrary refocusing angles and resonance offsets. Journal of Magnetic Resonance. 196:2 (2009) 164-169
Figures
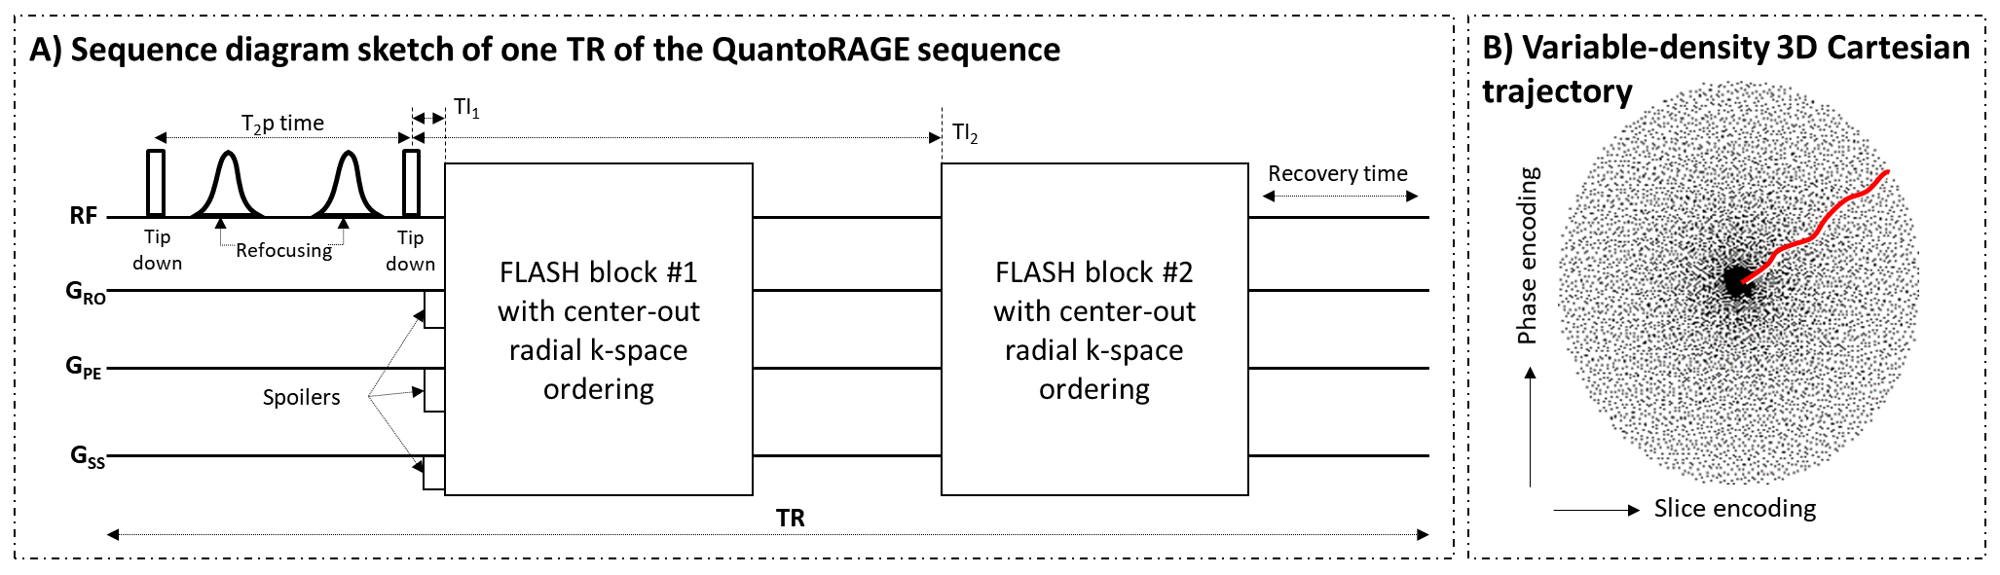
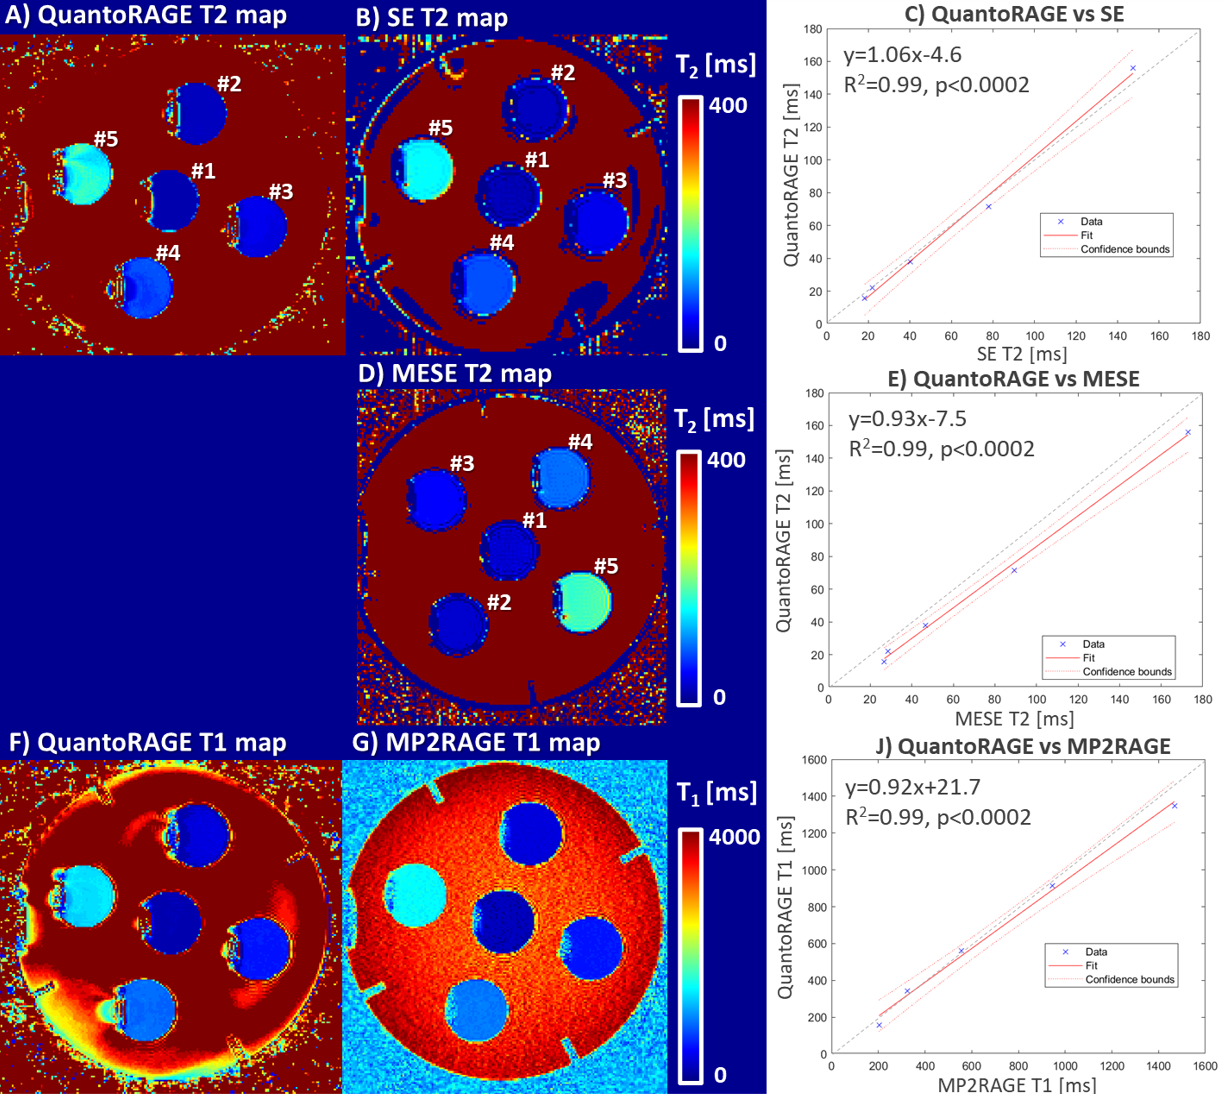
Figure 2. Phantom validation of the QuantoRAGE sequence against reference methods using a linear regression model on the ROI T1/2 medians. A-C) T2 estimation in the five compartments show good agreement with a spin echo (SE) sequence. D-E) In comparison with a multi-echo spin echo (MESE), T2 values show good correlation but bigger offset, resulting in systematically lower values of QuantoRAGE. F-J) T1 estimation of the five compartments show good agreement with the MP2RAGE sequence. C,E,J) The solid and dotted red lines show the fitted linear model, the gray dashed lines show x=y.

Figure 3. Overview of resulting images from the four described QuantoRAGE acquisitions (each one for each T2p-time and combination of TI1,2) given as input to the dictionary fitting together with an acquired relative B1+ map. Good image quality can be observed throughout the volumes (windowed according to TIs). Volumes acquired at TI1 (shortest possible TI) predominantly show T2 contrast, as they are acquired just after the T2p, and B1+ variations. Volumes acquired at short and long TI2s show predominant T1 and proton density contrast, respectively.

Figure 4. QuantoRAGE maps show good depiction of the anatomy with typical appearance of cerebellum dentate nucleus and cortical spinal tracts in T2 map and sharp gray/white matter border in T1 map (arrows, left panel). QuantoRAGE T1 maps also show constant white matter contrast similar to MP2RAGE. QuantoRAGE T2 maps may still exhibit B1+ related variation in peripheral region of the brain (left panel). A more accurate B1+ mapping and/or simulation in the dictionary may help reduce this effect. In comparison to MESE, QuantoRAGE T2 maps also show same regional properties (right panel).
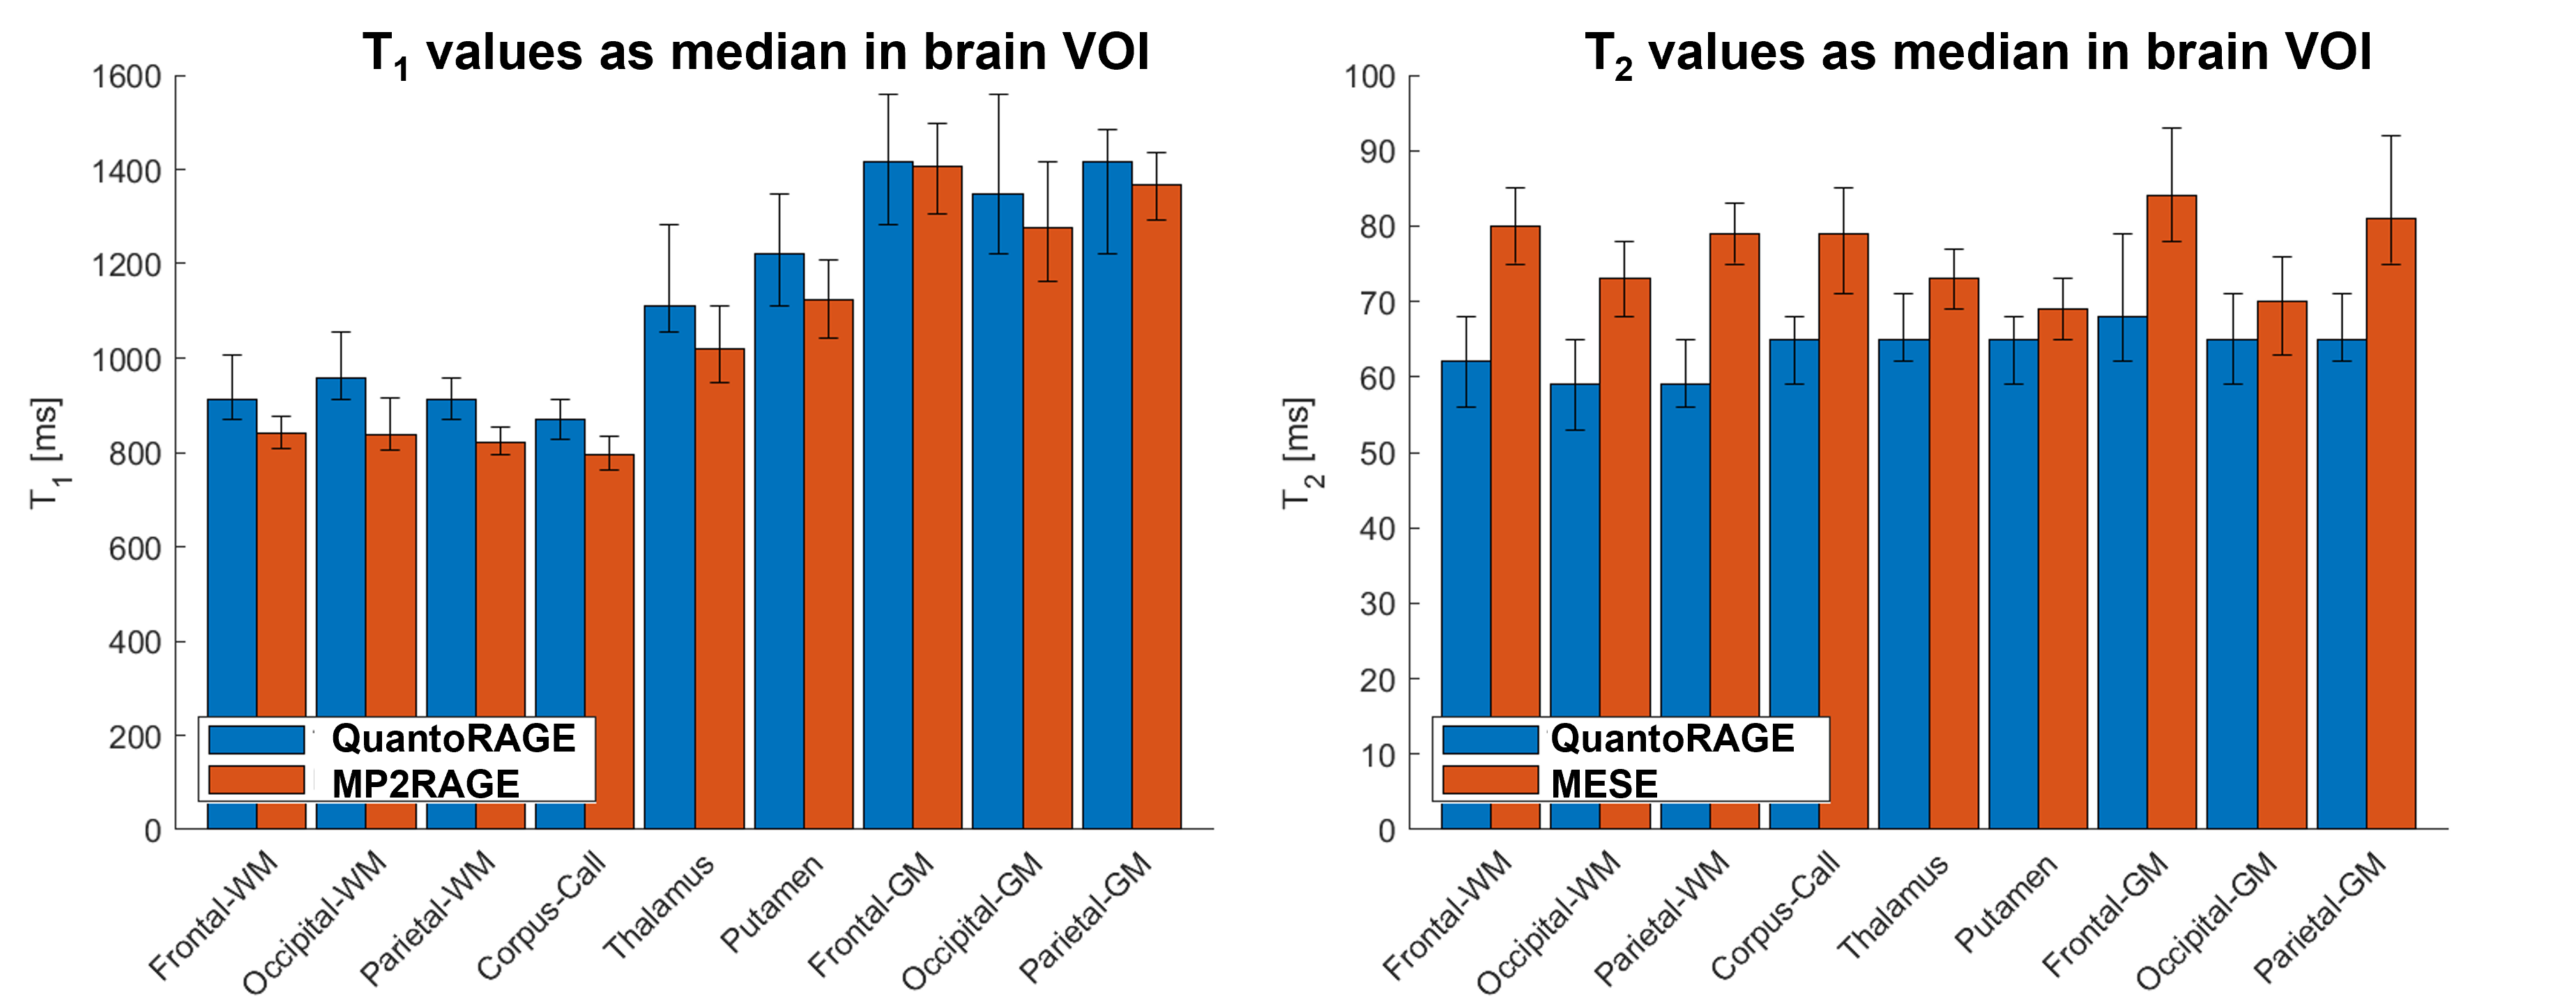
Figure 5. T1 and T2 median values from segmented brain volumes-of-interest (VOI). T1 values from QuantoRAGE agree with those from MP2RAGE. T2 values from QuantoRAGE are systematically lower than those of multi-echo spin echo (MESE) sequence possibly due to stimulated echo effects in the MESE. Note MESE T2 medians may be affected by partial volume error (especially in gray matter regions) because VOIs were segmented in MP2RAGE and registered to 2D multi-slice MESE with different slice thickness and coverage. Error bars indicate 25/75-th percentile.