1347
Simultaneous mapping of compartment-specific T2 and T2* with Diffusion-PEPTIDE imaging1Centre for Medical Image Computing, Department of Computer Science, University College London, London, United Kingdom, 2Radiological Sciences Laboratory, Department of Radiology, Stanford University, Stanford, CA, United States, 3Department of Electrical Engineering, Stanford University, Stanford, CA, United States
Synopsis
Inspired by recent developments in combined relaxometry-diffusion imaging and growing interests in T2* imaging, this study achieves simultaneous compartmental T2 and T2* mapping for the first time. We take advantage of the recently developed diffusion-PEPTIDE imaging technique, which allows for efficient acquisition of diffusion datasets with varying T2/T2* contrast. A relaxometry-diffusion combined microstructure model and a robust multi-stage fitting approach are developed to enable compartmental T2 and T2* mapping. This technique could be a new tool for future neuroimaging studies benefiting from quantification of T2-T2*-diffusion, such as studying iron content related development and pathology.
Introduction
Combined relaxometry-diffusion imaging methods improve the characterisation of tissue microstructure by allowing the differentiation of different compartments through joint consideration of their relaxation and diffusion properties1. While most studies have focused on T2-diffusion imaging2–5, T2*, which is important in reflecting iron content6, could also benefit from combined imaging.Several studies have demonstrated the utility of T2*-diffusion with different acquisition and modelling strategies. With ZEBRA7 acquisition and continuum spectra modelling, T2*-ADC has been suggested to be able to separate normal and dysfunctional placentas8. Another study in the brain achieves the differentiation of intra-axonal T2* by using extra-axonal water suppression from strong diffusion gradients9. To our knowledge, simultaneous compartmental T2 and T2* mapping is beyond the capabilities of existing methods.
Inspired by these studies and the multi-compartment modelling in T2-diffusion3–5, we characterise and differentiate compartmental T2 and T2* values simultaneously with microstructure modelling. To achieve this, a new imaging acquisition technique diffusion-PEPTIDE10 is used to provide rich diffusion data, where diffusion-weighted images with different T2 and T2* weightings can be time-resolved across its ~50 ms readout at ~1 ms increment; with these images also free from the distortion and blurring artefacts typical in conventional single-shot EPI.
Theory
The Forward ModelThe proposed model is comprised of three non-exchanging compartments including the intra-neurite and extra-neurite space to model tissue microstructure and free water space to account for CSF contamination11. The signal at any echo time t and diffusion gradient b can be represented as a combination from all compartments with their initial compartmental signal ($$$S_{in}^0; S_{en}^0; S_{iso}^0$$$), transverse relaxation weighting ($$$E_{in}(t); E_{en}(t); E_{iso}(t)$$$) and diffusion weighting ($$$A_{in}(b);A_{en}(b); A_{iso}(b)$$$) as:
$$S(b;t)=S_{in}^0E_{in}(t)A_{in}(b)+S_{en}^0E_{en}(t)A_{en}(b)+S_{iso}^0E_{iso}(t)A_{iso}(b)$$
The transverse relaxation weighting from diffusion-PEPTIDE is determined by the relaxation rates R2 and R2’, which can be different for each compartment. Taking $$$E_{in}(t)$$$ for example, the relaxation weighting is expressed as10:
$$ E_{in}(t)=\begin{cases}\exp{(-t(R_2^{in}-R_2^{'in})-TE_{SE}R_2^{'in})}, & TE_{SE}/2<t<TE_{SE} \\ \exp{(-t(R_2^{in}+R_2^{'in})+TE_{SE}R_2^{'in})}, & t>=TE_{SE} \end{cases}$$
where $$$TE_{SE}$$$ is the echo time of the spin echo, the time point that a conventional diffusion method acquires.
The diffusion weighting can be modelled in different ways12. Here, we use the NODDI11 model as an example, which models the $$$A_{in}(b), A_{en}(b)$$$ and $$$A_{iso}(b)$$$ as orientation dispersed sticks, anisotropic and isotropic Gaussian diffusion respectively.
The intra-neurite and free water signal fraction are defined as $$$f_{in}^0=S_{in}^0/(S_{in}^0+S_{en}^0 )$$$ and $$$f_{iso}^0=S_{iso}^0/(S_{in}^0+S_{en}^0+S_{iso}^0 )$$$, which are TE-independent in contrast to the ones derived with conventional diffusion method alone, which are relaxation-weighted and hence TE-dependent3-5.
The multi-stage fitting approach
To estimate the compartmental T2, T2* and signal fractions from the model, a multi-stage approach similar to MTE-NODDI5 is designed for accurate and robust fitting, alleviating the difficulty of direct optimisation of the forward model which is known to be challenging to achieve in such a high-dimensional parameter space. Details about the multi-stage fitting approach are given in Figure 1.
Experiments
In vivoTo demonstrate our method, multi-shell diffusion-PEPTIDE dataset is collected from a healthy subject on a Siemens Prisma scanner using a 32-channel head coil, with the following imaging parameters: b=0 (4 repetitions), 700 (20 directions) and 2000 s/mm2 (30 directions); TE=84-131 ms with $$$TE_{SE} =108 ms$$$ (48 timepoints); TR=3500 ms, resolution=2.5x2.5x3.0 mm3. The dataset hence contains 54×48 measurements, and the acquisition time is about 32 mins.
The compartmental relaxation times estimated from the combined model are also validated against single-compartment T2 and T2* values, which are estimated from non-diffusion weighted $$$S(b=0,t)$$$ measurements alone.
Simulation
To assess the accuracy and precision of parameter estimation, diffusion-PEPTIDE signals are simulated from the forward model added with random Rician noise (100 realisations). The level of noise achieves an SNR of 30 for $$$S(b=0, TE=84 ms)$$$ measured from in vivo white matter (WM) voxel with multiple b=0 measurements. The tissue parameters are chosen by the estimation from a typical WM voxel in the genu of the corpus callosum, with $$$f_{in}^0=0.55, f_{iso}^0=0.05, T_{2}^{in}=75 ms, T_{2}^{*in}=60 ms, T_2^{en}=50 ms$$$ and $$$T_2^{*en}=45 ms$$$, which are in agreement with previous findings5,9.
Results and Discussion
The predicted noise-free signals from our model agree well with the measured signals in terms of TE and diffusion gradient dependence (Fig.2A). The $$$f_{in}(t)$$$and $$$f_{iso}(t)$$$ estimated in the first stage show TE-dependence, and the orientation dispersion index shows little time-dependence as expected (Fig.2B).The distributions of estimated parameters from simulated data (Fig.3) suggest parameters of the typical case can be estimated correctly with minimal bias; the estimation precision for $$$T_2^{in}$$$ and $$$T_2^{*in}$$$ is much higher than $$$T_2^{en}$$$ and $$$T_2^{*en}$$$. This is likely because the $$$T_2^{in}$$$ and $$$T_2^{*in}$$$ is higher than $$$T_2^{en}$$$ and $$$T_2^{*en}$$$, hence higher effective SNR for the intra-neurite signals. The higher $$$T_2^{in}$$$ than $$$T_2^{en}$$$ in most WM voxels is suggested on in vivo parametric maps (Fig.4), which agrees with the previous findings3,5; $$$T_2^{*in}$$$ and $$$T_2^{*en}$$$ estimated from our method in the WM also agrees well with the range given in a previous WM study9. Finally, the $$$T_2^{in}$$$ and $$$T_2^{*in}$$$ are not contaminated by CSF at the tissue boundary, a benefit of the combined and multi-compartment modelling (Fig.5).
Conclusion
The relaxometry-diffusion combined modelling with diffusion-PEPTIDE imaging enables intra-/extra-neurite T2 and T2* mapping simultaneously in the brain for the first time. Future work will explore the applications of this method to study changes of tissue microenvironment, such as iron content.Acknowledgements
No acknowledgement found.References
1. Slator, P. J. et al. Combined diffusion-relaxometry microstructure imaging: Current status and future prospects. Magnetic Resonance in Medicine (2021) doi:10.1002/mrm.28963.
2. Kim, D., Wisnowski, J. L., Nguyen, C. T. & Haldar, J. P. Multidimensional correlation spectroscopic imaging of exponential decays: From theoretical principles to in vivo human applications. NMR Biomed. (2020) doi:10.1002/nbm.4244.
3. Veraart, J., Novikov, D. S. & Fieremans, E. TE dependent Diffusion Imaging (TEdDI) distinguishes between compartmental T2 relaxation times. Neuroimage (2018) doi:10.1016/j.neuroimage.2017.09.030.
4. Lampinen, B. et al. Searching for the neurite density with diffusion MRI: Challenges for biophysical modeling. Hum. Brain Mapp. 40, 2529–2545 (2019).
5. Gong, T. et al. MTE-NODDI: Multi-TE NODDI for disentangling non-T2-weighted signal fractions from compartment-specific T2 relaxation times. Neuroimage 217, (2020).
6. Kirilina, E. et al. Superficial white matter imaging: Contrast mechanisms and whole-brain in vivo mapping. Sci. Adv. (2020) doi:10.1126/sciadv.aaz9281.
7. Hutter, J. et al. Integrated and efficient diffusion-relaxometry using ZEBRA. Sci. Rep. (2018) doi:10.1038/s41598-018-33463-2.
8. Slator, P. J. et al. Combined diffusion-relaxometry MRI to identify dysfunction in the human placenta. Magn. Reson. Med. (2019) doi:10.1002/mrm.27733.
9. Kleban, E., Tax, C. M. W., Rudrapatna, U. S., Jones, D. K. & Bowtell, R. Strong diffusion gradients allow the separation of intra- and extra-axonal gradient-echo signals in the human brain. Neuroimage (2020) doi:10.1016/j.neuroimage.2020.116793.
10. Fair, M. J., Liao, C., Manhard, M. K. & Setsompop, K. Diffusion-PEPTIDE: Distortion- and blurring-free diffusion imaging with self-navigated motion-correction and relaxometry capabilities. Magn. Reson. Med. (2021) doi:10.1002/mrm.28579.
11. Zhang, H., Schneider, T., Wheeler-Kingshott, C. A. & Alexander, D. C. NODDI: Practical in vivo neurite orientation dispersion and density imaging of the human brain. Neuroimage 61, 1000–1016 (2012).
12. Alexander, D. C., Dyrby, T. B., Nilsson, M. & Zhang, H. Imaging brain microstructure with diffusion MRI: practicality and applications. NMR in Biomedicine vol. 32 186–198 (2019).
Figures
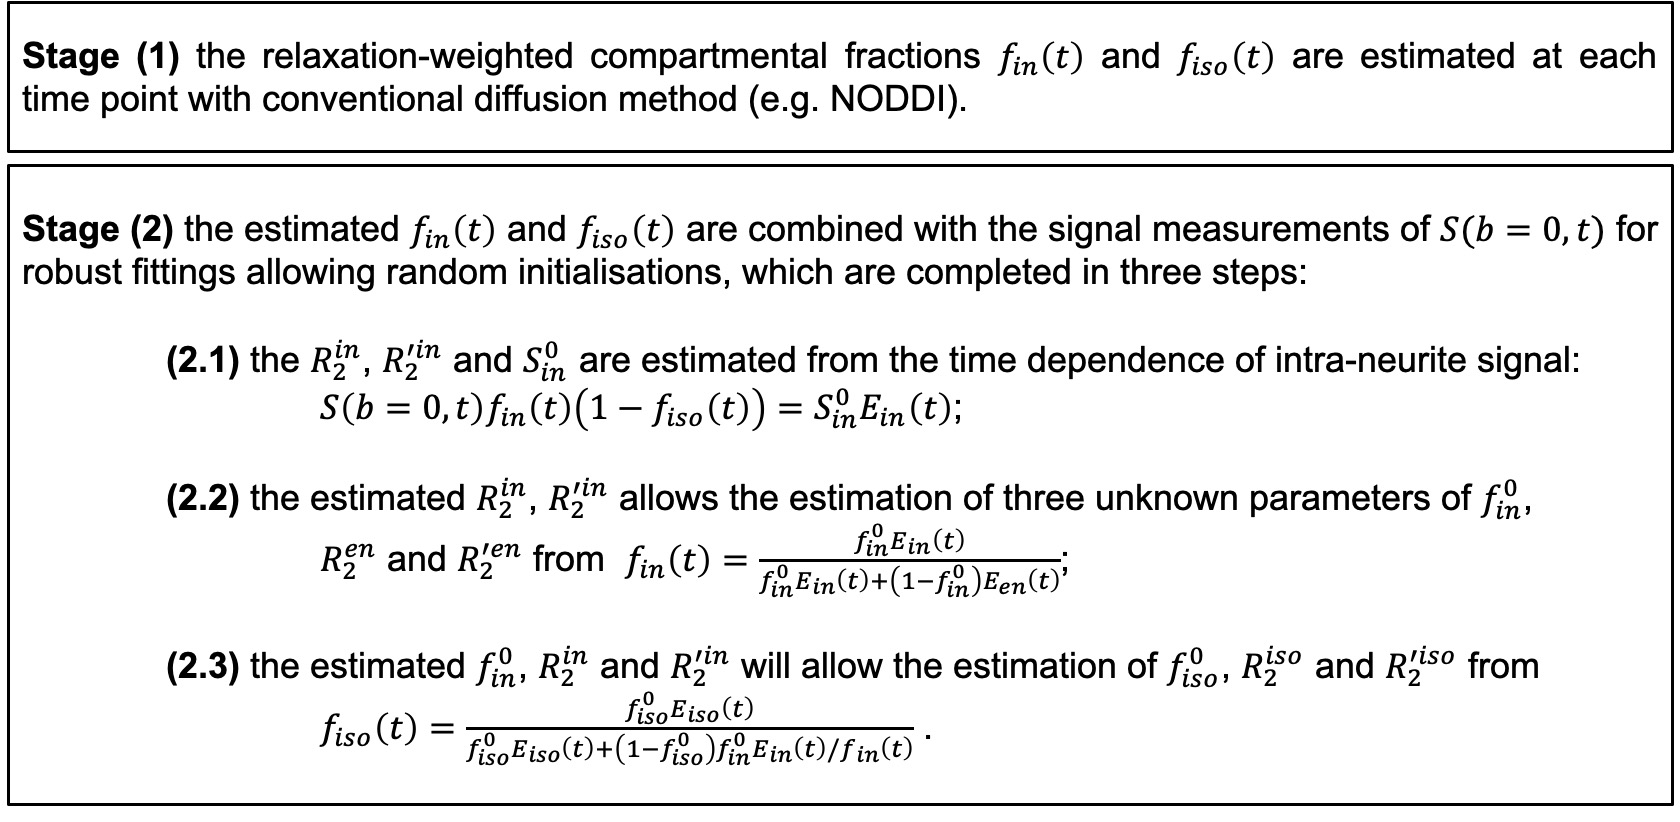

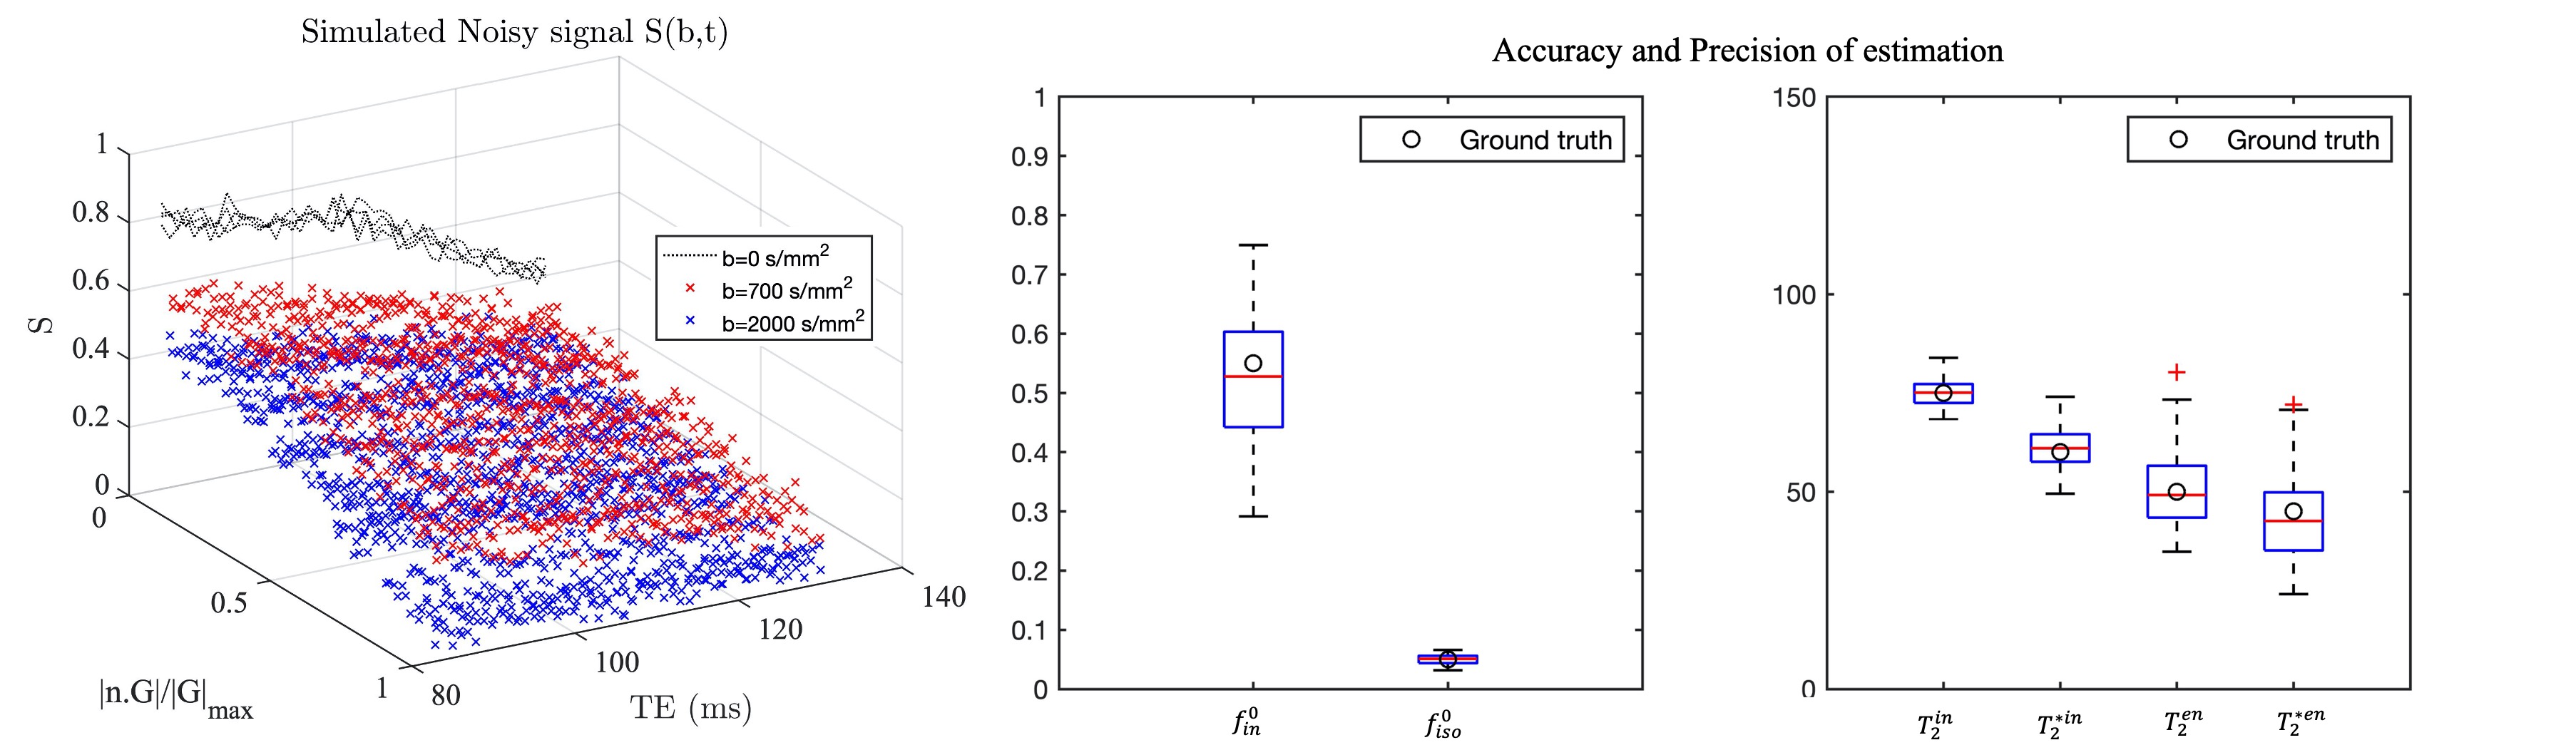
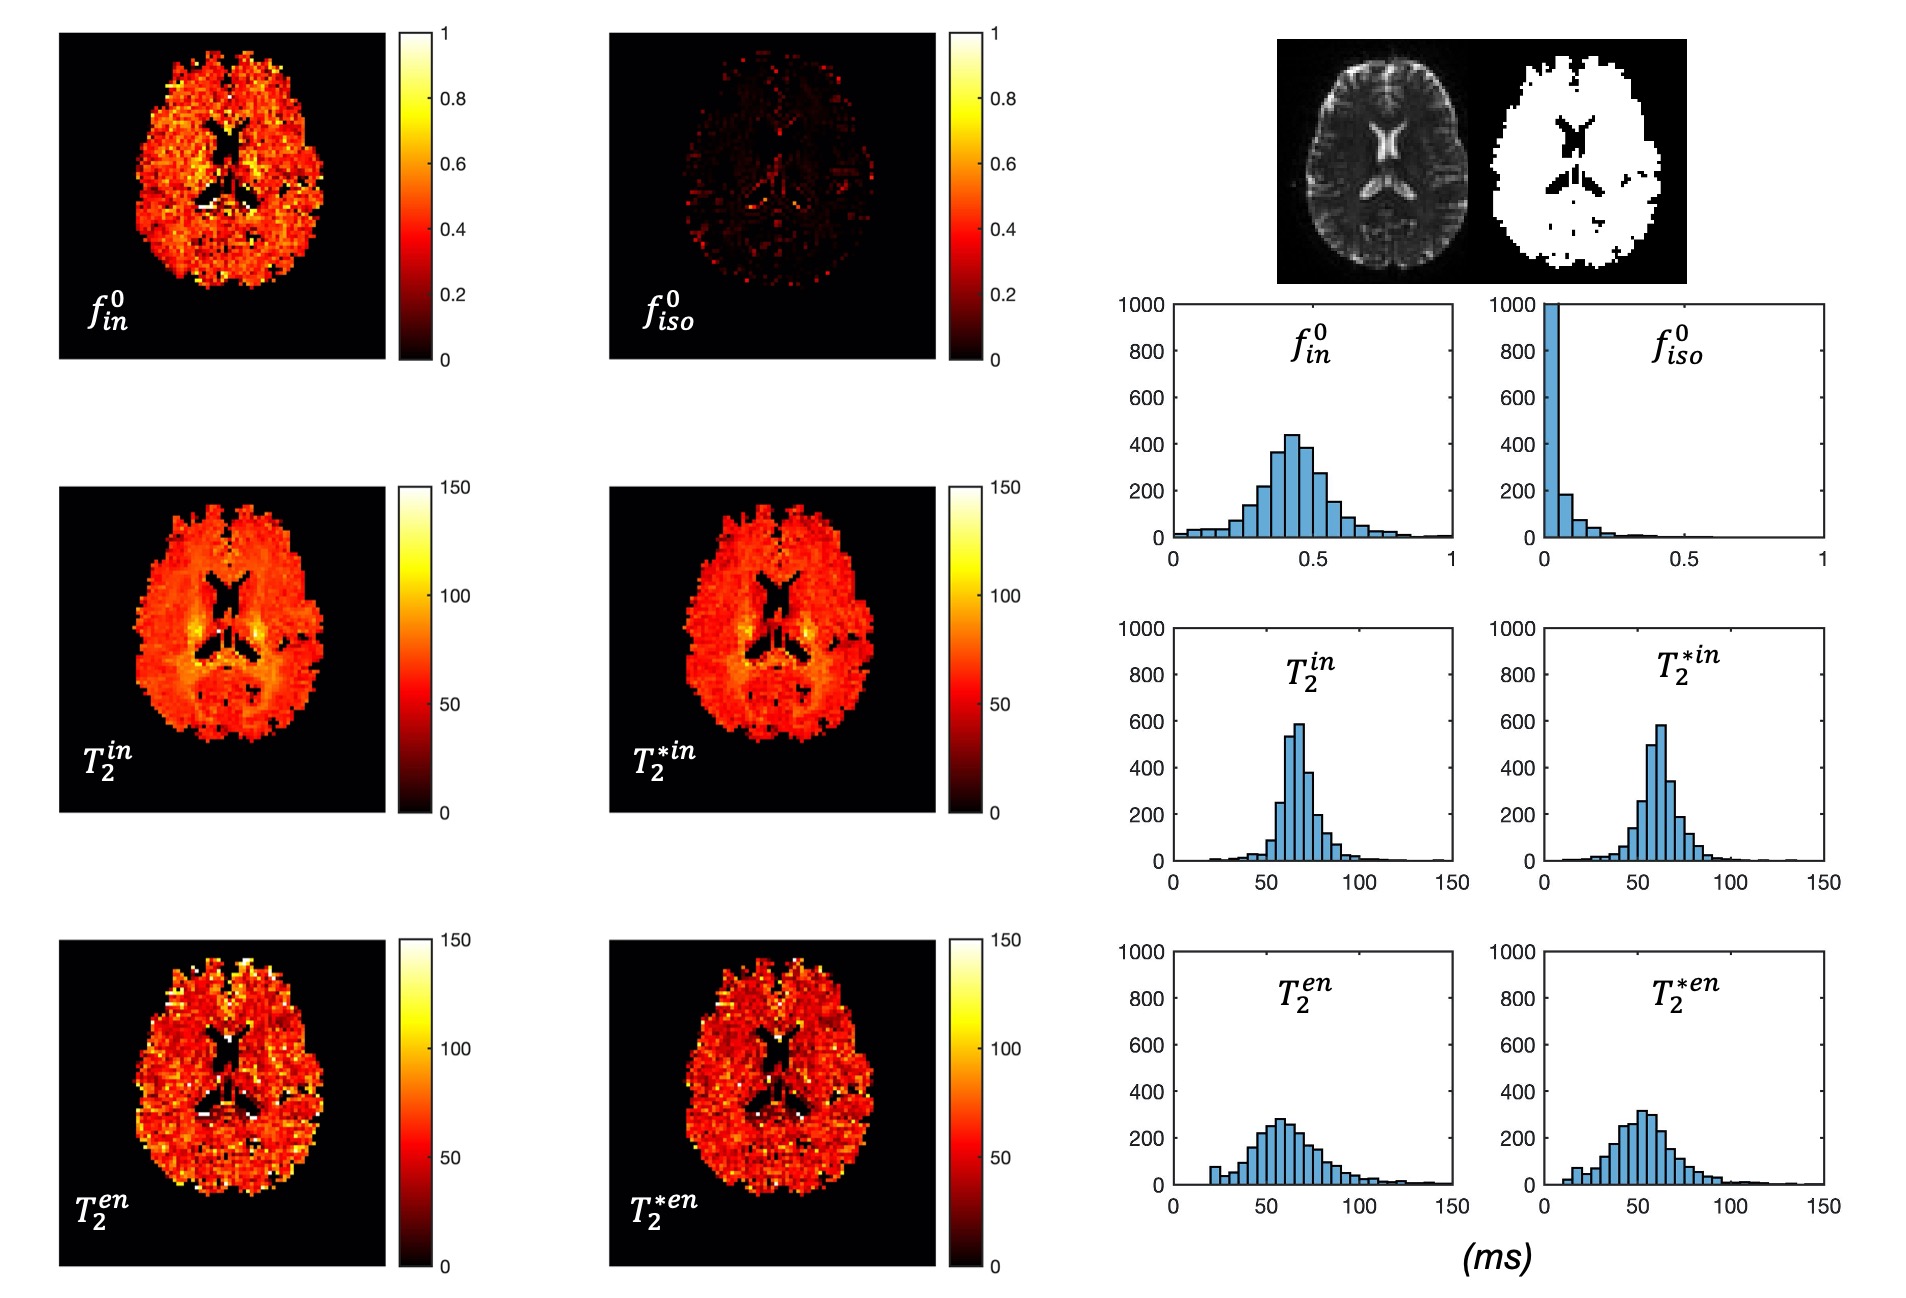

Figure 5: Comparison between single-compartment (SC) T2 and T2* estimation (top) and the intra-neurite T2 and T2* (bottom). At the tissue boundary, intra-neurite T2 and T2* will not be affected by CSF contamination as in the SC-T2 and SC-T2* estimated with relaxometry data alone.