1346
Efficient MTsat mapping using sparse MP2RAGE for T1 and M0 measurement with B1+ inhomogeneity correction1McConnell Brain Imaging Centre, McGill University, Montreal, QC, Canada, 2Neurology and Neurosurgery, McGill University, Montreal, QC, Canada, 3Hotchkiss Brain Institute and Departments of Radiology and Clinical Neuroscience, University of Calgary, Calgary, AB, Canada, 4Biomedical Engineering, McGill University, Montreal, QC, Canada
Synopsis
In this study we investigate the use of MP2RAGE derived M0 and T1 maps for use in MTsat imaging. These values are compared against maps calculated from the traditional VFA approach. Additionally, the MP2RAGE approach is evaluated with and without sparse sampling and compressed sensing reconstruction. We show that VFA produces elevated T1 values, and consequently lower MTsat compared to MP2RAGE approaches. A model-based ΔB1+ correction was able to remove the dependence of MTsat on ΔB1+. The sparse MP2RAGE provided high quality maps, leading to a full MTsat protocol that was 32% faster than the traditional approach.
Introduction
Magnetization transfer saturation (MTsat) is a semi-quantitative method that is used commonly as a biomarker for tissue myelin content1,2. This technique requires an MT-weighted image and knowledge of the longitudinal relaxation rate (T1) and equilibrium magnetization (M0). Traditionally, the M0 and T1 maps have been generated using a variable flip angle (VFA) experiment3–5. The VFA approach is impacted by incomplete spoiling6,7, B1+ inhomogeneities (ΔB1+), which can be corrected post hoc, and motion between scans. Furthermore, VFA is known to overestimate T1 by up to 20%8,9, which will produce artificially lower MTsat values.MP2RAGE is a T1 mapping method that acquires two separate images following an inversion pulse, and uses a lookup table derived from Bloch simulations to extract M0 and T1 maps11. Since an MP2RAGE is often acquired in studies for an anatomical reference, the use of this data for MTsat calculation avoids the acquisition of redundant data. While MP2RAGE will also be impacted by incomplete spoiling, but to a lesser extent, it has a decreased B1+ dependence, and no motion differences between the images because they are acquired simultaneously. MP2RAGE T1 values have been shown to be in strong agreement with the gold standard inversion recovery T1 mapping method8. This increased accuracy comes with longer acquisition times, which can be offset with higher acceleration factors. While a fully sampled MP2RAGE is long, a novel sparse MP2RAGE sequence can be used to acquire the necessary maps faster than the traditional VFA experiment12.
This study compares the M0 and T1 values estimated using VFA, MP2RAGE and a novel sparse MP2RAGE sequence12, as well as the MTsat maps derived from these three sets of M0 and T1 maps and an MT-weighted image.
Methods
MR images were collected in five healthy adults (aged 30-35 years, four female) using a 3T-PrismaFit scanner (Siemens, Germany) with a 32-channel receive coil. All images used prescan normalize to generate M0 maps with minimal receive bias. B1+ maps were acquired using a fast turboflash sequence13. All images were registered to a T1-weighted MPRAGE image, which was used as input for the FreeSurfer (v7.2) recon-all pipeline, with manual edits to remove dura mater.MP2RAGE-based M0 and T1 maps were fit using a lookup table approach while incorporating ΔB1+. All three VFA maps and the MP2RAGE-based MTsat maps were computed using previous equations1,2, with ΔB1+ included in the flip angle values. MTsat was corrected for ΔB1+ with a model-based correction factor14. An ROI analysis was done in native subject space, using the wmparc.mgz segmentation from FreeSurfer. Three ROIs were chosen to investigate differences across different brain tissue types: thalamus (subcortical grey matter [GM]), caudal middle frontal GM (cortical GM), and superior frontal white matter (WM). ROI values between methods were statistically compared using an ANOVA, with Bonferroni correction for nine comparisons across a contrast.
Results
The full MTsat protocol using the sparse MP2RAGE was 27% faster than with the conventional MP2RAGE, and 32% than the VFA approach. Representative maps in a single subject are displayed in Figure 2. Visually, there is strong agreement between the M0 maps, with a slight scaling difference between the VFA and MP2RAGE-based T1 and MTsat maps. Figure 3 replicated previous reports8,9, that VFA and MP2RAGE T1 values are significantly different in the brain. In Figure 4, the Bland-Altman plots in the third column highlight that there are minimal differences between the conventional and sparse MP2RAGE protocols in all three maps. A bias of 100 ms was found in the VFA T1 values. The MTsat values between VFA and MP2RAGE protocols diverged at increasingly higher MTsat values, with up to a ~15% difference observed. Figure 5 highlights the impact of ΔB1+ correction on the different maps. All three VFA derived values demonstrated the largest change with these corrections.Discussion and Conclusions
In this work, we demonstrate that a single MP2RAGE scan can replace the two images required for the VFA portion of MTsat mapping. We replicate previous reports showing that the MP2RAGE produces T1 values without the bias of the VFA approach8,9, which leads to increased MTsat values.The time savings offered with the sparsely sampled MP2RAGE, with minimal impact on data quality, permits the generation of MTsat maps in significantly less time. The sparse MP2RAGE will be beneficial for imaging patient populations where movement might be an issue, and/or to make time to acquire complementary data. Further time reductions can be achieved by using a similar sampling and reconstruction scheme for the MT-weighted image.
The MP2RAGE derived maps displayed a decreased dependence on ΔB1+, which remained after correction for ΔB1+. The decreased dependence of the calculated MP2RAGE maps on ΔB1+ will make this useful for MTsat at ultra-high field. Initial work has demonstrated that MP2RAGE T1 mapping is more reproducible compared to the VFA approach at 7T15. MP2RAGE is also a practical option at ultra-high field, as MP2RAGE images are typically collected in place of an MPRAGE to obtain a uniform anatomical image. Finally, the model-based ΔB1+ correction of MTsat values has been demonstrated to be effective at 3T, but work remains to show its effectiveness over the larger range of ΔB1+ seen at ultra-high field strengths.
Acknowledgements
This project has been made possible by the Brain Canada Foundation, through the Canada Brain Research Fund, with the financial support of Health Canada and the Natural Sciences and Engineering Research Council of Canada, the Fonds de recherche du Québec – Santé, Healthy Brains for Healthy Lives, the Campus Alberta Innovates Program, Quebec BioImaging Network, Jeanne Timmins Costello and Dr. David T.W. Lin.
References
1. Helms G, Dathe H, Kallenberg K, Dechent P. High-resolution maps of magnetization transfer with inherent correction for RF inhomogeneity and T1 relaxation obtained from 3D FLASH MRI. Magn Reson Med. 2008;60(6):1396-1407. doi:10.1002/mrm.21732
2. Helms G, Dathe H, Kallenberg K, Dechent P. Erratum to: Helms, Dathe, Kallenberg and Dechent, High-resolution maps of magnetization transfer with inherent correction for Rf inhomogeneity and T1 relaxation obtained from 3D FLASH MRI. Magn Reson Med 2008 Dec;60(6):1396-1407. Magn Reson Med. 2010;64(6):1856. doi:10.1002/mrm.22607
3. Christensen KA, Grant DM, Schulman EM, Walling C. Optimal determination of relaxation times of Fourier transform nuclear magnetic resonance. Determination of spin-lattice relaxation times in chemically polarized species. J Phys Chem. 1974;78(19):1971-1977. doi:10.1021/j100612a022
4. Venkatesan R, Lin W, Haacke EM. Accurate determination of spin-density and T1 in the presence of RF- field inhomogeneities and flip-angle miscalibration. Magn Reson Med. 1998;40(4):592-602. doi:10.1002/mrm.1910400412
5. Weiskopf N, Suckling J, Williams G, et al. Quantitative multi-parameter mapping of R1, PD*, MT, and R2* at 3T: a multi-center validation. Front Neurosci. 2013;7(June):1-11. doi:10.3389/fnins.2013.00095
6. Baudrexel S, Nöth U, Schüre JR, Deichmann R. T1 mapping with the variable flip angle technique: A simple correction for insufficient spoiling of transverse magnetization. Magn Reson Med. 2018;79(6):3082-3092. doi:10.1002/mrm.26979
7. Preibisch C, Deichmann R. Influence of RF spoiling on the stability and accuracy of T1 mapping based on spoiled FLASH with varying flip angles. Magn Reson Med. 2009;61(1):125-135. doi:10.1002/mrm.21776
8. Tsialios P, Thrippleton M, Glatz A, Pernet C. Evaluation of MRI sequences for quantitative T1 brain mapping. J Phys Conf Ser. 2017;931:012038. doi:10.1088/1742-6596/931/1/012038
9. Siversson C, Tiderius CJ, Neuman P, Dahlberg L, Svensson J. Repeatability of T1-quantification in dGEMRIC for three different acquisition techniques: Two-dimensional inversion recovery, three-dimensional look locker, and three-dimensional variable flip angle. J Magn Reson Imaging. 2010;31(5):1203-1209. doi:10.1002/jmri.22159
10. Jutras JD, Wachowicz K, Gilbert G, De Zanche N. SNR efficiency of combined bipolar gradient echoes: Comparison of three-dimensional FLASH, MPRAGE, and multiparameter mapping with VFA-FLASH and MP2RAGE. Magn Reson Med. 2017;77(6):2186-2202. doi:10.1002/mrm.26306
11. Marques JP, Kober T, Krueger G, van der Zwaag W, Van de Moortele PF, Gruetter R. MP2RAGE, a self bias-field corrected sequence for improved segmentation and T1-mapping at high field. Neuroimage. 2010;49(2):1271-1281. doi:10.1016/j.neuroimage.2009.10.002
12. Mussard E, Hilbert T, Forman C, Meuli R, Thiran JP, Kober T. Accelerated MP2RAGE imaging using Cartesian phyllotaxis readout and compressed sensing reconstruction. Magn Reson Med. 2020;84(4):1881-1894. doi:10.1002/mrm.28244
13. Chung S, Kim D, Breton E, Axel L. Rapid B1+mapping using a preconditioning RF pulse with turboFLASH readout. Magn Reson Med. 2010;64(2):439-446. doi:10.1002/mrm.22423
14. Rowley CD, Campbell JSW, Wu Z, et al. A Model-based Framework for Correcting B1+ Inhomogeneity Effects in Magnetization Transfer Saturation and Inhomogeneous Magnetization Transfer Saturation Maps. Magn Reson Med. 2021;In Review.
15. Voelker MN, Kraff O, Goerke S, et al. The traveling heads 2.0: Multicenter reproducibility of quantitative imaging methods at 7 Tesla. Neuroimage. 2021;232(January):117910. doi:10.1016/j.neuroimage.2021.117910
Figures
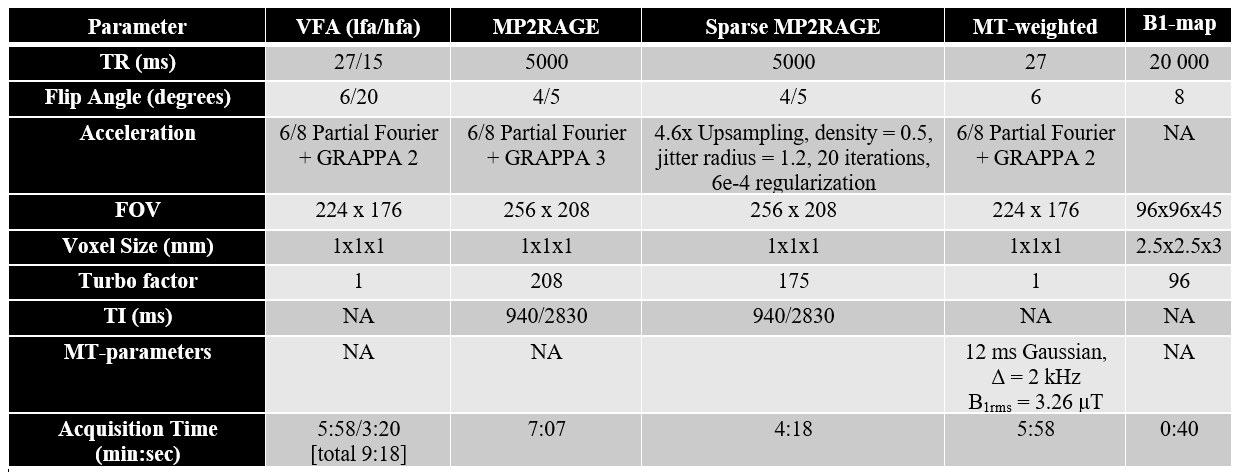
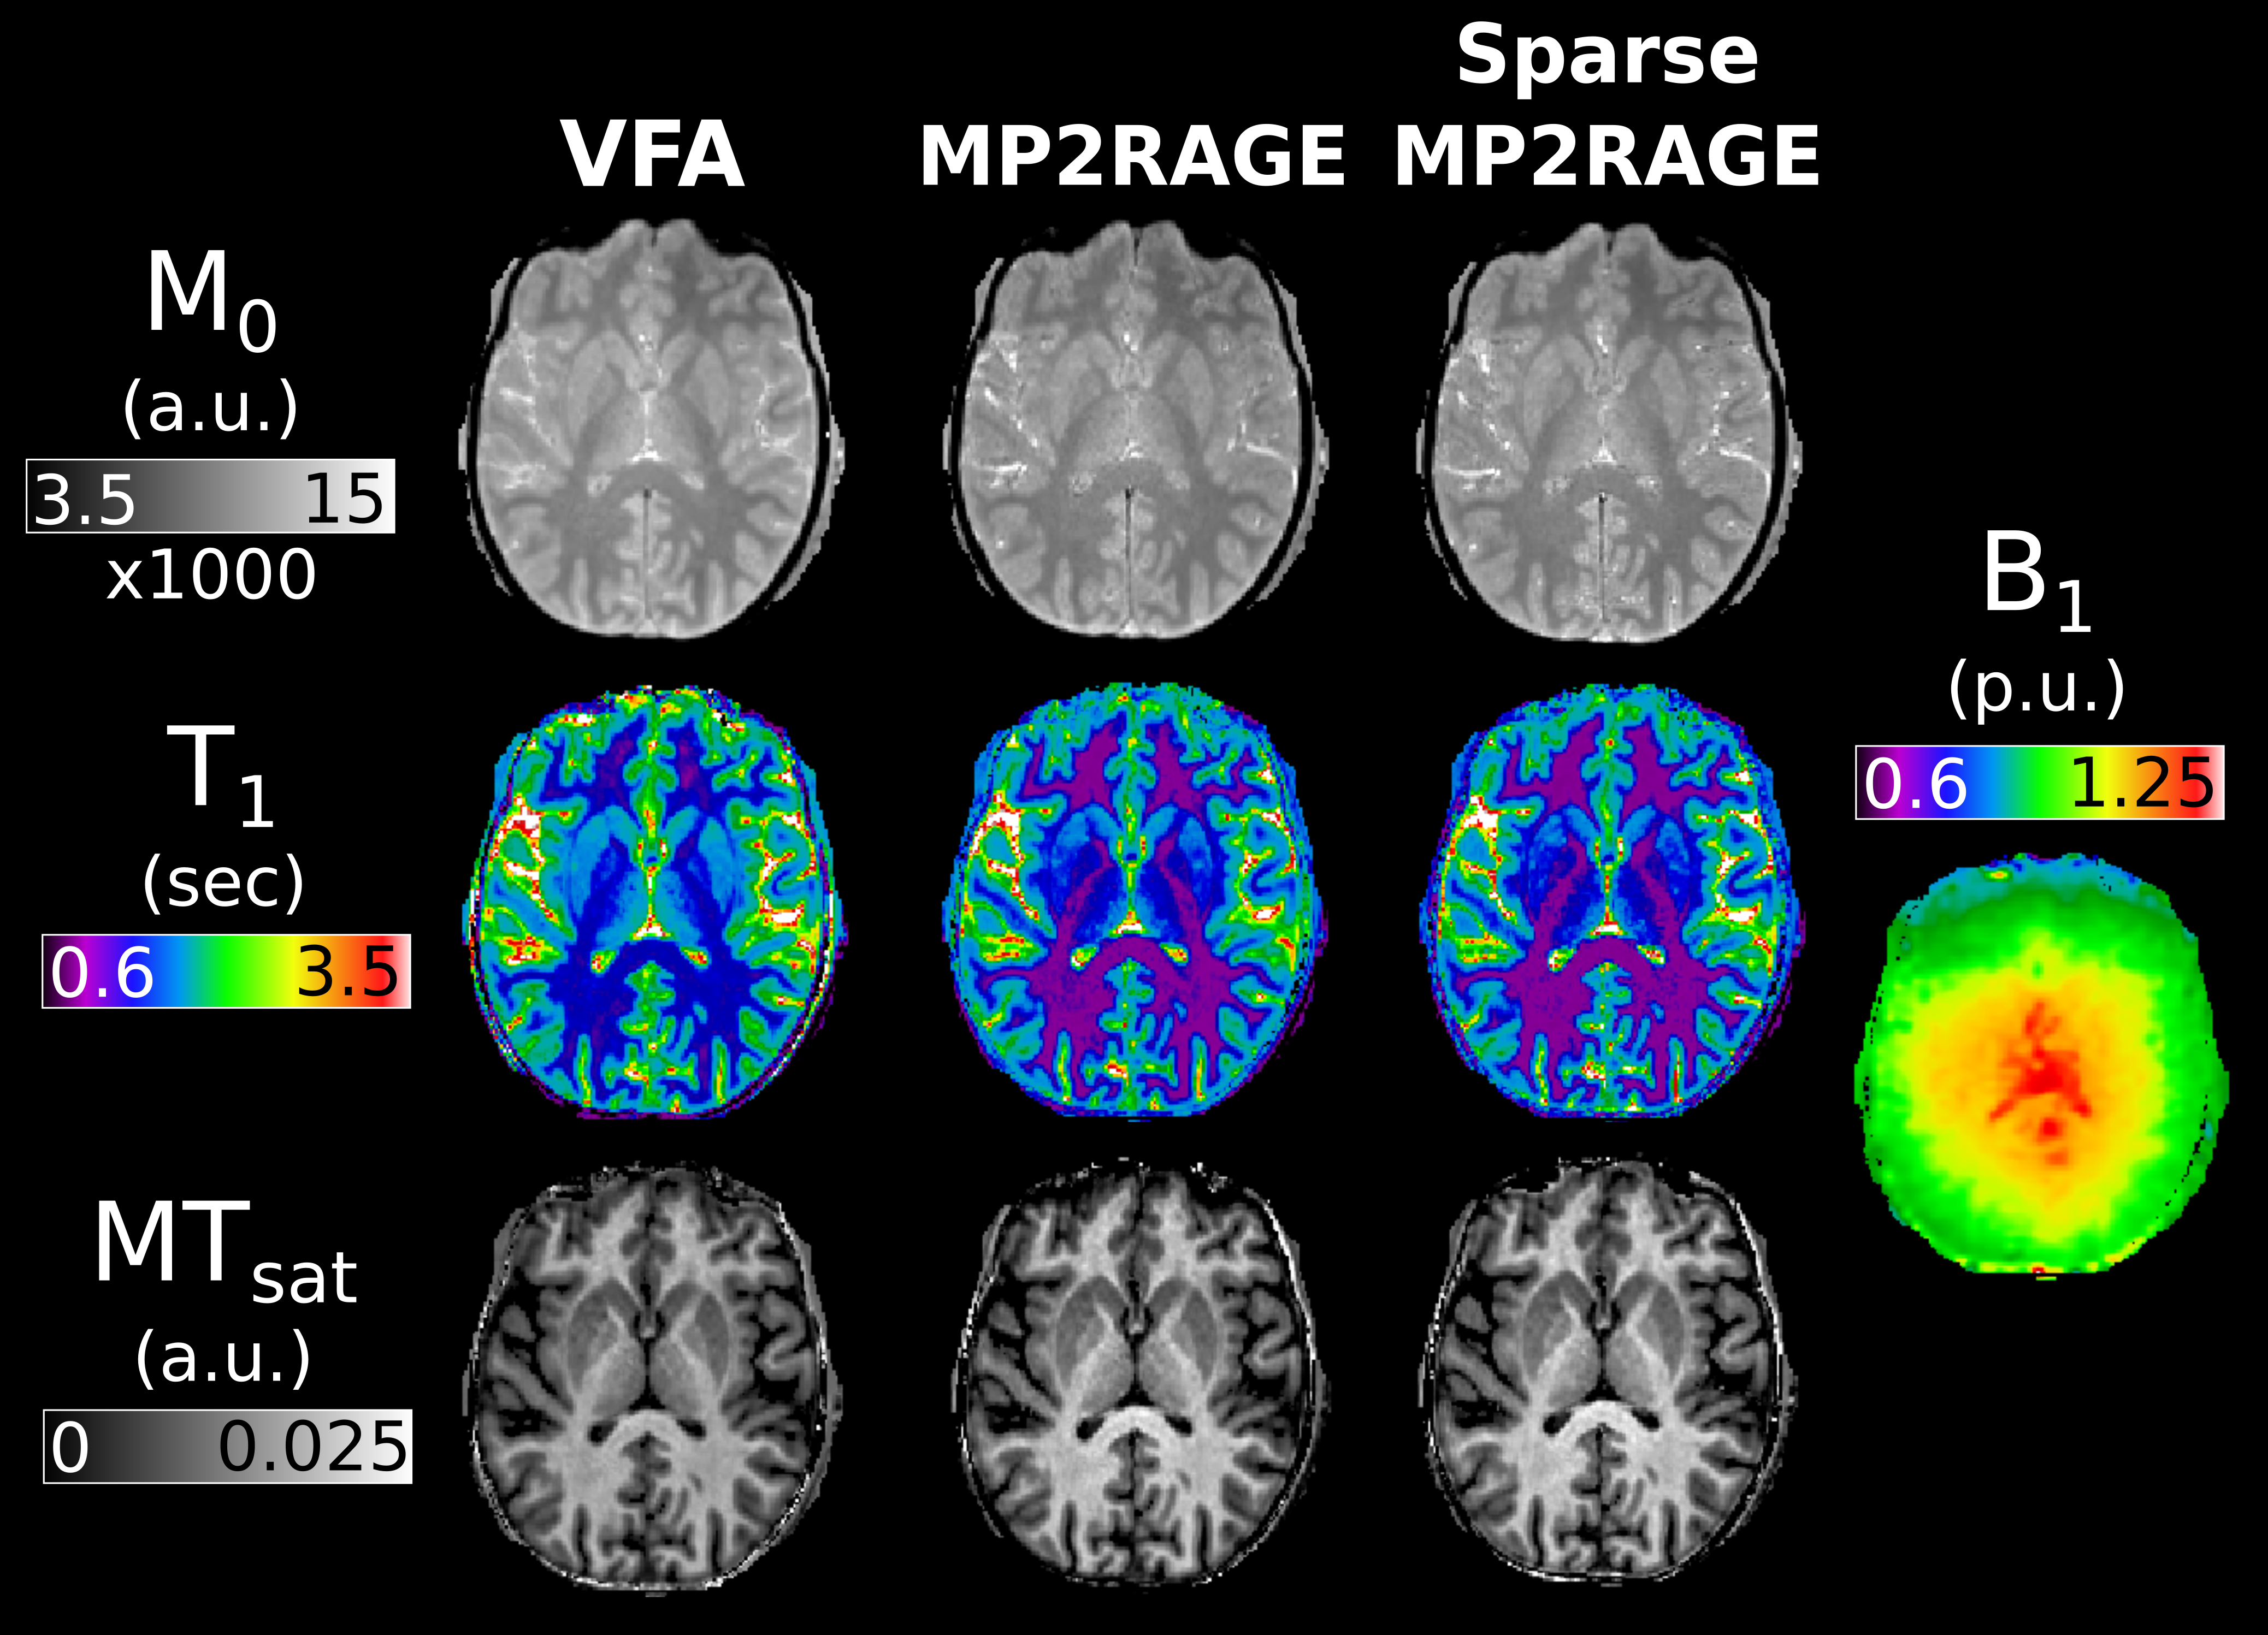
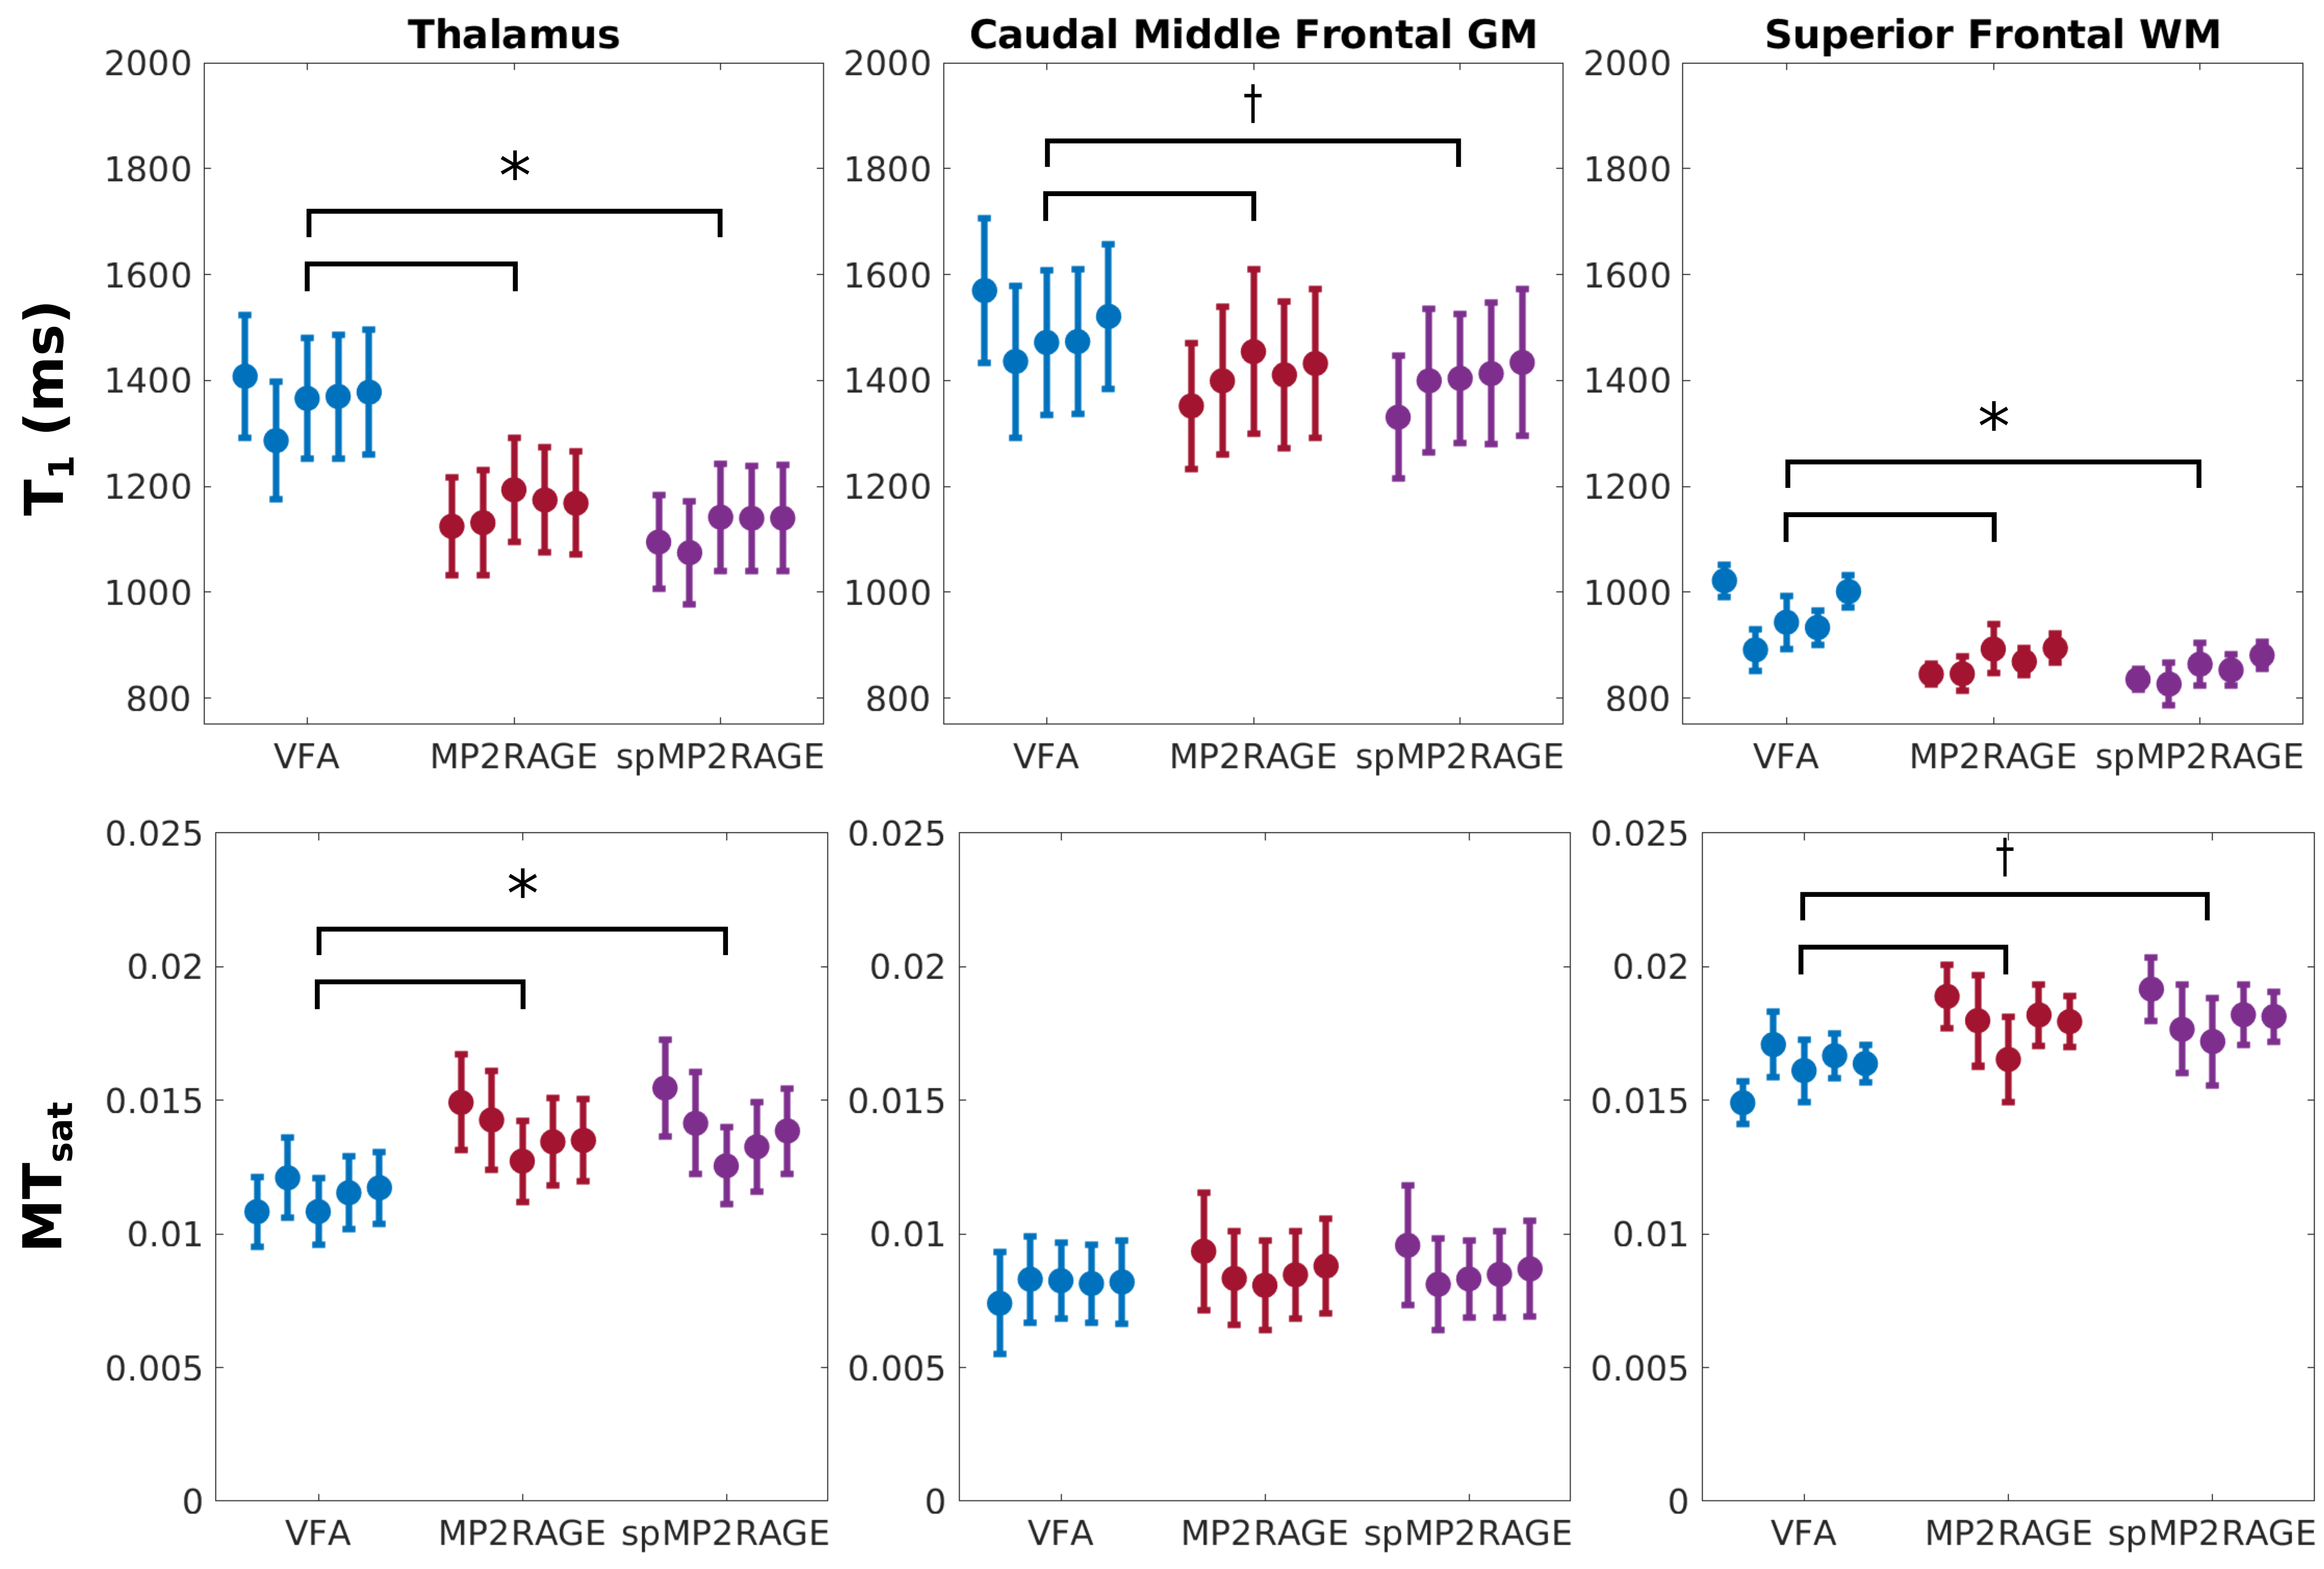
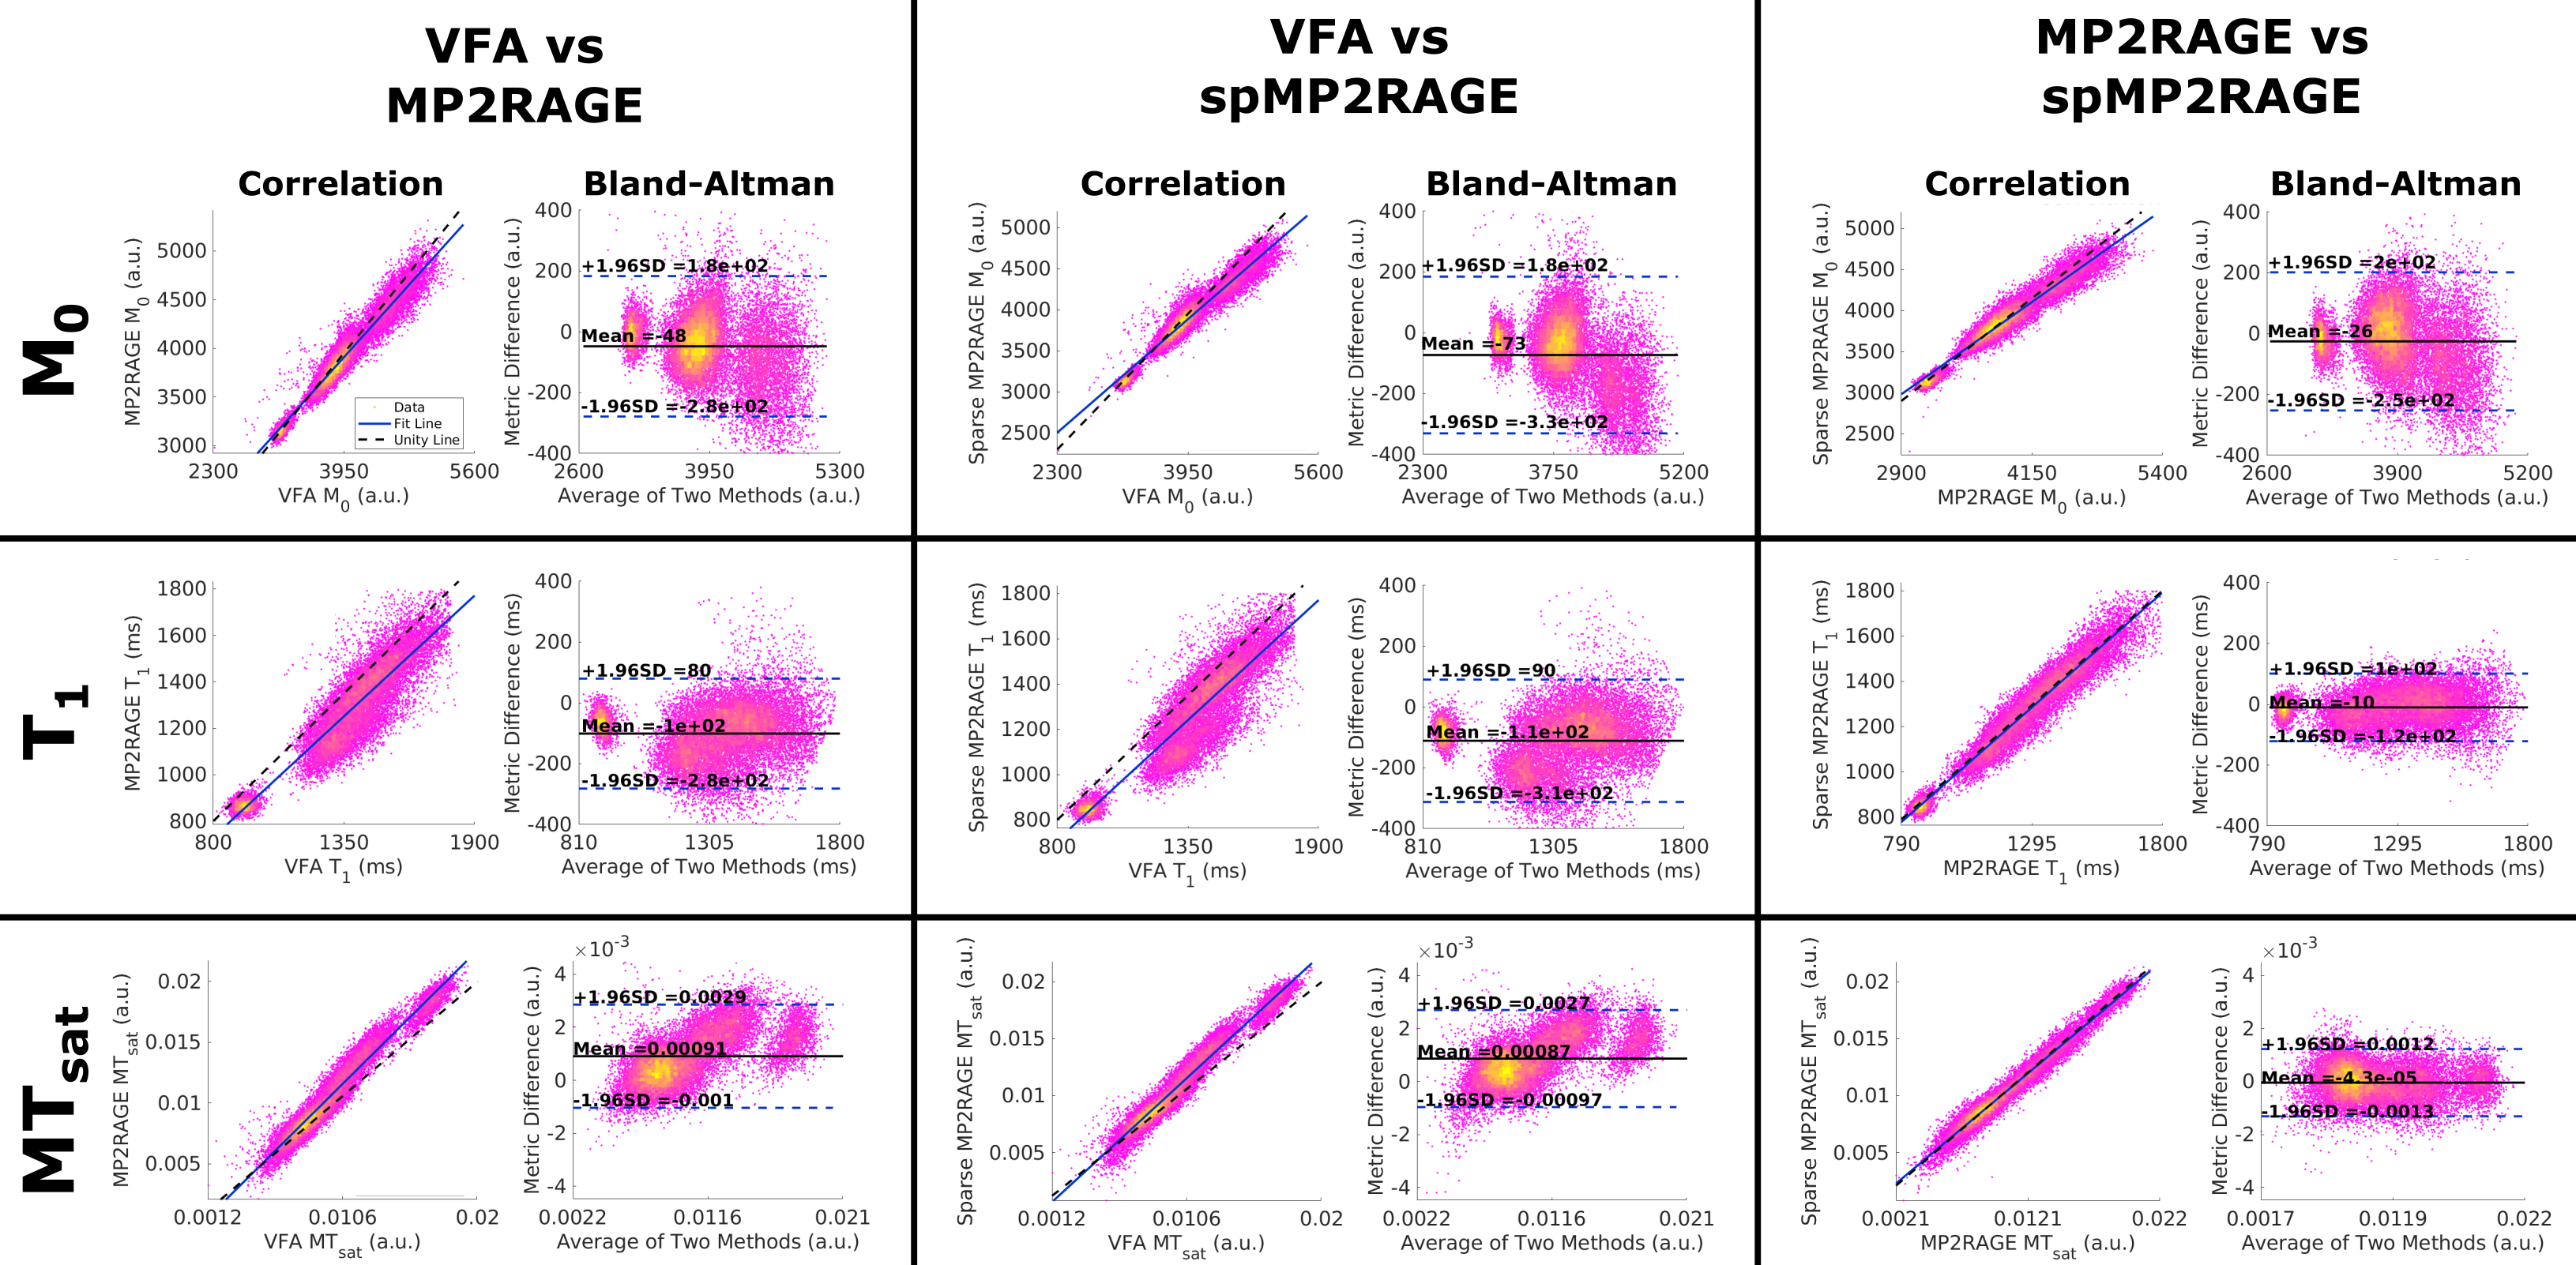
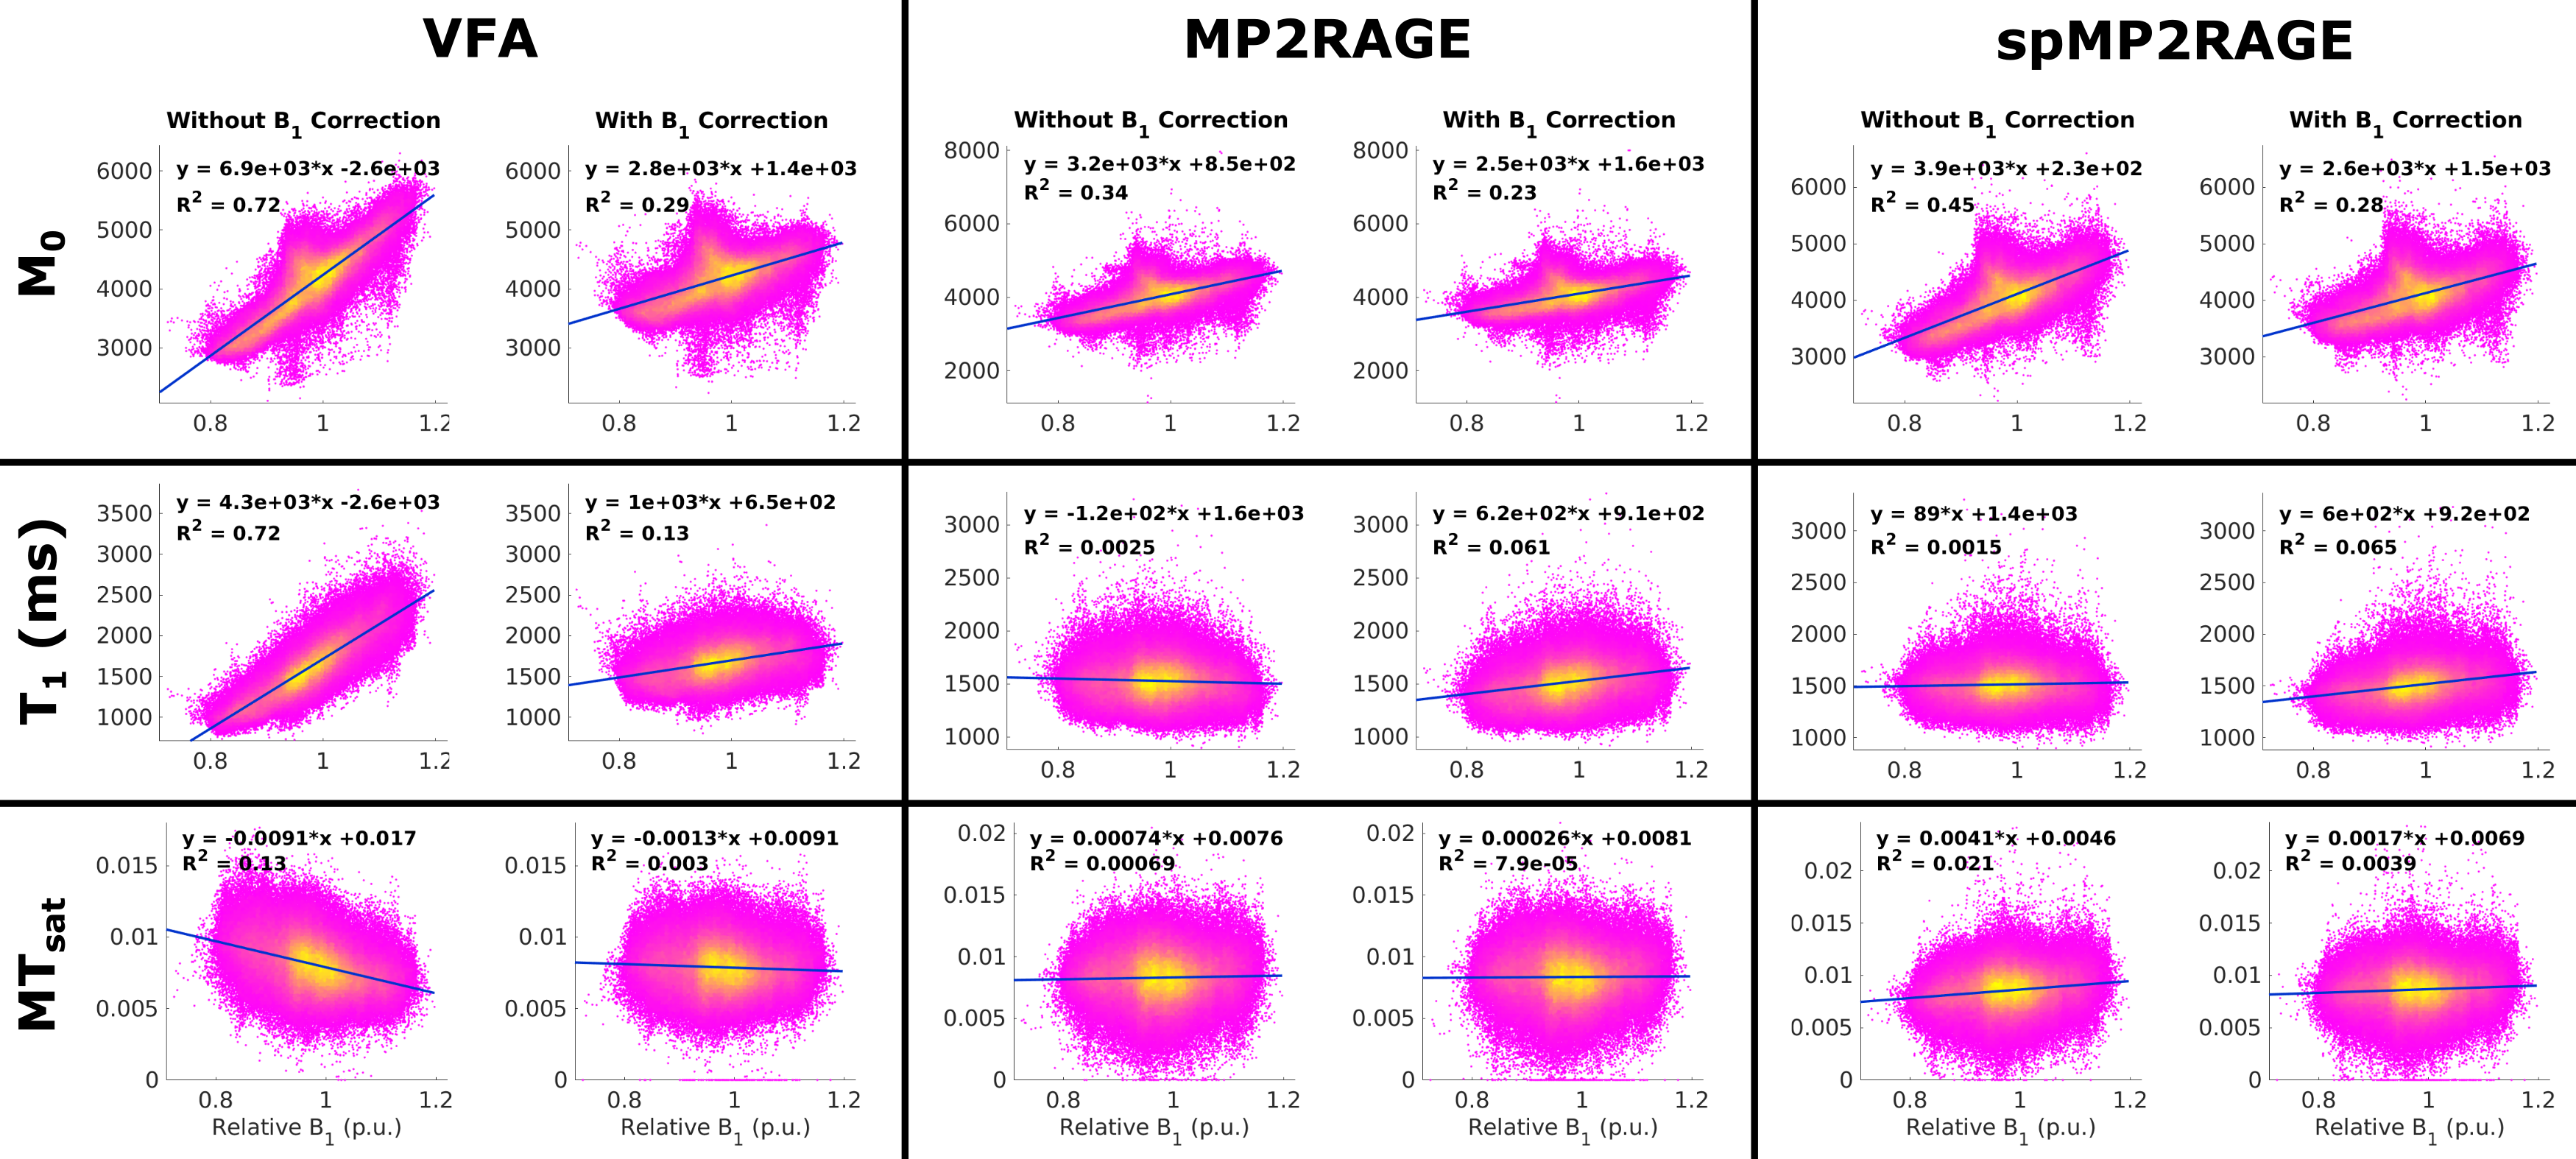
Figure 5: Correlation of brain map values in the cerebral cortex with ΔB1+ to visualize the impact of ΔB1+ correction. M0 maps displayed a reduction in correlation with ΔB1+ with correction. The remnant correlation suggests a natural anatomical variation that spatially correlates with the B1+ field. VFA maps displayed the largest change when corrected for ΔB1+. MP2RAGE is known to have minimal ΔB1+ dependence, and this is observed in the respective T1 and MTsat maps, where a minor change is seen with added B1+ correction.