1345
Improving annotation accuracy in MRI data using MR Fingerprinting and deep learning1Radiology, Case Western Reserve University, Cleveland, OH, United States, 2Physics, Case Western Reserve University, Cleveland, OH, United States, 3Radiology, University Hospitals Cleveland Medical Center, Cleveland, OH, United States
Synopsis
In this study, we introduced a new deep learning method to take advantage of both radiologists’ expertise and multi-parametric MR Fingerprinting data to improve annotation accuracy in MRI dataset. A U-Net based convolutional neural network was adopted and each dataset was evaluated multiple times using different combinations of training dataset. Our initial results obtained from a brain tumor dataset demonstrates that the developed method could effectively identify mislabeled tissues and improve annotation accuracy.
Introduction
Annotated MR imaging data with high accuracy is critical for clinical and research purposes. MRI data are typically labeled by experienced radiologists. To ensure accurate labeling, radiologists tend to only label areas where they have high confidence. Complete labeling of every suspicious pixel is often difficult to achieve, if not impossible. Thus the accuracy of human-annotated images will always be limited. MR Fingerprinting is a new quantitative imaging method that provides high sensitivity based on simultaneous encoding of multiple important tissue properties (1). MRF can also yield fully automatic tissue segmentation directly from the raw data. However, due to the heterogeneities especially associated with abnormal tissues, it cannot provide 100% accuracy either. In this study, we introduced a new deep learning method to take advantage of both radiologists’ expertise and multi-parametric MRF data to improve annotation accuracy in MRI dataset. We show improved annotation accuracy in brain tumor datasets (2), and the method can be generally applied to dataset acquired from other organs.Methods
MRI data acquired from 43 adult patients with brain tumors were examined in this study. These included 28 subjects with grade-4 gliomas (GBM) and 15 subjects with low-grade gliomas (LGGs). For each subject, clinical standard MRI protocols including MPRAGE, FLAIR, post-contrast T1-weighted images were acquired. In addition, a 3D MRF protocol was applied at the baseline condition and the imaging parameters included FOV, 30×30 cm; matrix size, 256×256; slice thickness, 3 mm; time frame, 1440; scan time, 4.6 min (3). The MRF data was reconstructed offline to calculate the timecourse (MR fingerprint) for each pixel. Three tissue property maps including T1, T2 and proton density were then computed using pattern matching based on the MRF dictionary (1).A region-of-interest (ROI) analysis was performed to delineate abnormal brain regions in MRF T1 maps, based on the clinical standard images, histopathological findings, and quantitative MRF maps. The annotation was approved by a neuroradiologist. A total of four classes were labeled, including high-grade gliomas, low-grade gliomas, peritumor white matter (PWM), and necrosis (NEC). Partial volume (PV) analysis was further performed on the rest of normal brain tissues and three classes including white matter (WM), gray matter (GM) and cerebrospinal fluid (CSF) were segmented automatically (4).
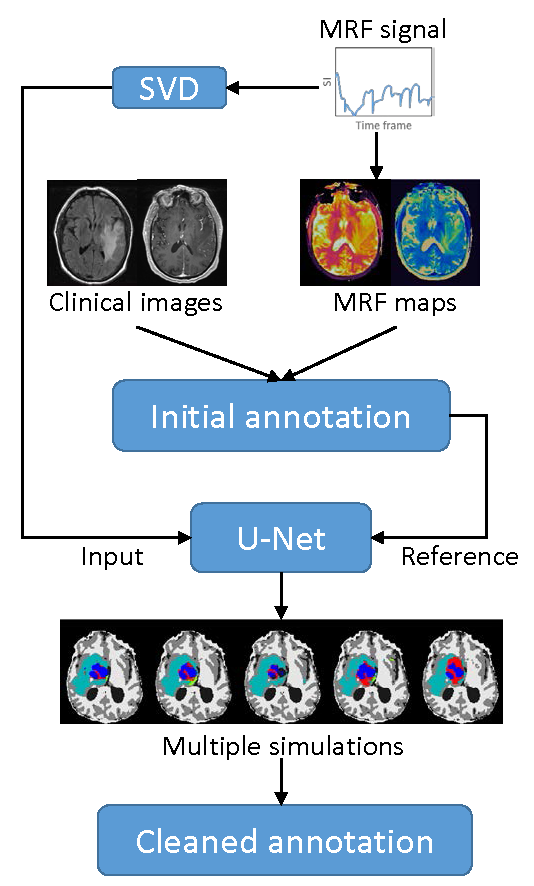
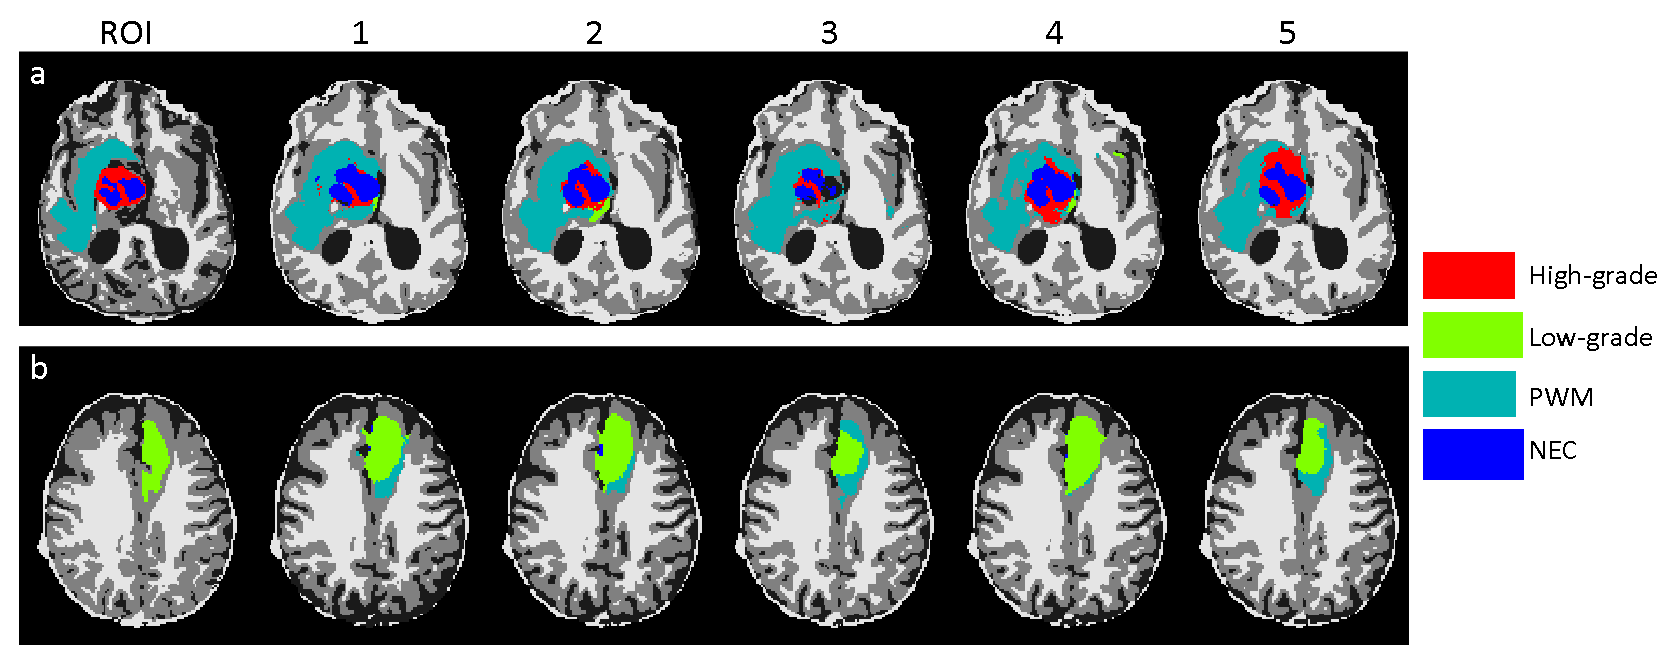
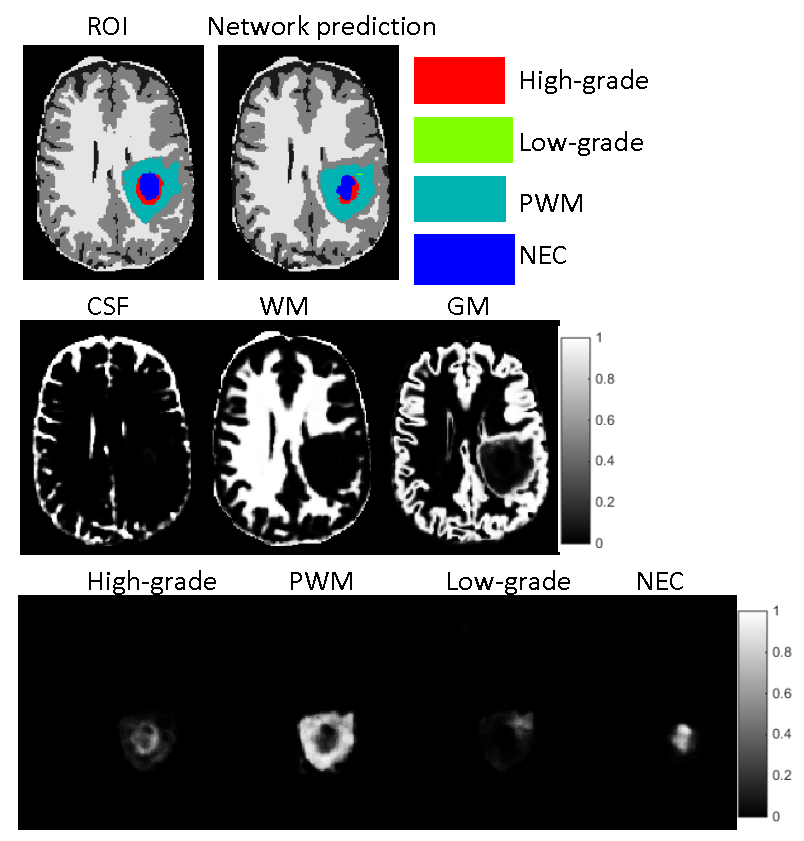
A deep learning method leveraging MRF data was developed to clean the annotation from the ROI analysis (Fig 1). A convolutional neural network using U-Net was first established for brain tissue segmentation (5). Instead of using input from clinical standard images, an MRF acquisition with 1440 time points was used. To reduce the number of network parameters, SVD compression was applied to yield 25 SVD components before feeding into the network (6). The results from ROI analysis and PV analysis were used as the ground truth during the training. Besides the enhanced input data based on MR fingerprint, a patch-based approach (32x32) was also applied to further utilize spatial correlation in the MRF data to enhance tissue characterization. Ten-fold cross validation was performed for all 43 subjects. To correct imperfect delineation of brain tissues, this training/testing process was repeated five times by randomly assigning 43 subjects into different training and testing cohorts. In this manner, the segmentation of each dataset was repeated multiple times based on input from different combinations of training datasets. In this study, we assume all the manually annotated abnormal areas were correct and the cleaning was only applied to the rest of brain regions outside of the radiologist annotations. For each pixel, if it was identified as abnormal tissue (any of the four classes) more than 50% of the time (at least 3 times out of 5 trainings), it was assigned as abnormal tissue (Fig 2). The final classification for this pixel was determined by the probability maps obtained from the five trainings (Fig 3). The abnormal tissue class with the highest probability calculated from five individual probability maps was assigned to this pixel.
Results
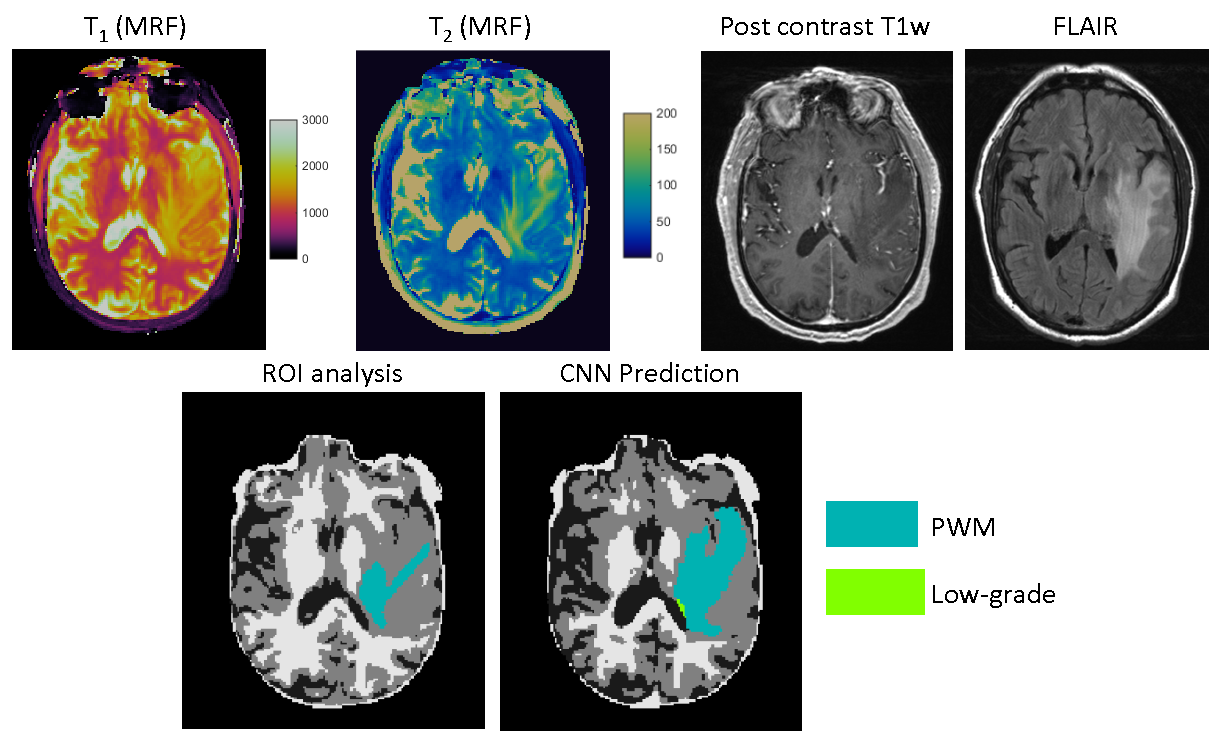
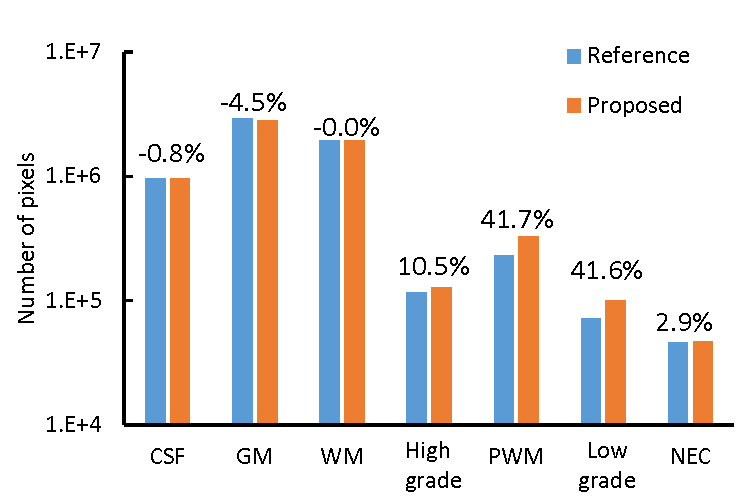
Fig 4 shows representative results obtained from a GBM patient. Extra PWM regions were predicted by the proposed method which matches to the MRF T1/T2 maps, FLAIR, and post-contrast T1-weighted images. Fig 5 shows the total number of pixels cleaned using the proposed method. Most of the pixels were identified from prior GM regions (4.5%), which leads to substantial increases in all four abnormal tissue classes.Discussion and Conclusion
In this study, we developed a deep learning method to combine radiologists’ labeling and MRF data to automatically clean annotated MRI dataset. Note that the MRF data was acquired at the baseline condition without contrast administration. Our preliminary results suggest that it could effectively identify mislabeled tissues and improve annotation accuracy.Acknowledgements
No acknowledgement found.References
1. Ma D, et al. Nature, 2013; 187–192.
2. Badve C, et al. ASNR, 2017; 492-499.
3. Ma D, et al. MRM, 2015; 2190-2197.
4. Deshmane A, et al. NRM in Biomed, 2019; 1-17.
5. Fang Z, et al. TMI, 2019; 2364-2374.
6. McGivney DF, et al. TMI, 2014; 2311-2322.
Figures