1344
Measuring the Impact of Pineapple Juice on Quantitative Liver MRI Metrics cT1, Iron and PDFF at 1.5T and 3T
Yi-Chun Wang1,2, Faezeh Sanaei-Nezhad1, Joao Peixoto1, Carolina Fernandes1, Alex Smith1, Matthew Robson1, and Rajarshi Banerjee1
1Perspectum Ltd., Oxford, United Kingdom, 2University of Oxford, Oxford, United Kingdom
1Perspectum Ltd., Oxford, United Kingdom, 2University of Oxford, Oxford, United Kingdom
Synopsis
Pineapple juice (PJ) is used in Magnetic Resonance Cholangiopancreatography to suppress gastrointestinal tract signals. To explore how PJ affects multiparametric liver MRI, 30 participants underwent scans before and after ingesting PJ. Image data were analysed with LiverMultiScan (yielding iron corrected T1 (cT1), iron, and PDFF) and statistically compared. The changes post PJ administration were statistically significant for cT1 at both 1.5T and 3T but not for iron and PDFF. However, the repeatability analysis indicates the post PJ administration cT1 changes were smaller than the repeatability limits of agreement, suggesting that PJ has neglect-able clinical effect on multiparametric liver MRI.
Introduction
Orally administered pineapple juice (PJ), due to its high manganese concentration, has been found to provide a comparable visual effect (reducing T2 signal of the gastrointestinal tract and therefore making it appear dark in T2 weighted images) as the commercial contrast agent Ferumoxsil during Magnetic Resonance Cholangiopancreatography (MRCP) examinations 1. However, it is unclear whether PJ changes quantitative metrics such as iron-corrected T1 (cT1), iron, and proton density fat fraction (PDFF) in the liver. The aim of this study was to investigate whether the changes in cT1, iron, and PDFF values from PJ oral administration are statistically significant and if so, whether those changes are larger than the measurement variation for repeatability.Methods
Study Design:30 participants were recruited to undergo quantitative MR acquisitions in the liver once before and once after PJ oral administration. Each participant was given approximately 400ml of PJ 20 minutes before the second scan. 13 and 17 participants were scanned with the Siemens MAGNETOM Avanto-fit 1.5T scanner and with the Siemens MAGNETOM Prisma 3T scanner, respectively.
Multiparametric MR Acquisition and Quantification:
After the localiser scan, the LiverMultiScan (Perspectum, UK) quantitative MR protocol was used to acquire one transversal slice of a participant's liver, centred through the porta-hepatis. The MR protocol consists of a multi-echo spoiled-gradient-echo chemical shift encoded acquisition to calculate iron and PDFF maps and a ShMOLLI sequence to derive T1-relaxation from the segmented liver slice 2.
Statistical Analysis:
Shapiro Wilk test was performed on the cT1, iron and PDFF metrics for both 1.5T and 3T data in the PJ experiment to assess normality. To determine whether the changes post PJ administration are statistically significant, a paired two-sided T test was performed on cT1 pre-PJ and post-PJ metrics; a Wilcoxon Signed Rank test was performed for the iron and PDFF pre-PJ and post-PJ metrics. The statistical analyses were all conducted with the Python3 Scipy library.
Clinical Relevance Comparison:
A previously conducted repeatability analysis in our institution was used to help interpret the PJ experiment’s clinical relevance, specifically regarding the cT1 changes in the PJ experiment after the paired two-sided T test results. In the repeatability analysis, 55 participants were recruited to undergo two identical consecutive LiverMultiScan quantitative MR acquisitions in the liver (in-out-in scanner) with no PJ. Amongst the 55 participants, 30 and 25 participants were scanned with the Siemens MAGNETOM Avanto-fit 1.5T scanner and with the Siemens MAGNETOM Prisma 3T scanner, respectively. Bland-Altman analysis 3 was performed on the cT1 values for both the repeatability analysis and the pineapple juice experiment. The derived Bland-Altman 95% limits of agreements (LoA) from both experiments were compared.
Results
The Shapiro Wilk test results revealed that the cT1 pre PJ and post PJ data sets were both normally distributed at 1.5T and 3T and were therefore fit for the paired two-sided T test. However, the iron and PDFF data sets were not normally distributed and therefore the Wilcoxon Signed Rank test was performed for the paired analysis. As shown in Table.1, in the PJ experiment, the cT1 changes post PJ administration were statistically significant at both 1.5T data (p = 0.018) and 3T data (p = 0.002). The Wilcoxon Signed Rank test showed the changes in iron and PDFF post PJ administration were not statistically significant at both 1.5T and 3T. There were no change for iron post PJ administration at 1.5T data (p = 0.259) and at 3T data (p = 1.0). For PDFF, there was a decrease of 0.2% at 1.5T data (p = 0.074) and a decrease of 0.5% at 3T data (p = 0.111) post PJ administration.Bland-Altman analysis is plotted with the differences between two sets of paired data points against the means of the data. The Bland-Altman 95% limits of agreement (LoA) is defined as two standard deviations from both sides of the mean of the differences3 (presented as dotted lines in Figure.1 and Figure.2). Effectively, the LoA in the repeatability represent measurement variation. The difference between the PJ experiment and repeatability analysis is whether pineapple juice was given to the participant prior to the second scan. As shown in Figure.1 and Figure.2, the LoA (Pre PJ – Post PJ) for liver cT1 in the PJ experiment (-32.73ms to 13.97ms at 1.5T; -60.72ms to 22.14ms at 3T) were within those of the repeatability analysis (-46.2ms to 16.1ms at 1.5T; 1-76.9ms to 52.9ms at 3T) meaning that the differences of cT1 between pre and post PJ data sets were within the measurement variation of repeatability analysis.
Discussion and Conclusion
We can conclude that even though the changes in cT1 post PJ administration were found to be statistically significant, these changes were within typical measurement variation and smaller than the typical changes seen with disease (often >100ms) 4. The changes in iron and PDFF were not statistically significant. Mechanistically, one might expect Manganese to reduce the T1, but it is of importance to note that fluid intake can result in a T1 increase. In conclusion, this work suggests that PJ does not contraindicate liver quantitative MRI metrics: cT1, iron and PDFF.Acknowledgements
This work was funded by Perspectum Ltd., Oxford, United KingdomReferences
- Riordan, R. D., Khonsari, M., Jeffries, J., Maskell, G. F., & Cook, P. G. (2004). Pineapple juice as a negative oral contrast agent in magnetic resonance cholangiopancreatography: A preliminary evaluation. The British Journal of Radiology, 77(924), 991–999. https://doi.org/10.1259/bjr/36674326
- Dennis, A., Kelly, M. D., Fernandes, C., Mouchti, S., Fallowfield, J. A., Hirschfield, G., Pavlides, M., Harrison, S., Chakravarthy, M. V., Banerjee, R., & Sanyal, A. (2021). Correlations Between MRI Biomarkers PDFF and cT1 With Histopathological Features of Non-Alcoholic Steatohepatitis. Frontiers in Endocrinology, 11, 1053. https://doi.org/10.3389/fendo.2020.575843
- Bland, J. M., & Altman, D. G. (1986). Statistical methods for assessing agreement between two methods of clinical measurement. Lancet (London, England), 1(8476), 307–310.
- Banerjee, R., Pavlides, M., Tunnicliffe, E. M., Piechnik, S. K., Sarania, N., Philips, R., Collier, J. D., Booth, J. C., Schneider, J. E., Wang, L. M., Delaney, D. W., Fleming, K. A., Robson, M. D., Barnes, E., & Neubauer, S. (2014). Multiparametric magnetic resonance for the non-invasive diagnosis of liver disease. Journal of Hepatology, 60(1), 69–77. https://doi.org/10.1016/j.jhep.2013.09.002
Figures
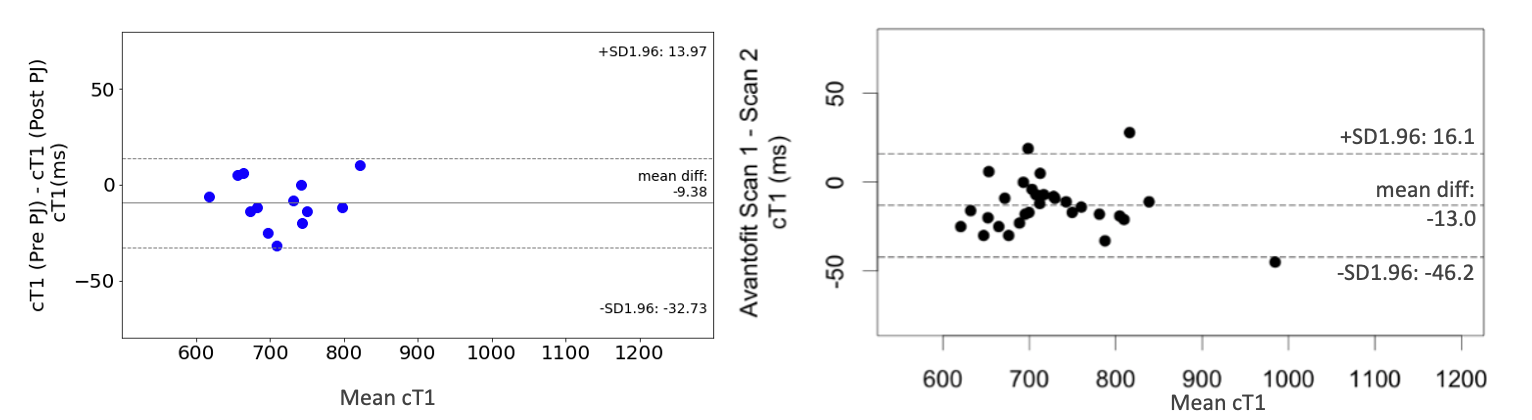
Figure.1 Bland-Altman plot of cT1 acquired with Siemens MAGNETOM Avanto-fit 1.5T scanner for the PJ experiment (left) and repeatability analysis (right).

Figure.1 Bland-Altman plot of cT1 acquired with Siemens MAGNETOM Prisma 3T scanner for the PJ experiment (left) and repeatability analysis (right).
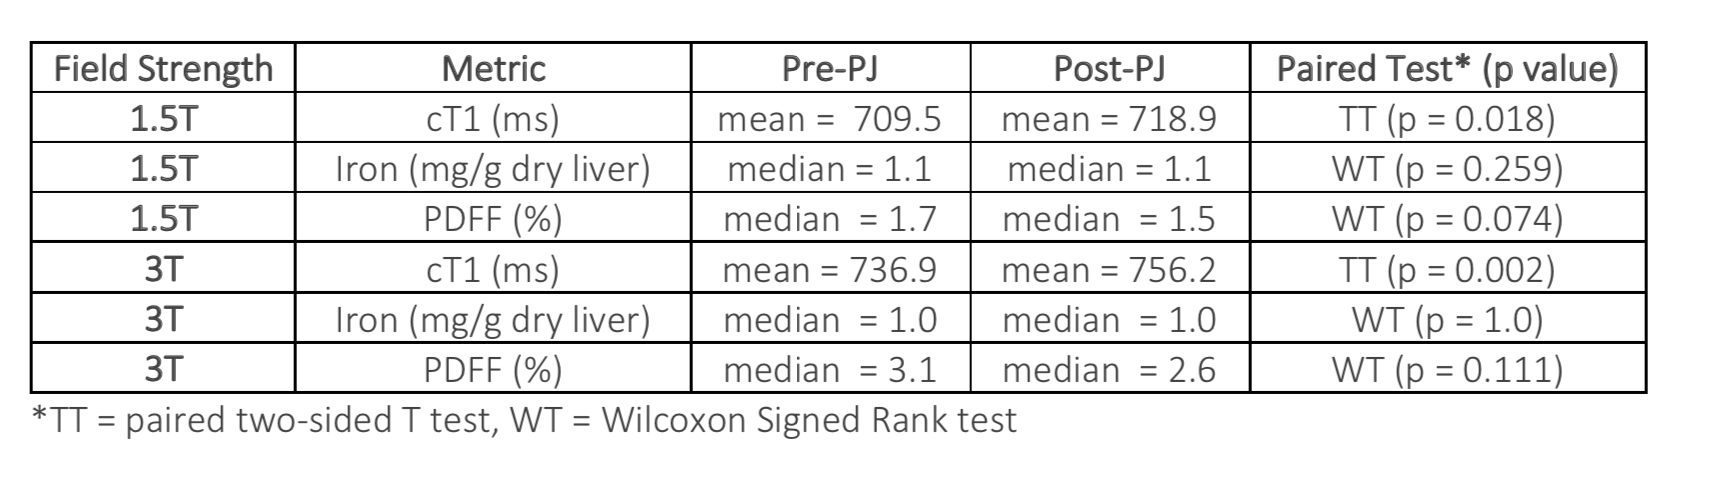
Table.1 A summary of paired statistical test results on cT1, iron and PDFF metrics pre- and post- pineapple juice administration at 1.5T and 3T.
DOI: https://doi.org/10.58530/2022/1344