1343
A hybrid EPG-hGLLiM method for accurate fat-signal modeling in skeletal muscle T2 mapping
Pierre-Yves Baudin1,2, Ericky Caldas de Almeida Araujo1,2, Harmen Reyngoudt1,2, and Benjamin Marty1,2
1NMR Laboratory, Institute of Myology, Neuromuscular Investigation Center, Paris, France, 2NMR Laboratory, CEA, DRF, IBFJ, MIRCen, Paris, France
1NMR Laboratory, Institute of Myology, Neuromuscular Investigation Center, Paris, France, 2NMR Laboratory, CEA, DRF, IBFJ, MIRCen, Paris, France
Synopsis
In order to improve the reliability of the muscle T2 as a clinical outcome in clinical studies of neuromuscular disorders, we investigate the accuracy of the fat signal modeling in transverse relaxometry from multi-spin echo imaging. A new approach for muscle T2/fat-fraction mapping is proposed, combining a water signal dictionary with water T2/B1-dependent entries created from EPG simulations, and a hybrid Gaussian Locally Linear Mapping (hGLLiM) to provide B1-dependent fat signals. Preliminary results on a dataset of healthy controls, DMD and IBM patients are consistent with common knowledge, but interesting divergences are found when compared to another recent approach.
Introduction
Transverse relaxometry in multi-spin echo (MSE) imaging is frequently used as an MRI outcome measure in clinical studies of neuromuscular disorders (NMD) such as the Duchenne muscular dystrophy (DMD) or the inclusion-body myositis (IBM). In many NMDs, skeletal muscle tissues undergo a series of pathological processes, going from inflammation and necrosis to fatty-replacement. While the alteration of the water T2 of the muscle tissue can reflect an ongoing pathological activity, its measurements is often hindered by the presence of lipid deposits, whose T2s are longer. To access the T2 value of the preserved muscle tissue, it is necessary to account for and separate its signal from that of lipids.Several methods have been proposed, providing both water T2 and fat-fraction (FF) estimates: in a first approach1, muscle and fat signals are respectively modeled as one and two exponential decays. In a continuation of this work2, stimulated echoes due to imperfect refocussing are taken into account using an extended-phase graph (EPG) signal simulation, and both water and fat are modeled as single components. In a recent approach3, also using the EPG modeling, the non-constant flip-angles accross the slice due to selective pulses in the MSE sequence are taken into account. Moreover, a second component (T2 approx. 20ms), accounting for a 10% water-fraction within the fat signal, is added to improve the accuracy of the fit. We will refer to this method as 3EPG in the following.
In this research, investigating the accuracy of the fat signal modeling, we propose a new hybrid approach combining MRI-signal simulations and machine learning. We used a water signal dictionary with water T2/B1-dependent entries created from EPG simulations, and trained a hybrid Gaussian Locally Linear Mapping4 (hGLLiM) to provide B1-dependent fat-signals.
Methods
Dataset
The lower limbs of 10 healthy subjects, 19 DMD and 30 IBM patients were scanned on a 3T Siemens PrimaFit.Sequences
In each case, vendor MSE and B1 mapping sequences were run. The parameters of MSE sequence were: num. echos = 17, TE = 9.5 ms, TR = 3000 ms, num. slices = 5-9, matrix size = 320 x 160, pixel spacing = 1.4x1.4 2, inter-slice gap = 5 mm, slice thickness = 10mm. The B1 mapping sequence was turbo flash (XFl) sequence covering the same volume, with the following parameters: TE/TR = 1.78/4750 ms, FA = 8°, BW = 62.72 kHz, pixel spacing = 3.5 × 3.5 mm2, num slices = 5, slice thickness = 10 mm.Post-processing
A “hybrid” algorithm was devised following the pipeline presented in figure 1. The water signal dictionary was generated using the EPG algorithm, accounting for imperfect refocusing due to B1 attenuation and for non constant flip-angle profiles due to the selective pulses of the MSE sequence. The B1 attenuation values used in training of the hGLLiM4 for synthesis of the fat signal were taken from the separate B1 mapping acquisition.In addition, the 3EPG3 method was implemented and run on the same dataset. Older approaches were not tested in this study.
Regions of interest (ROI) were defined on the acquired volumes, selecting most of the individually muscles. The sample mean of the following variables was computed in each ROI: water T2, FF, B1-attenuation, relative L1-residuals (defined as: $$$sum_i |p_i - s_i| / \sum_i |s_i|$$$, with si and pi the acquisition and prediction at the i-th echo-time, respectively).
Results and discussion
We verified that the proposed hybrid method provides low residuals (figure 2). The mean of L1-residuals on the entire dataset was 1.5%, similar to but slightly higher than that of the 3EPG method (1.3%).Figure 3 shows varying degrees of fatty-replacement and patches of elevated water T2 values in a IBM patient, as expected in this pathology.
With the hybrid method, the collected water T2 values in the IBM group were longer and showed a much wider spread than that of the controls. The water T2 of DMD patients also had a wider spread, were longer in legs but shorter in thighs where the fat-fractions are generally high (figure 4). With the 3EPG method, decreased T2s at high FF in infiltrated DMD patients were also observed. Interestingly, in the IBM group, for which the inflammatory component is a key feature, water T2 values were less increased than with the hybrid method.
An important criterion for the suitability of a water T2 mapping approach is the reliability of the model at high fat-fraction. A strong negative T2-FF correlation at high fat-fraction is clearly visible with the 3EPG, but not with the hybrid method, which yields a much higher dispersion of water T2 values (figure 5). Moreover, an unexplained water T2-B1 correlation is observed with the 3EPG method.
Conclusion
We gave a preliminary assessment of a new MSE water T2-FF mapping method, illustrated on a dataset of healthy subjects and NMD patients. While results appear coherent with the common knowledge of both control and patients, we found divergences with another recently proposed method. Further research is ongoing to solidify the choice of method for this important biomarker, in particular to investigate the potential dependency of the muscle T2 to FF or B1 attenuation.Acknowledgements
No acknowledgement found.References
1. Azzabou N, Loureiro de Sousa P, Araujo ECA, Carlier PG. Validation of a generic approach to muscle water T2 determination at 3T in fat-infiltrated skeletal muscle. Journal of Magnetic Resonance Imaging 2014; 41: 645–653.
2. Marty B, Baudin P-Y, Reyngoudt H, Azzabou N, Araujo EC, Carlier PG et al. Simultaneous muscle water T2 and fat fraction mapping using transverse relaxometry with stimulated echo compensation. NMR in biomedicine 2016; 29: 431–443.
3. Keene KR, Beenakker JM, Hooijmans MT, Naarding KJ, Niks EH, Otto LAM et al. T2 relaxation‐time mapping in healthy and diseased skeletal muscle using extended phase graph algorithms. Magn Reson Med 2020; : mrm.28290.
4. Deleforge A, Forbes F, Horaud R. High-Dimensional Regression with Gaussian Mixtures and Partially-Latent Response Variables. Statistics and Computing 2015; 25: 893–911.
Figures
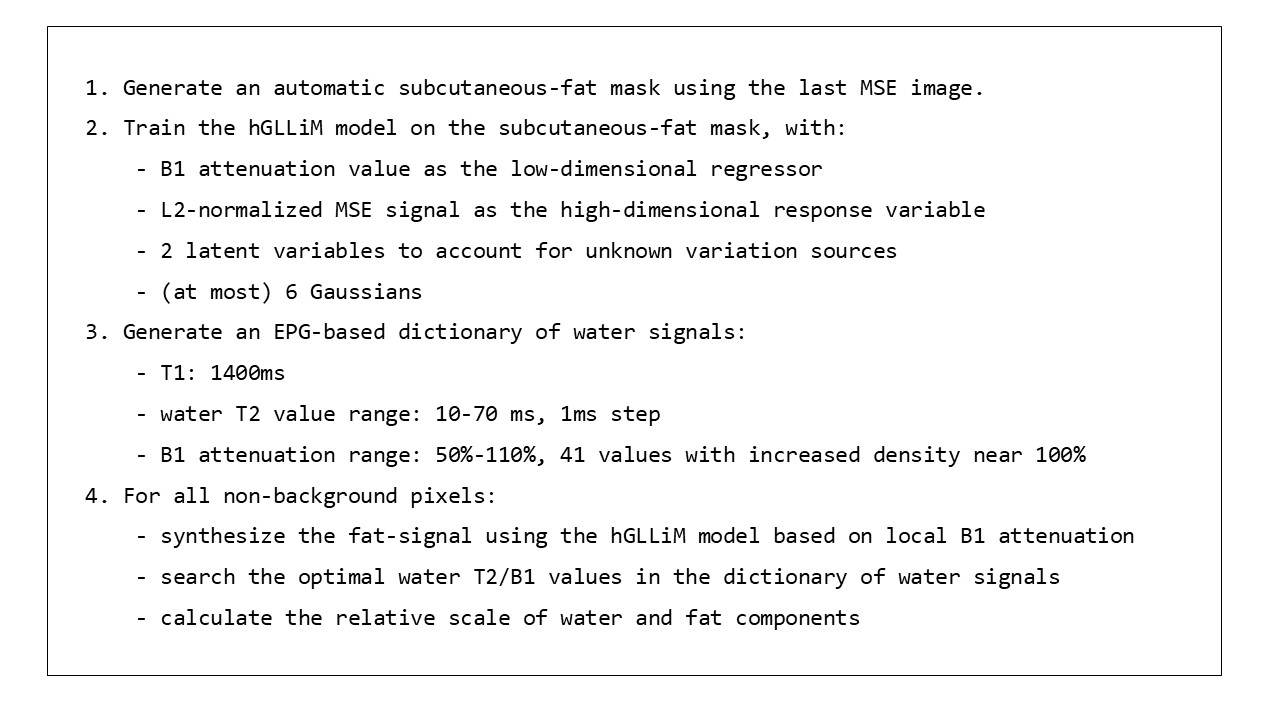
Hybrid method pipeline.
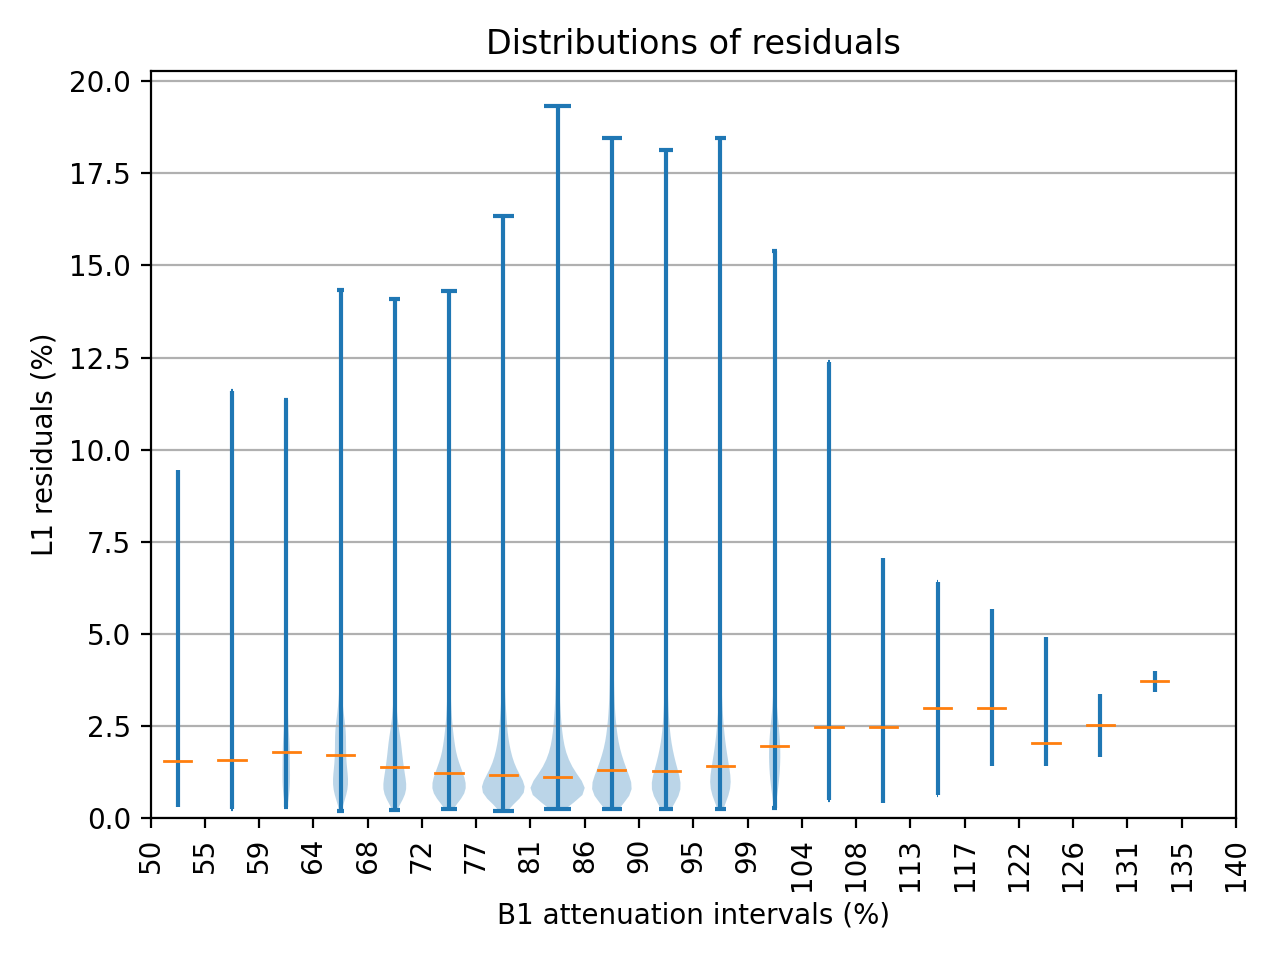
Estimated distributions of the residuals in the subcutaneous-fat mask of one IBM patient in 20 intervals across the B1-attenuation value range. The widths of the violins are proportional to the number of points in the interval. Orange horizontal lines indicate the medians.
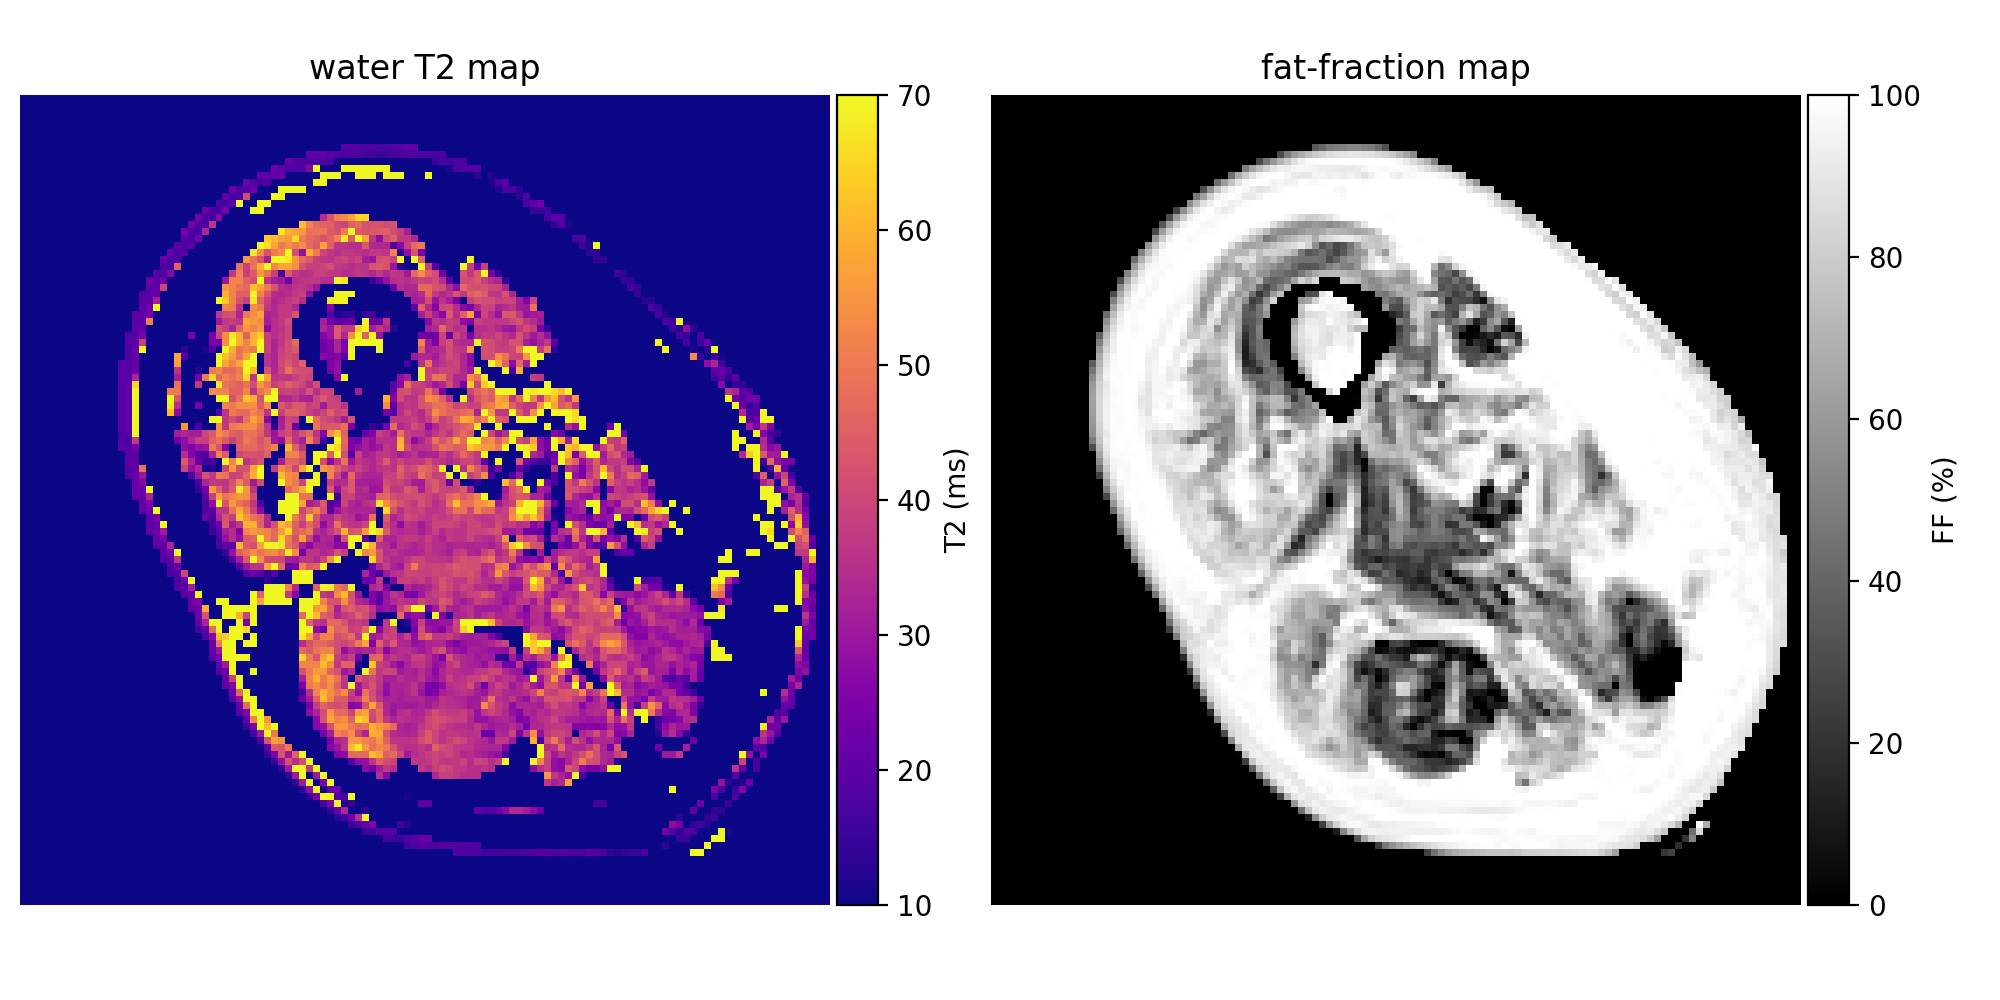
Middle slice of water T2 map (left) and fat-fraction map (right) produced by the proposed method in an IBM patient. Pixels with a FF>95% were masked in the water T2 map. FF is abnormal (>10%) and water T2 is elevated (> 40ms) in several muscles.
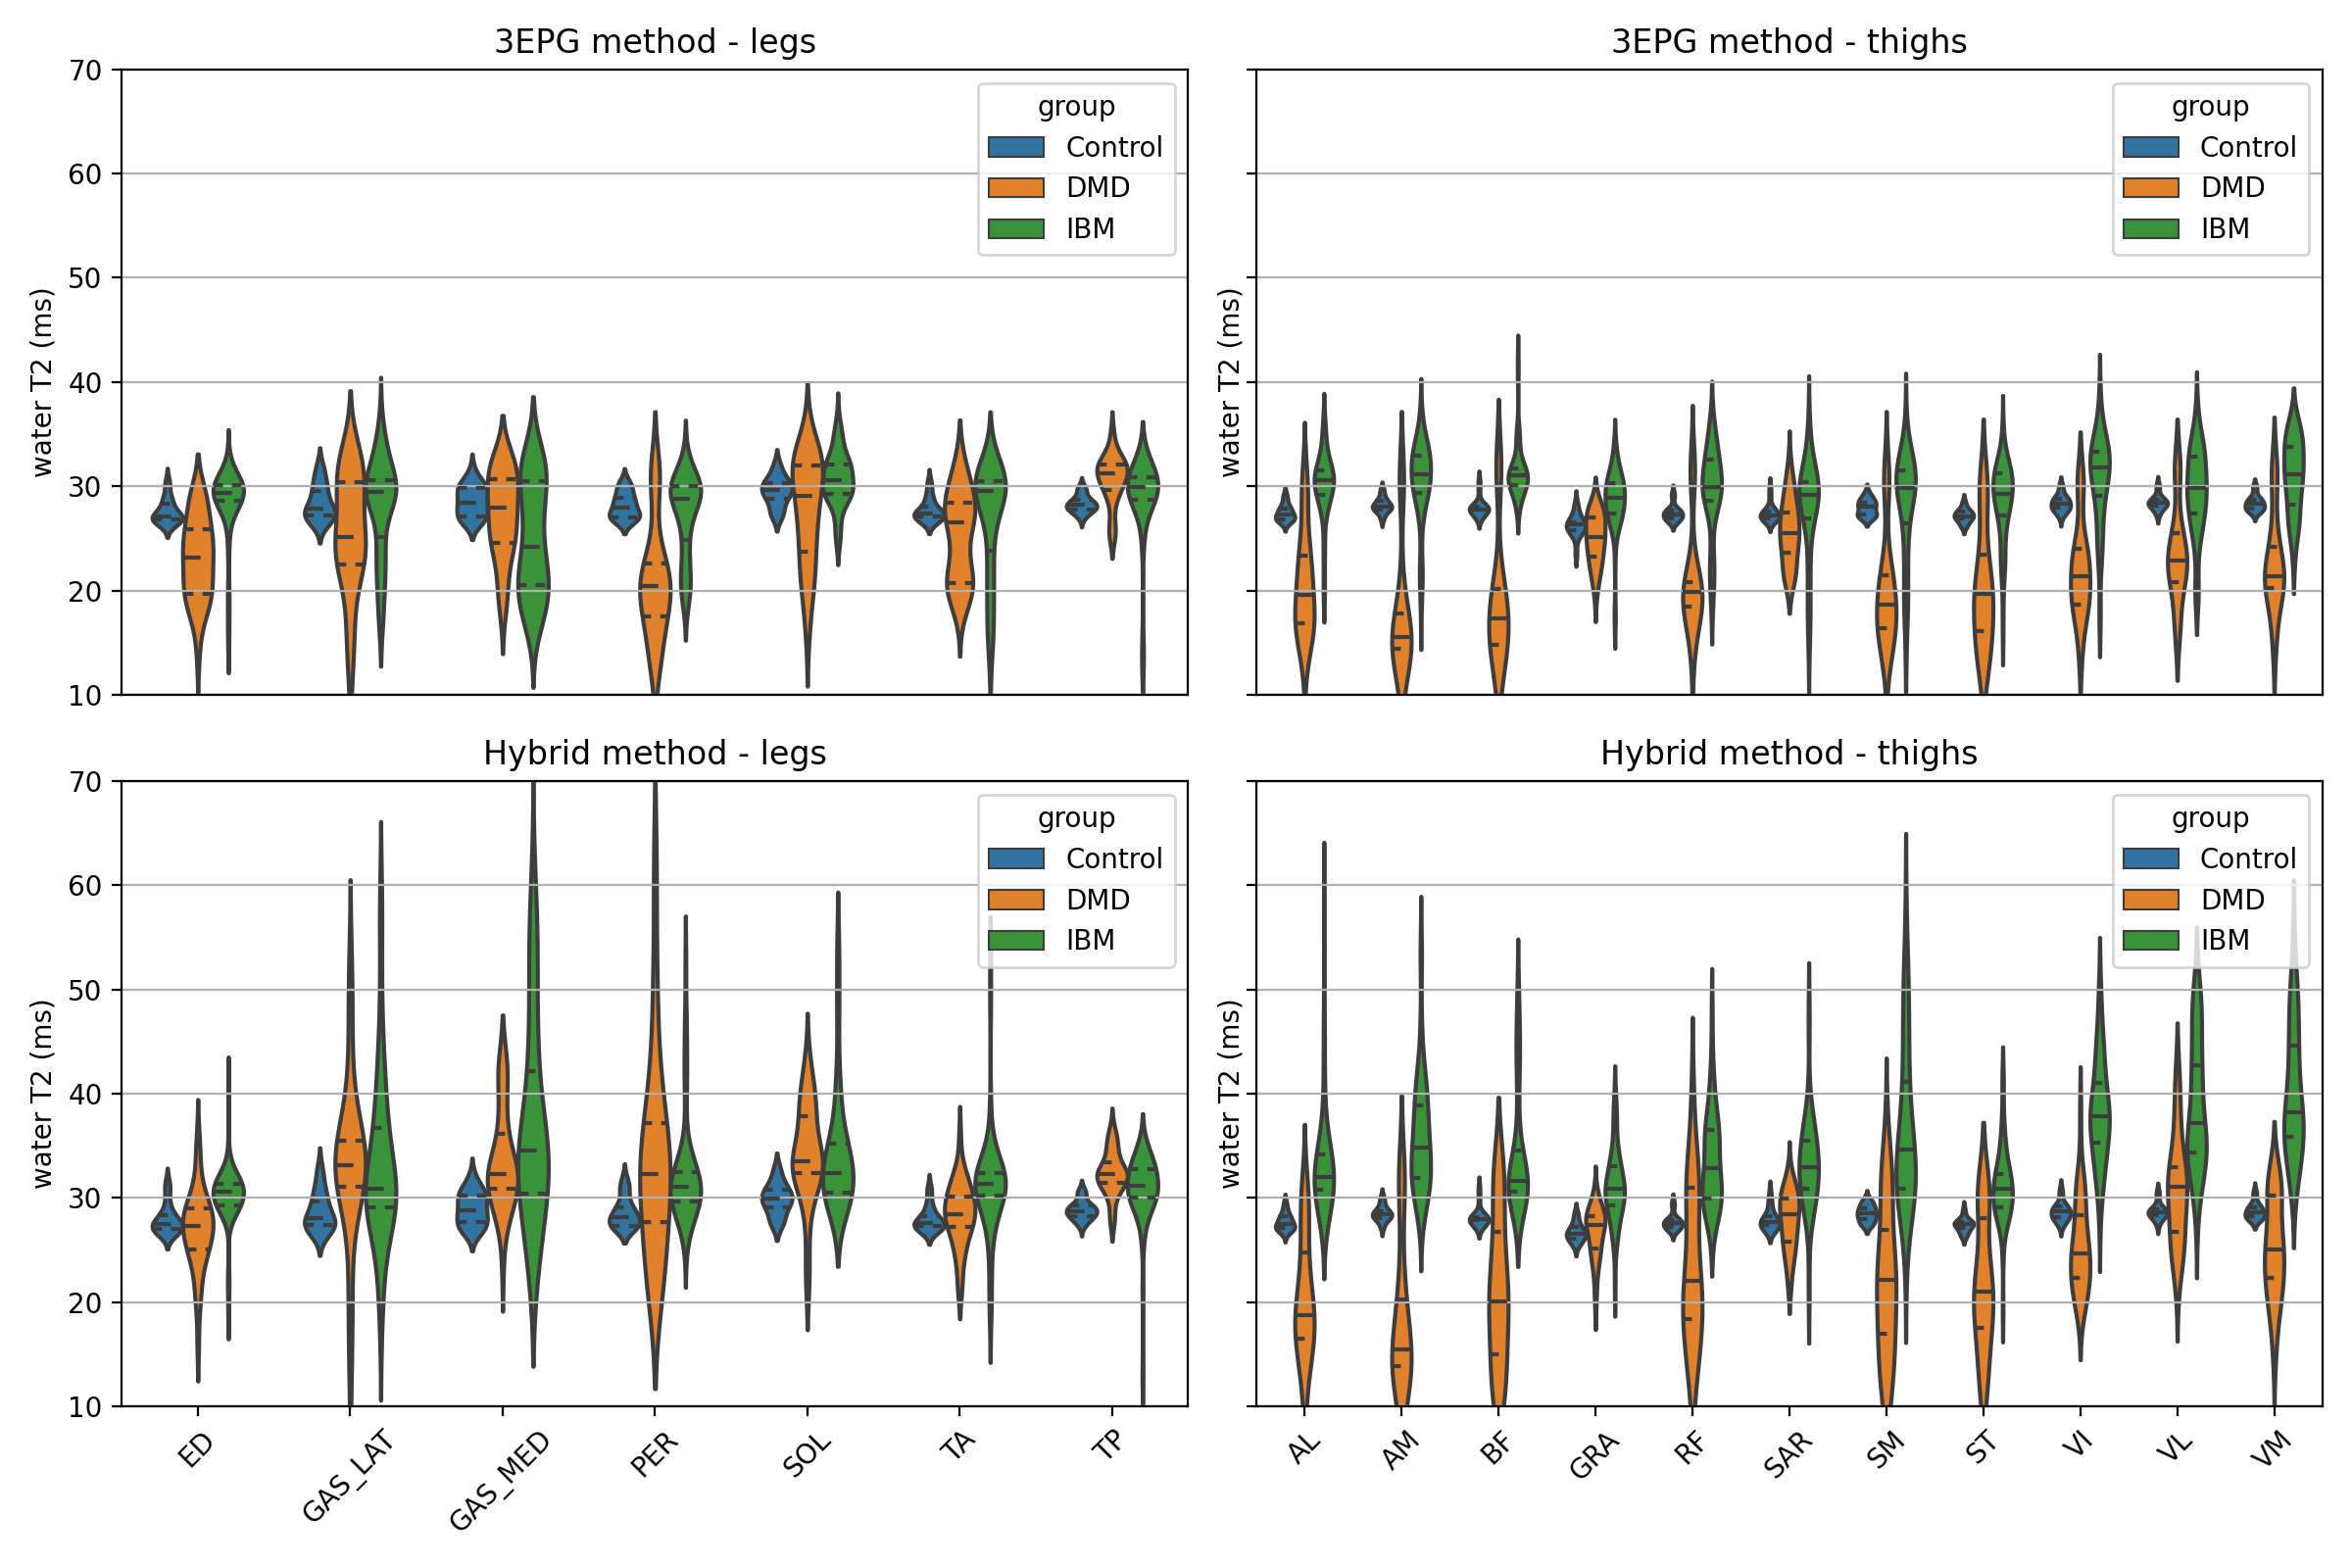
Estimated distribution of mean water T2 values by muscle region. Horizontal bars separate the quartiles of the distributions. ROI abbreviations: ED=Extensor Digitorum, GAS_LAT=Grastrocnemius Lateralis, GAS_MED=Gastrocnemius Medialis, PER=Peroneus, SOL=Soleus, TA=Tibialis Anterior, TP=Tibialis Posterior, AL=Adductor Longus, AM=Adductor Magnus, BF=Biceps Femoris, GRA=Gracilis, RF=Rectus Femoris, SAR=Sartorius, SM=Semimembranosus, ST=Semitendinosus, VI=Vastus Intermedius, VL=Vastus Lateralis, VM=Vastus Medialis.
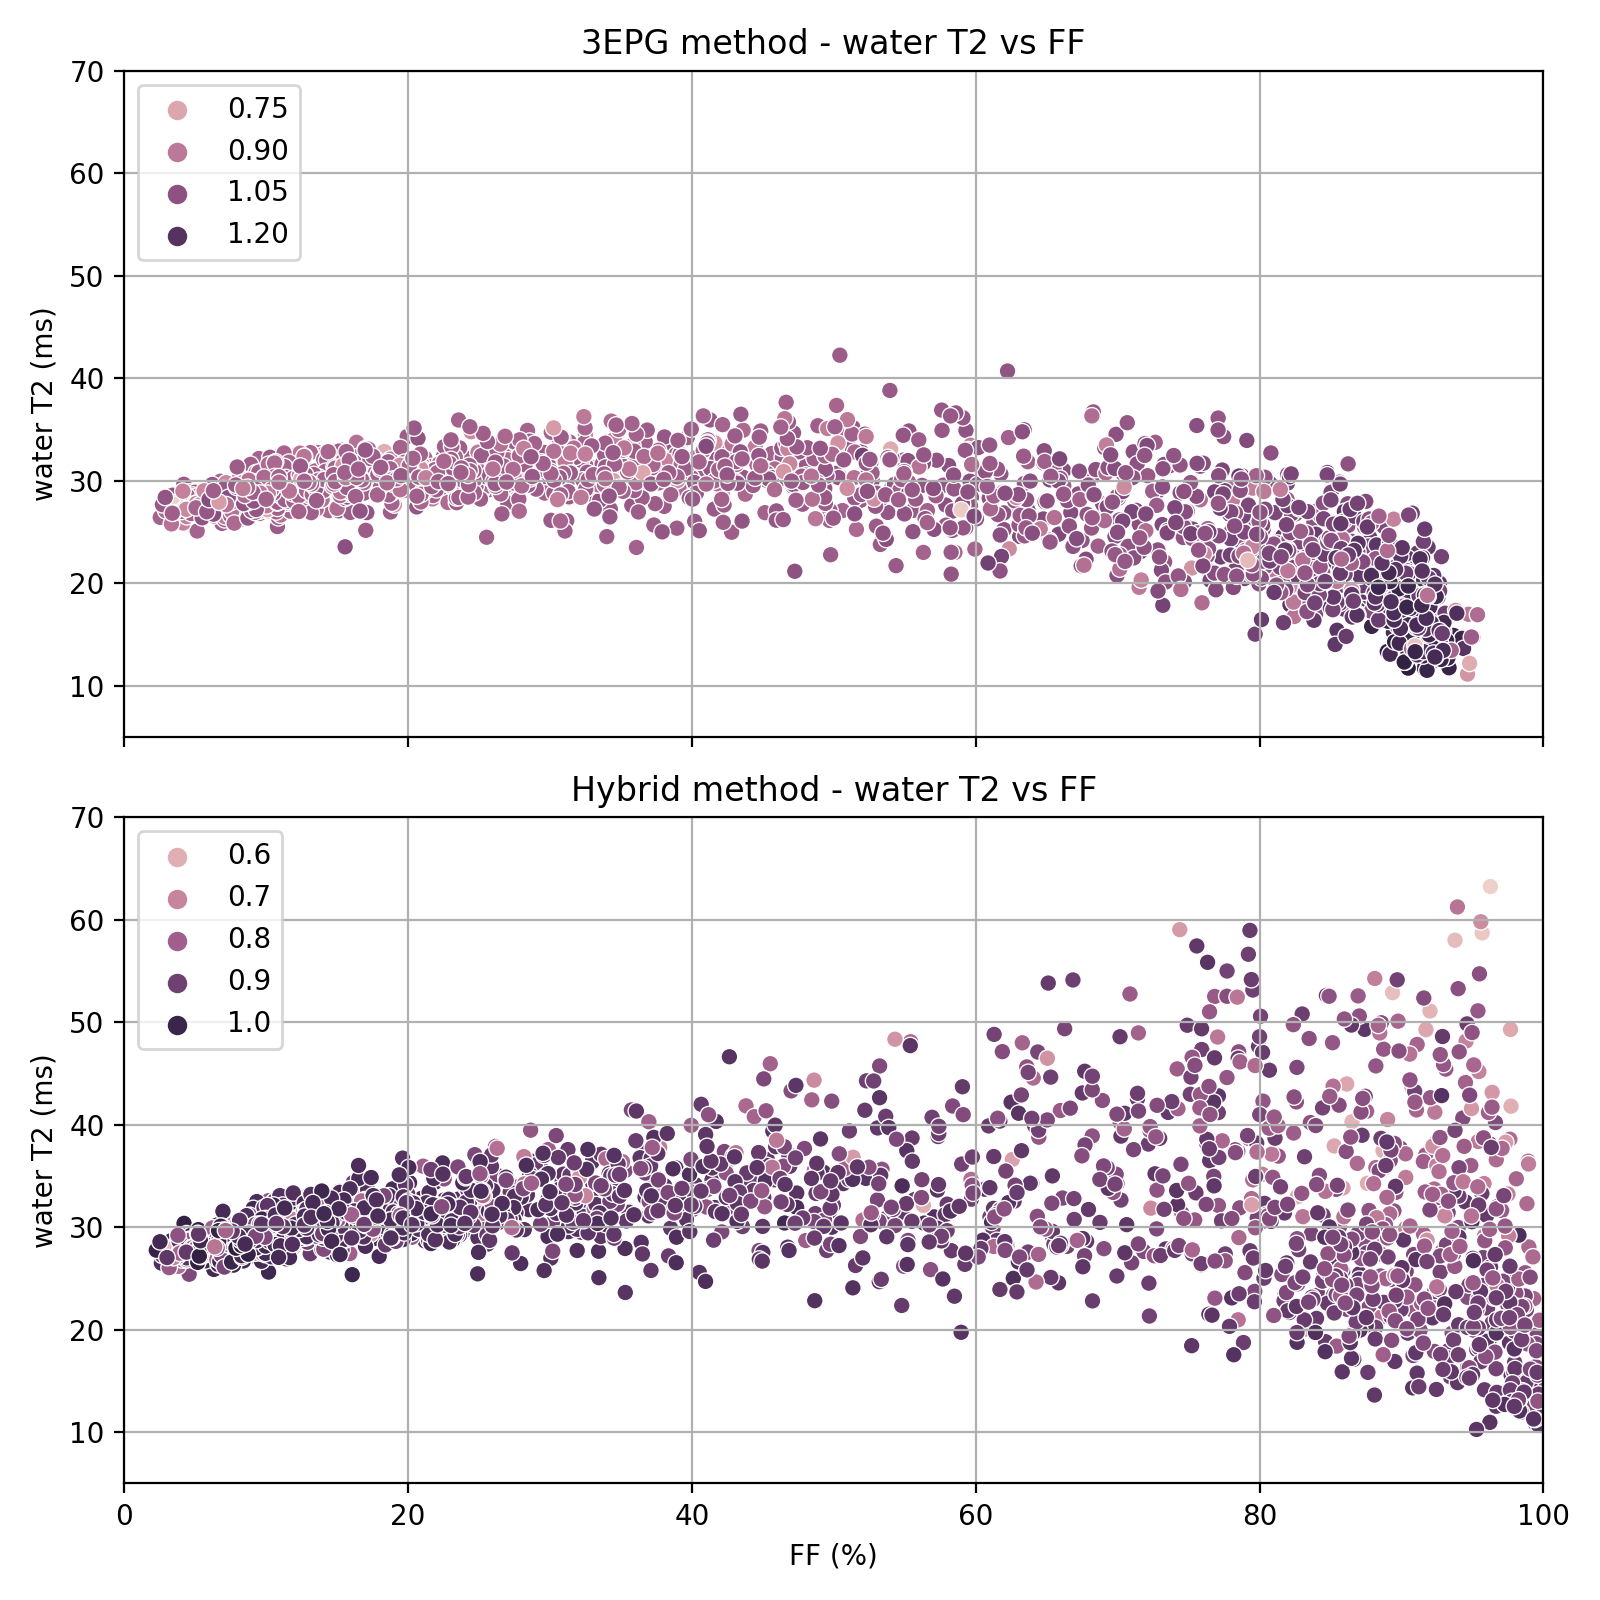
Estimated water T2 vs fat-fraction for all ROIs of all subjects, with marker brightness mapped to B1-attenuation.
DOI: https://doi.org/10.58530/2022/1343