1342
Validation of fast in vivo T1 and T2* mapping of tissues in the knee using 3D UTE1University clinic and policlinic for Radiology, University Hospital Halle (Saale), Halle (Saale), Germany
Synopsis
In this study we present a 3D high resolution method for fast in vivo T1 and T2* mapping of fast relaxating tissues of the knee. All experiments were performed using a prototypical 3D spoiled gradient echo ultrashort echo time sequence with stack of spirals readout. T1 and T2* values of the mapping technique were validated by reference methods and literature values and showed good agreement for fast T1 and T2* values. The mapping technique enables T1 and T2* quantitation of fast relaxating tissues in a clinically appropriate measurement time of 9 minutes with a submillimeter spatial resolution (0.8mmx0.8mmx0.8mm).
Introduction:
Conventionally, imaging of fast relaxating tissues such as tendons, ligaments or bone is limited by the minimal required echo time. Ultra-short echo-time (UTE) techniques enable quantitative imaging of such tissues and mapping of relaxation parameters1. Segmentation of different knee tissues based on the longitudinal (T1) and effective transverse relaxation times (T2*) within a total acquisition time (TA) of 22-63 minutes was shown recently2, using a triple echo based T2*mapping and either variable flip angle (VFA) or variable repetition time method for T1 mapping3. Building on these findings, we provide a fast approach for high-resolution T2* and T1 mapping by using a double echo UTE sequence2 for T2* mapping and a mixed approach relying on two flip angles (FA)4 and two repetition times (TR)5 for T1 mapping. We validate our UTE acquisition approach with multi-echo gradient-echo (MEGRE) imaging with variable flip angles in phantoms and in vivo. In addition, we explore the potential of the proposed UTE approach for segmentation of various tissues types of the non-pathological knee based on a bivariate histogram of T1 and T2* relaxation times.Methods:
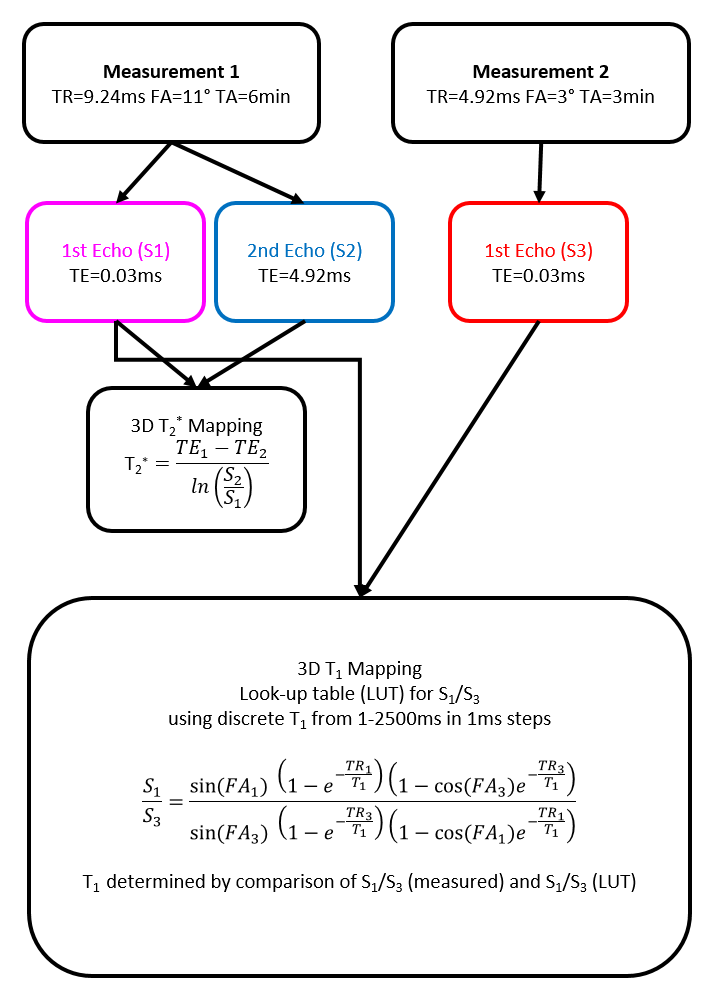
All measurements were performed on a 3T MR-scanner (MAGNETOM Skyra, Siemens Healthcare, Erlangen, Germany) using a 15-channel transmit/receive knee coil and a prototypical 3D spoiled gradient echo UTE sequence with stack of spirals readout. For fast T1 and T2* mapping, two measurements with an isotropic spatial resolution of 0.8 mm were conducted. The acquisition and processing scheme is summarized in figure 1. The T2* map was calculated based on two echoes obtained in measurement 1. A T1 look-up-table (LUT) was computed to allocate the ratio of two gradient echo signals (S1/S3) with identical TEs by using discrete 1ms T1 steps ranging from 1 to 2500 ms. T1 was obtained by applying the LUT to the ratio of the first echo of measurement 1 (S1) and measurement 2 (S3). Phantom construction: The proposed UTE-based T1 and T2* mapping was validated in phantom measurements. The first phantom consists of carrageenan gels doped with different Gadolinium (Gd) concentrations ([300/180/140/80/60/40/30/20/12/7/0]nM) to adjust variable T1 values. The second phantom comprised two chambers containing two different mixtures of water and cornstarch with varying T2* values. The reference T1 and T2* values in phantom solutions were obtained by measuring VFA with a single-echo gradient-echo approach (TR/TE=9.24ms/0.03ms, flip angles: 2°/3°/4°/5°/8°/11°/14°) and a MEGRE approach (TR=23.3ms; FA=12°; TE’s: [0.03/2.46/4.92/7.38/9.84/14.76]ms), respectively, using the same prototypical UTE sequence. Finally, the knee joints of two healthy volunteers were examined using the proposed UTE-based mapping procedure as well as using the VFA and MEGRE techniques employing the same parameter settings as in the phantom scans. Reference T1 and T2* values were obtained in all phantom solutions and in five different healthy knee tissues (bone skin, patella tendon, bone marrow, fat and muscle) by fitting corresponding signal evolutions in VFA and MEGRE series (VFA: FLASH equation; MEGRE: mono-exponential fit). The T1 and T2* maps obtained were converted into a bivariate histograms to identify tissue specific T1/ T2* clusters by using previous literature values3, which were used as thresholds to differentiate the various tissue types.Results:
Figure 2 shows T1 and T2* values, which were obtained in phantom solutions and selected knee tissues by using the reference approaches and proposed UTE mapping techniques. The plots also show literature values for the different knee tissues. The three acquired signals for fast in vivo mapping and the resulting T1 and T2* maps of the two volunteers are shown in figure 3. Finally, figure 4 illustrates subject specific bivariate histograms of the T1 and T2* maps and corresponding segmentation outcomes for the bone skin and patella tendon in shaded-surface display.Discussion:
In general, the proposed UTE mapping technique provides results comparable to the more accurate reference methods. However, phantom T1 values obtained with the LUT method appear to be systematically underestimated compared to the reference T1 values (fig. 2C), which might be ascribed to the uncertainly adjusted flip angles and has to be investigated in detail. The in vivo T1 values of fast relaxating tissues were comparable between LUT, reference method and literature values (fig. 2D). In contrast, the T1 values especially in muscle were underestimated. Being reliable for fast relaxating tissues (bone skin, tendon or bone marrow), the proposed T2* mapping technique is limited for the T2* quantitation of slow relaxating tissues (muscles, fat), whose signal attenuations are non-sufficient in the selected TE range. The pixel count peaks of bivariate histograms are in line with findings of Krämer et al.3, but showed minor variations between volunteers, mainly because of different volumes of subcutaneous adipose tissue. Finally, the 3D-visualization of bone marrow and the patellar tendons demonstrates the capability of the proposed techniques for reliable tissue segmentation and quantitative lesion characterization in bone or tendons.Conclusion:
The proposed UTE-based mapping technique enables T1 and T2* quantitation of fast relaxating tissues with submillimeter spatial resolution in a clinically appropriate acquisition time of 9 min. We intend to apply our approach to a larger cohort of patients, improve the segmentation of tendons, ligaments and bone skin, and validate the outcome with manual segmentations.Acknowledgements
The authors thank Siemens Healthcare for providing the prototypical 3D radial UTE sequence.
References
1. Wehrli FW. Magnetic resonance of calcified tissues. J Magn Reson. 2013;229:35-48. doi:10.1016/j.jmr.2012.12.011
2. Krämer M, Herzau B, Reichenbach JR. Segmentation and visualization of the human cranial bone by T2* approximation using ultra-short echo time (UTE) magnetic resonance imaging. Z Med Phys. 2020;30(1):51-59. doi:10.1016/j.zemedi.2019.06.003
3. Krämer M, Maggioni MB, Brisson NM, et al. T1 and T2⁎ mapping of the human quadriceps and patellar tendons using ultra-short echo-time (UTE) imaging and bivariate relaxation parameter-based volumetric visualization. Magn Reson Imaging. 2019;63(July):29-36. doi:10.1016/j.mri.2019.07.015
4. Schabel MC, Morrell GR. Uncertainty in T1 mapping using the variable flip angle method with two flip angles. Phys Med Biol. 2009;54(1). doi:10.1088/0031-9155/54/1/N01
5. El-Sharkawy AEM, Schar M, Ouwerkerk R, Weiss RG, Bottomley PA. Quantitative cardiac 31P spectroscopy at 3 Tesla using adiabatic pulses. Magn Reson Med. 2009;61(4):785-795. doi:10.1002/mrm.21867
6. Grosse U, Springer F, Hein T, et al. Influence of physical activity on T1 and T2∗ relaxation times of healthy Achilles tendons at 3T. J Magn Reson Imaging. 2015;41(1):193-201. doi:10.1002/jmri.24525
7. Zuo CS, Sung YH, Simonson DC, et al. Reduced T2* Values in Soleus Muscle of Patients with Type 2 Diabetes Mellitus. PLoS One. 2012;7(11):7-12. doi:10.1371/journal.pone.0049337
8. Ma YJ, Zhao W, Wan L, et al. Whole knee joint T1 values measured in vivo at 3T by combined 3D ultrashort echo time cones actual flip angle and variable flip angle methods. Magn Reson Med. 2019;81(3):1634-1644. doi:10.1002/mrm.27510
9. Marty B, Carlier PG. Physiological and pathological skeletal muscle T1 changes quantified using a fast inversion-recovery radial NMR imaging sequence. Sci Rep. 2019;9(1):1-9. doi:10.1038/s41598-019-43398-x
Figures
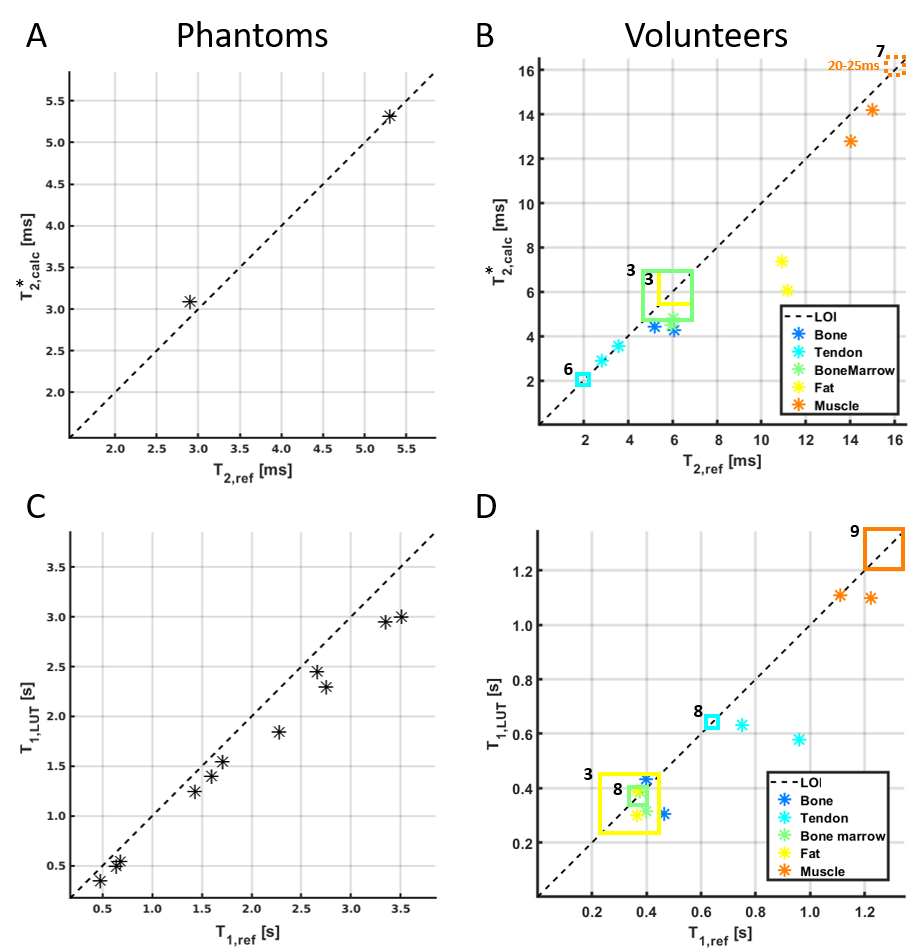
Comparison of the proposed and reference methods for measuring T2* in mixtures of water and cornstarch (A) and in five, manually segmented knee tissues in two volunteers (B) and T1 in Gadolinium containing carrageenan gels (C) and in vivo (D). The black dashed line illustrates the line of identity (LOI) between the proposed and reference methods. The squares indicate in vivo literature values of T1 and T2* relaxation times (references in superscript).
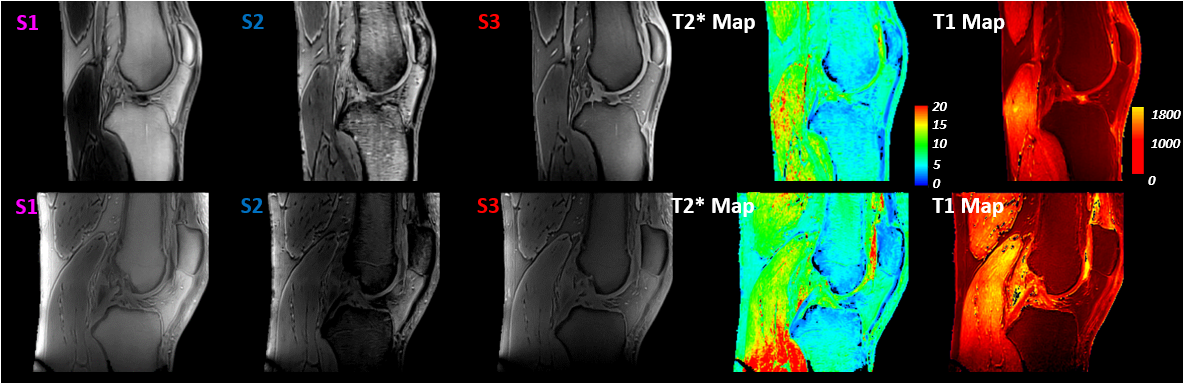
All images of the two volunteers derived with the proposed UTE-mapping approach. S1 (short TE) and S2 (long TE) obtained from the first measurement and S3 (short TE, short TR and small FA) obtained from the second measurement were used to generate the T2* map (S1 and S2) and the T1 map (S1 and S3).
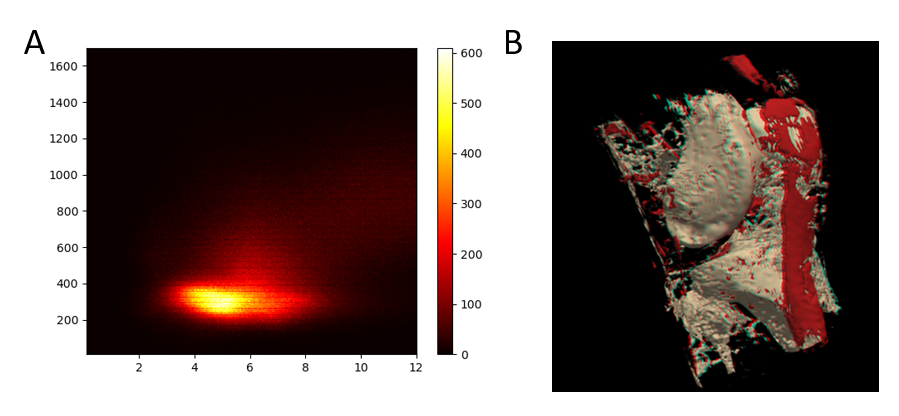
Bivariate histogram (A) and the 3D shaded-surface display (B) of the segmented bone marrow and tendons of a volunteer.