1341
Feasibility of map recalibration using an in-scan reference system for two MRI mapping cardiac sequences1Department of Physics, University of Pavia, Pavia, Italy, 2Department of Medical Physics, ASST Grande Ospedale Metropolitano Niguarda, Milan, Italy, 3Department of Cardiology, ASST Grande Ospedale Metropolitano Niguarda, Milan, Italy, 4Department of Physics, University of Milan, Milan, Italy
Synopsis
In this work we tested the feasibility of MRI relaxation time maps recalibration by employing an in-scan reference system. This ‘belt phantom’ was characterized through NMR standard spectroscopic technique. Scan-dependent recalibrations of the relaxation time maps could be performed relying on the ground-truth NMR values of the phantom, aiming to clinical intra- and inter-center harmonization. The in-scan reference phantom allowed also, together with the analysis of the standard deviation maps (measured as the 68% confidence bound of the fitted relaxation time value), to evaluate the reliability of the maps and the applicability of the recalibration.
Introduction
MRI relaxation time maps provide both qualitative and quantitative information that can be employed in clinical practice for the correlation and monitoring of disease progression from tissue and morphological changes.1-5 Intra- and inter-centric harmonization still represents an open issue well known in the literature6-11: accuracy and precision are fundamental factors to be considered for clinical applications.12,13In this study, we test the feasibility of map recalibration for two different relaxation time mapping sequences developed for cardiac applications by using an in-scan reference phantom, with a similar approach to one used in the early ages of CT applications.14,15
Methods
The MRI reference phantom is composed of twelve 30 ml vials filled with different concentrations of MnCl2 (Sigma-Aldrich Co., St. Louis, MO, USA) in aqueous solutions,16 which T1 and T2 ground-truth values at 1.5 T have been measured through Nuclear Magneti Resonance (NMR) spectroscopic techniques with an NMR spectrometer (Tecmag Apollo spectrometer, Houston, TX, USA; Bruker electromagnet, Billerica, MA, USA).16We acquired MOLLI17 (MOdified Look-Locker Inversion recovery) and T2-prep TrueFISP18 (Fast Imaging with Steady Precession) maps with a Siemens Aera MRI scanner (1.5 T, Siemens Healthineers, Erlangen, Germany) of an Eurospin phantom (Diagnostic Sonar Ltd, Livingston, Scotland), which played the role of the patient. The MnCl2 ‘belt’ phantom was wrapped around the Eurospin phantom as illustrated in Fig. 1. A wide range of heart-rates (30-150 bpm) has been simulated during the acquisitions. We also acquired reference T1 and T2 maps using standard Inversion Recovery (IR) and Spin-Echo (SE) turbo-sequences. The acquisitions were performed at the same room temperature of 22.5°C, monitored by means of an optical fiber sensor TempSense (Opsense Inc., Quebec, Canada).
A custom Matlab script, named ‘swSD’, was used for the calculation and analysis of both relaxation time and SD (Standard Deviation, measured as the 68% confidence bound of the fitted relaxation time value) maps.
Results
Considering the belt phantom (Fig. 2), a significant discrepancy (p-values < 0.1) was found for MOLLI (underestimation, for [MnCl2] > 0.2 mM) and T2-prep TrueFISP (overestimation, for [MnCl2] > 0.1 mM) values from NMR reference ones (null hypothesis: NMR values = parametric maps values).The dependences of the relaxation times and of their errors calculated with the swSD software from the simulated heart-rate are shown in Fig. 3 and 4 for the belt phantom and the Eurospin phantom respectively.
Finally, we tested the feasibility of the recalibration of relaxation time maps obtained from cardiac mapping sequences and acquired with a simulated heart-rate of 60 bpm (Fig. 5). Thanks to the linearity of belt phantom MOLLI results (R2 = 0.997) we were able to simply apply a multiplication factor to the MOLLI map (i.e. the ratio between MOLLI T1s and NMR IR ground truth reference ones). Due to the non-linearity of belt phantom T2-prep TrueFISP results, we fitted the ratios between T2-prep TrueFISP T2s and NMR CPMG ground truth reference ones with a quadratic function (bijective in the analyzed range of relaxation times).
Discussion
As can be seen in Figs. 3 and 4, MOLLI results are slightly dependent on the simulated heart-rate while T2-prep TrueFISP results are more sensitive to the heart-rate variation (in the Eurospin case, the curves overlap). It is also important to underline that the errors reported in Fig. 3 and 4, i.e. the errors derived from the fitting procedure and highlighted with the swSD software analysis, are systematically greater than the errors measured with the usual method (i.e. standard deviation of values within an ROI on the relaxation time map).All the recalibrated MOLLI values agreed with NMR reference values (p-values < 0.1). The effect of the map recalibration on Eurospin’s relaxation times can be seen in the Bland-Altman plot in Fig. 5.B: the distribution of recalibrated values (in red) is more centered at 0% discrepancy with respect to the non-recalibrated distribution (in black), hence resulting in a more accurate estimation of the Eurospin’s relaxation times without affecting severely the precision (∼ ±10%). The recalibration of the T2 map from T2-prep TrueFISP sequence acquisition did not provide the same good results as for the case of MOLLI T1 map.
In fact, even if the expected behavior of relaxation rates as a function of MnCl2 concentration for the belt phantom values were restored correctly (Fig. 5.C, p-values of two-sample t-tests lower than 0.1), Eurospin’s values, already underestimated (see the black distribution in Fig. 5.D), after the recalibration present a more severe underestimation (see the red distribution in Fig. 5.D). Moreover, one should notice the severe increment of the errors caused by the error propagation for having used a quadratic function for the recalibration.
Further investigations on the effect of the different nature of the samples (aqueous solutions vs gels), probably resulting in a different sensitiveness to this particular sequence must be performed.
Conclusion
The method relying on an in-scan reference phantom provides a robust methodology for the evaluation of mapping sequences performances (accuracy and precision) and, hence, their reliability. The recalibration of the maps based on the in-scan reference phantom, where appliable and if properly performed, can pave the way towards data harmonization and optimization, an open issue of this field.Acknowledgements
No acknowledgement found.References
- Cheng H-LM, Stikov N, Ghugre NR, Wright GA. Practical medical applications of quantitative MR relaxometry. J Magn Reson Imaging 2012;36:805-824.
- Salerno M, Kramer CM. Advances in parametric mapping with CMR imaging. JACC: Cardiovascular Imaging 2013;6(7):806-822.
- Kim PK, Hong YJ, Im DJ, et al. Myocardial T1 and T2 mapping: techniques and clinical applications. Korean J Radiol 2017;18(1):113-131.
- Wolf M et al. Magnetic resonance imaging T1-and T2-mapping to assess renal structure and function: a systematic review and statement paper. Nephrology Dialysis Transplantation 2018;33(2):ii41-ii50.
- Luetkens JA. et al. Quantification of liver fibrosis at T1 and T2 mapping with extracellular volume fraction MRI: preclinical results. Radiology 2018;288(3):748-754.
- Raman FS, Kawel-Boehm N, Gai N, et al. Modified look-locker inversion recovery T1 mapping indices: assessment of accuracy and reproducibility between magnetic resonance scanners. J Cardiovasc Magn Reson 2013;15:64.
- Roujol S, Weingärtner S, Foppa M, et al. Accuracy, precision, and reproducibility of four T1 mapping sequences: a head-to-head comparison of MOLLI, ShMOLLI, SASHA, and SAPPHIRE. Radiology 2014;272(3):683-689.
- Baeßler B, Schaarschmidt F, Stehning C, Schnackenburg B, Maintz D, Bunck AC. A systematic evaluation of three different cardiac T2-mapping sequences at 1.5 and 3T in healthy volunteers. Europ J Radiol 2015;84:2161-2170.
- Baeßler B et al. Reproducibility of three different cardiac T2‐mapping sequences at 1.5 T. J Magn Reson Imaging 2016;44(5):1168-1178.
- Shao J et al. Accuracy, precision, and reproducibility of myocardial T1 mapping: A comparison of four T1 estimation algorithms for modified look‐locker inversion recovery (MOLLI). Magn Reson Med 2017;78(5):1746-1756.
- Graham-Brown MPM et al. Native T1 mapping: inter-study, inter-observer and inter-center reproducibility in hemodialysis patients. J Cardiovasc Magn Reson 2017;19(1):1-10.
- Kellman P, MS Hansen. T1-mapping in the heart: accuracy and precision. J Cardiovasc Magn Reason 2014;16(1):2.
- Bano W et al. On the accuracy and precision of cardiac magnetic resonance T2 mapping: A high‐resolution radial study using adiabatic T2 preparation at 3 T. Magn Reson Med 2017;77(1):159-169.
- Cann CE, HK Genant. Precise measurement of vertebral mineral content using computed tomography. J Comp Assist Tomogr 1980;4(4):493-500.
- Kalender WA, C Suess. A new calibration phantom for quantitative computed tomography. Med Phys 1987;14(5):863-866.
- Thangavel K, Saritaş EU. Aqueous paramagnetic solutions for MRI phantoms at 3 T: A detailed study on Relaxivities. Turk J Elec Eng & Comp Sci 2017;25:2108-2121.
- Messroghli DR et al. Myocardial T1 mapping: application to patients with acute and chronic myocardial infarction. Magn Reson Med 2007;58(1):34-40.
- Huang T-Y et al. T2 measurement of the human myocardium using a T2‐prepared transient‐state TrueFISP sequence. Magn Reson Med 2007;57(5):960-966.
- Solomon I. Relaxation process in a system of two spins. Phys Rev 1955;99(2):559-566.
- Bloembergen N, Morgan LO. Proton relaxation times in paramagnetic solutions. Effects of electron spin relaxation. J Chem Phys 1961;34(3):842-850.
- Altman D, Bland J. Measurement in Medicine: The Analysis of Method Comparison Studies. J R Stat Soc, Ser D Stat 1983;32(3):307-317.
- Giavarina D. Understanding Bland Altman analysis. Biochem Med 2015;25(2):141-151.
Figures

Figure 1 Acquisition set-up: the belt phantom, arranged in a thermal-insulating cover, was wrapped around the Eurospin phantom.
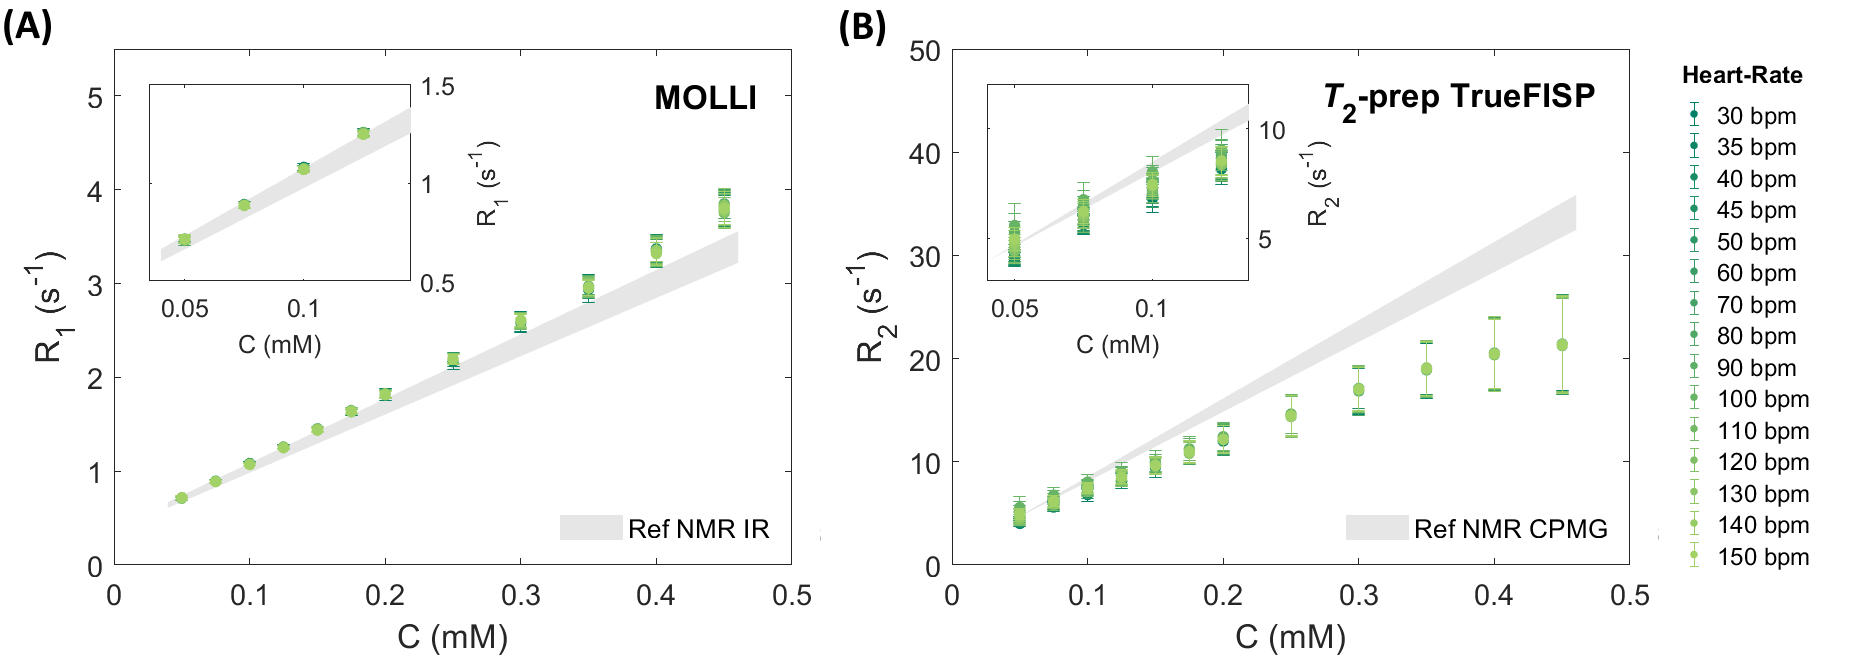
Figure 2 MRI results vs NMR reference values for MOLLI and T2-prep TrueFISP sequences acquisitions obtained with the MRI scanner: for each MOLLI data-set the coefficients of determination R2 are indicated assuming a linear regression model as predicted by the Solomon-Bloembergen-Morgan theory.19,20
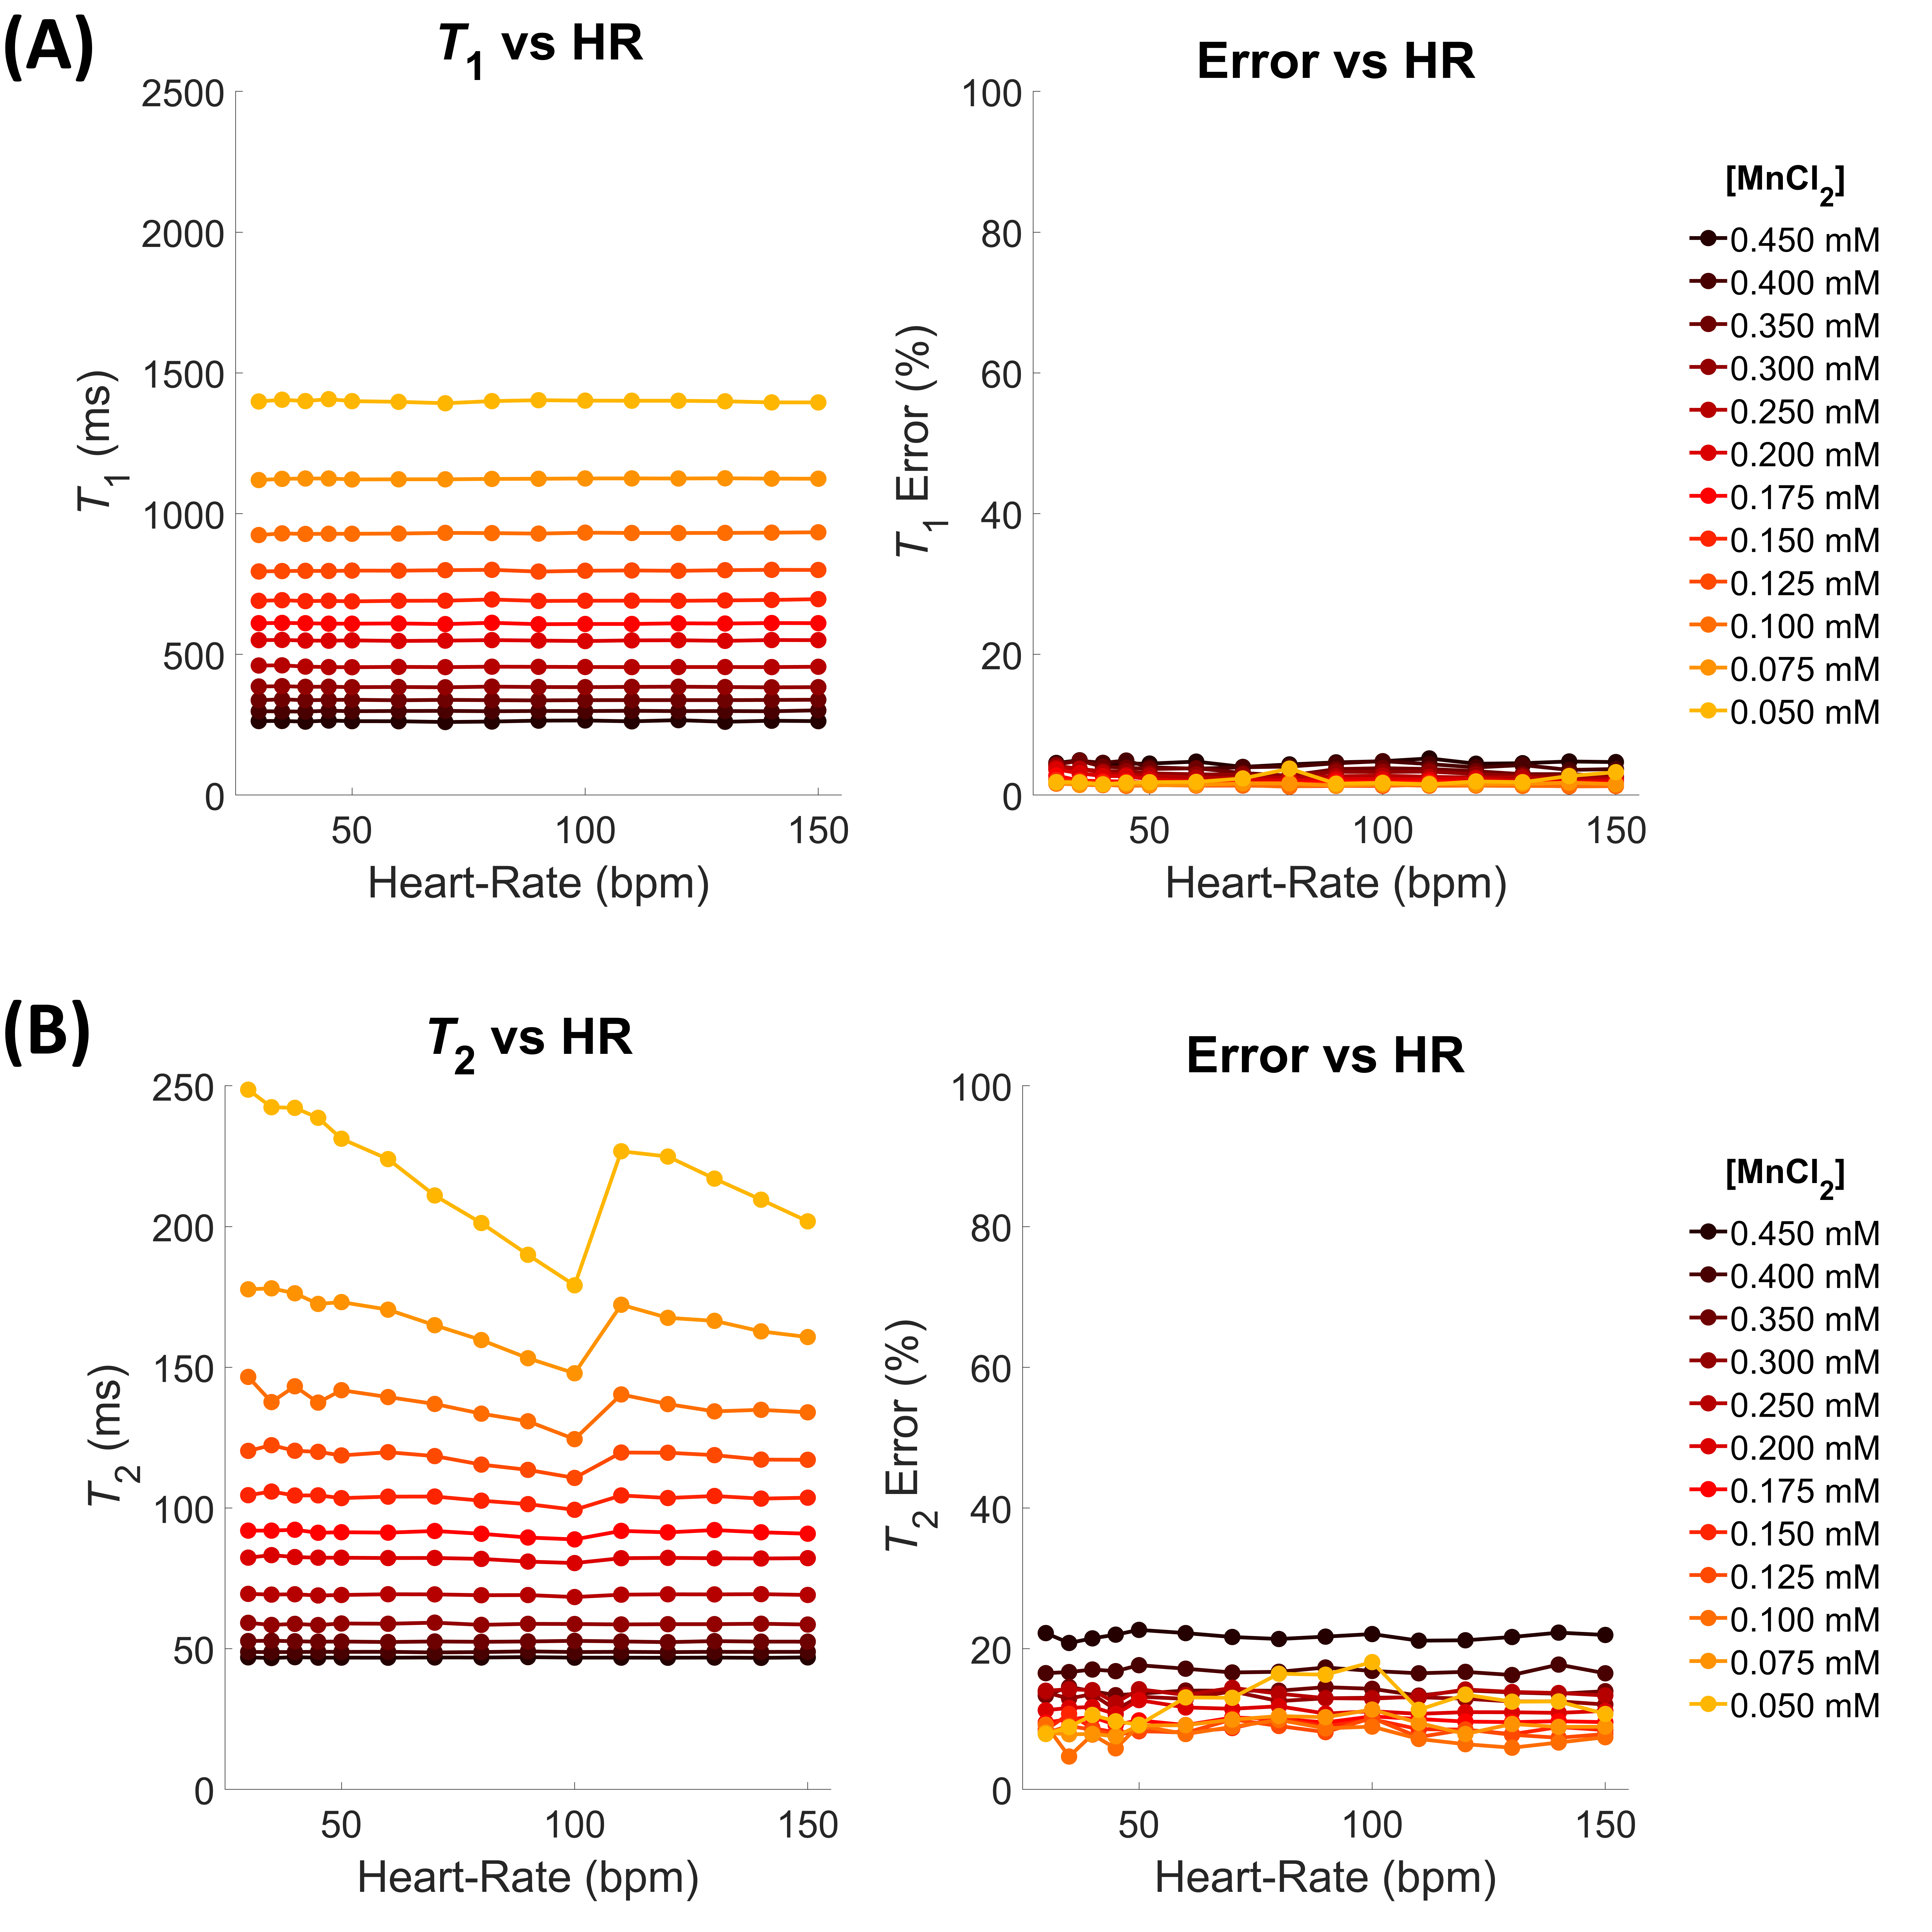
Figure 3 Belt phantom: Dependence from the simulated heart-rates (bpm), for each concentration, of the relaxation times T1 and T2 (left) and relative percentage errors (right) measured on, respectively, MOLLI (A) and T2-prep TrueFISP (B) maps obtained through the swSD software.
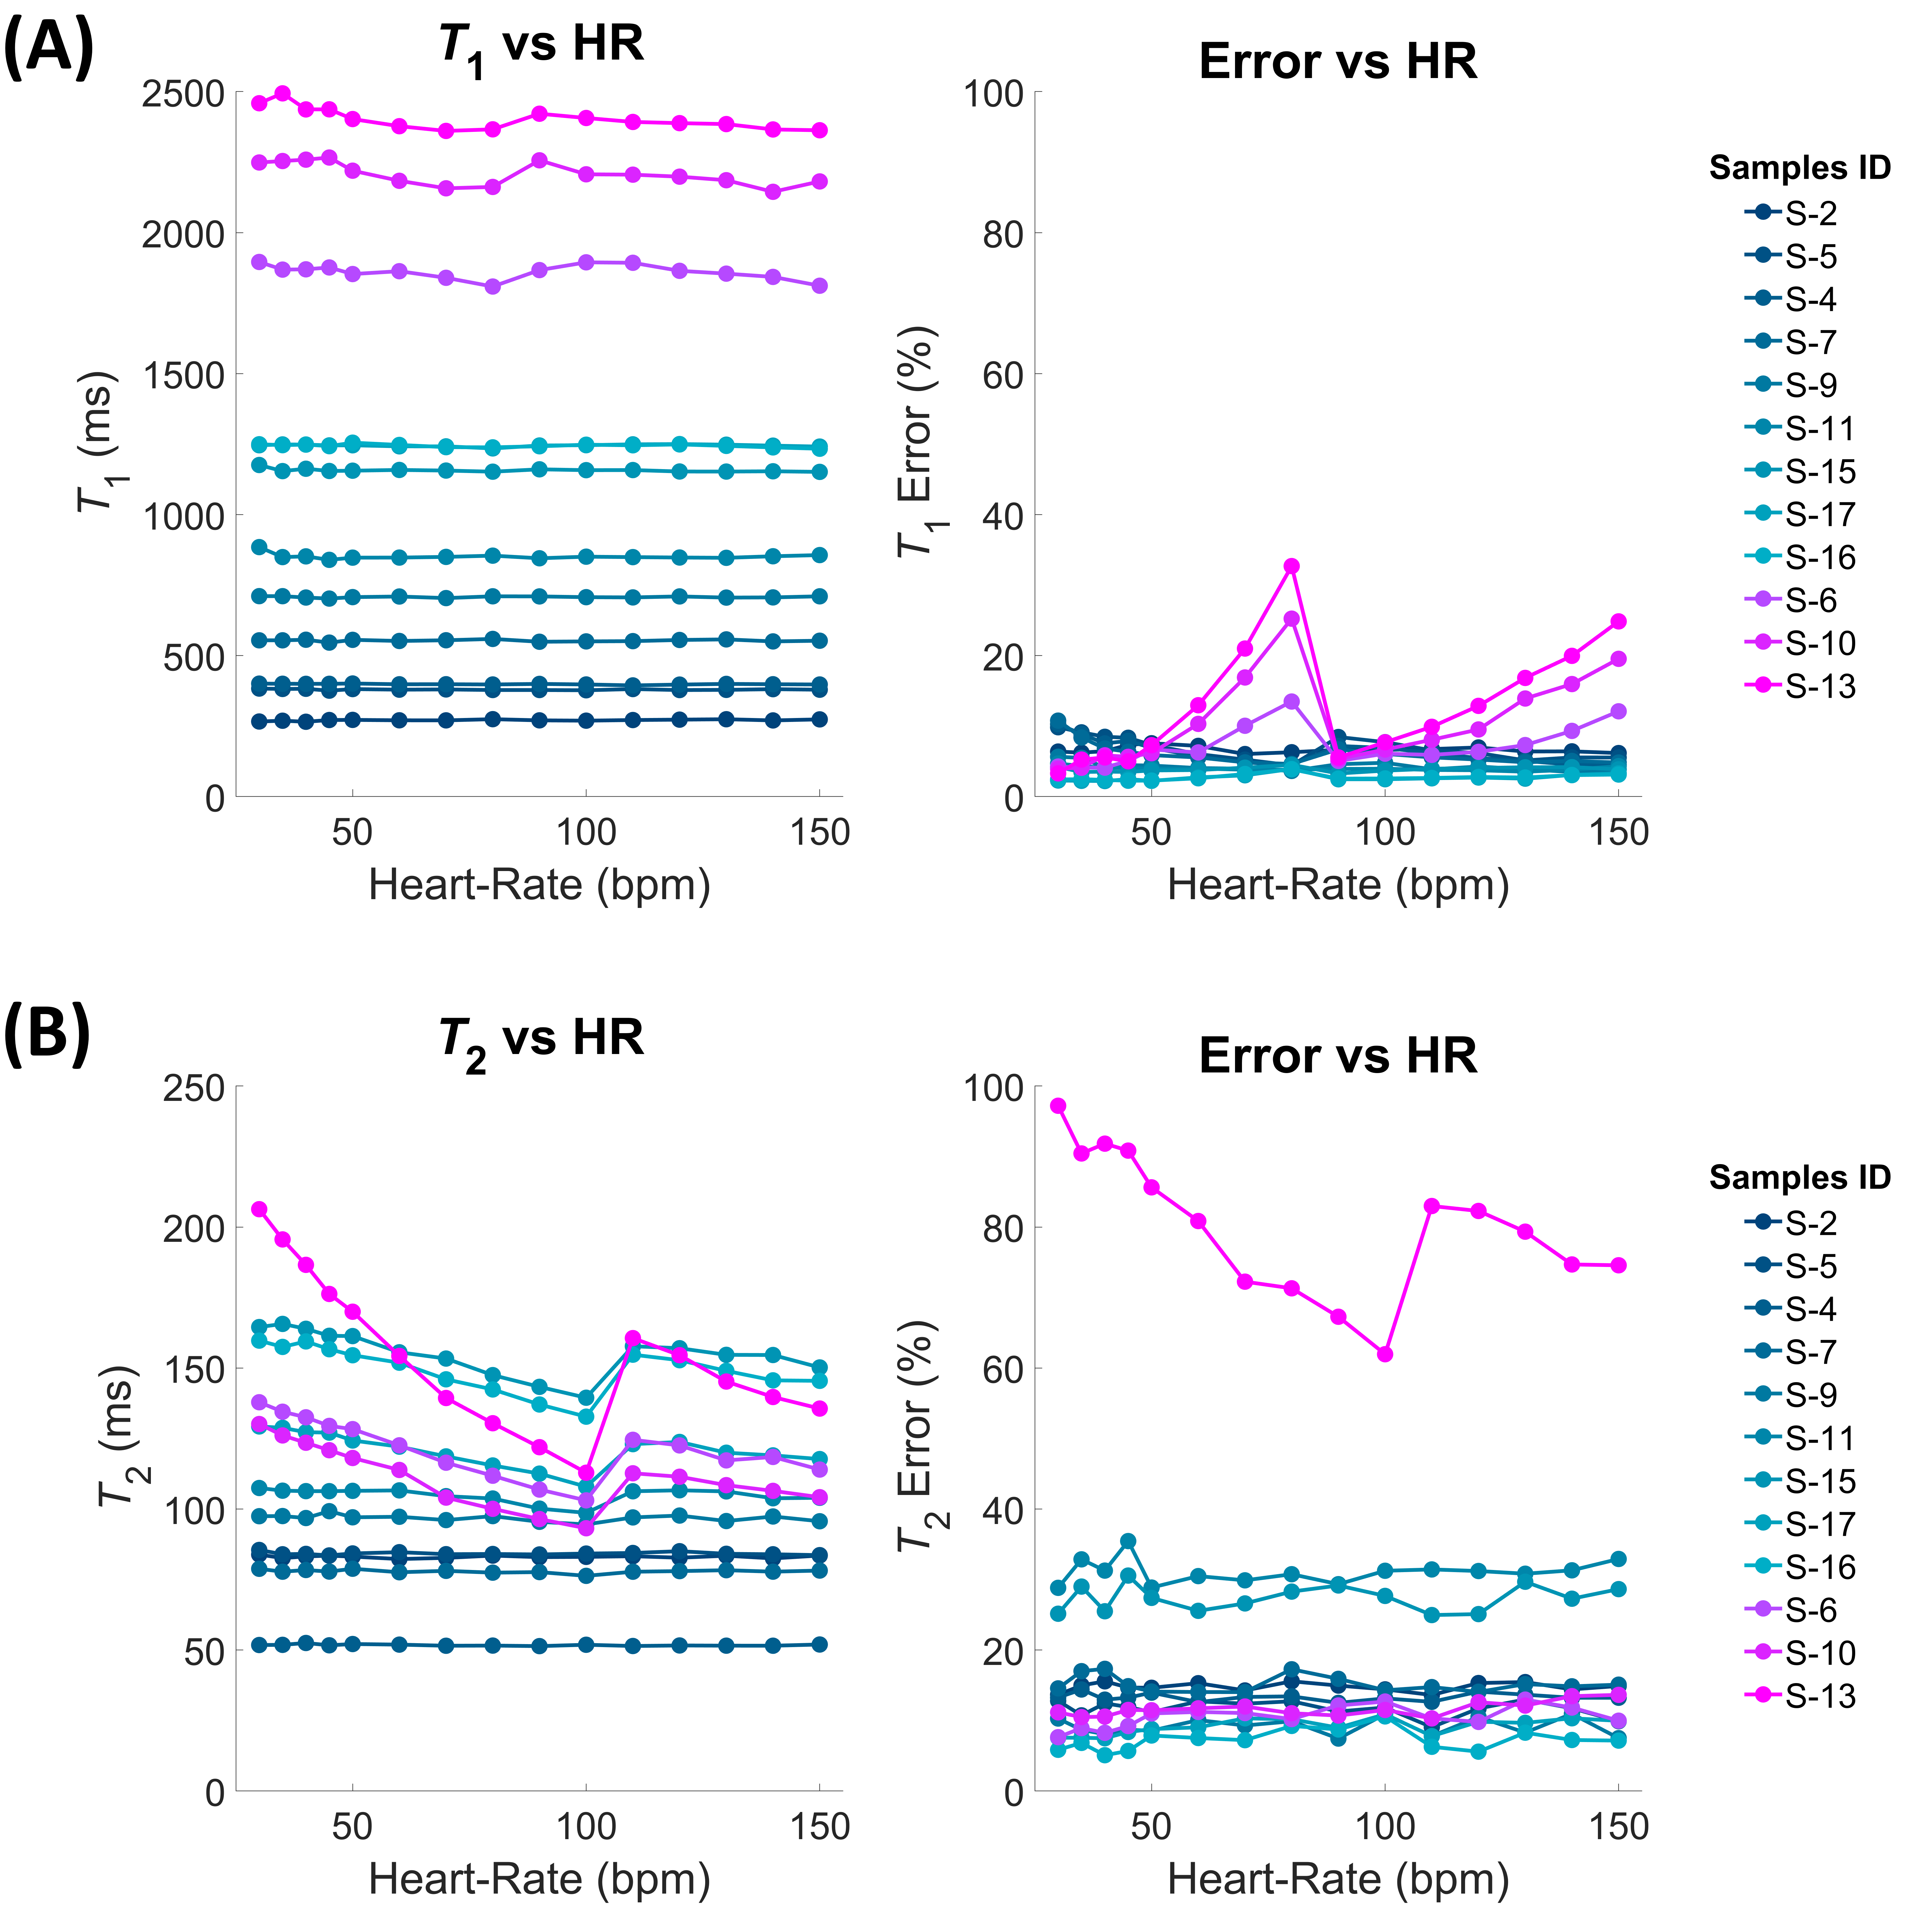
Figure 4 Eurospin phantom: Dependence from the simulated heart-rates (bpm), for each concentration, of the measured relaxation times T1 and T2 (left) and relative percentage errors (right) measured on, respectively, MOLLI (A) and T2-prep TrueFISP (B) maps obtained through the swSD software.
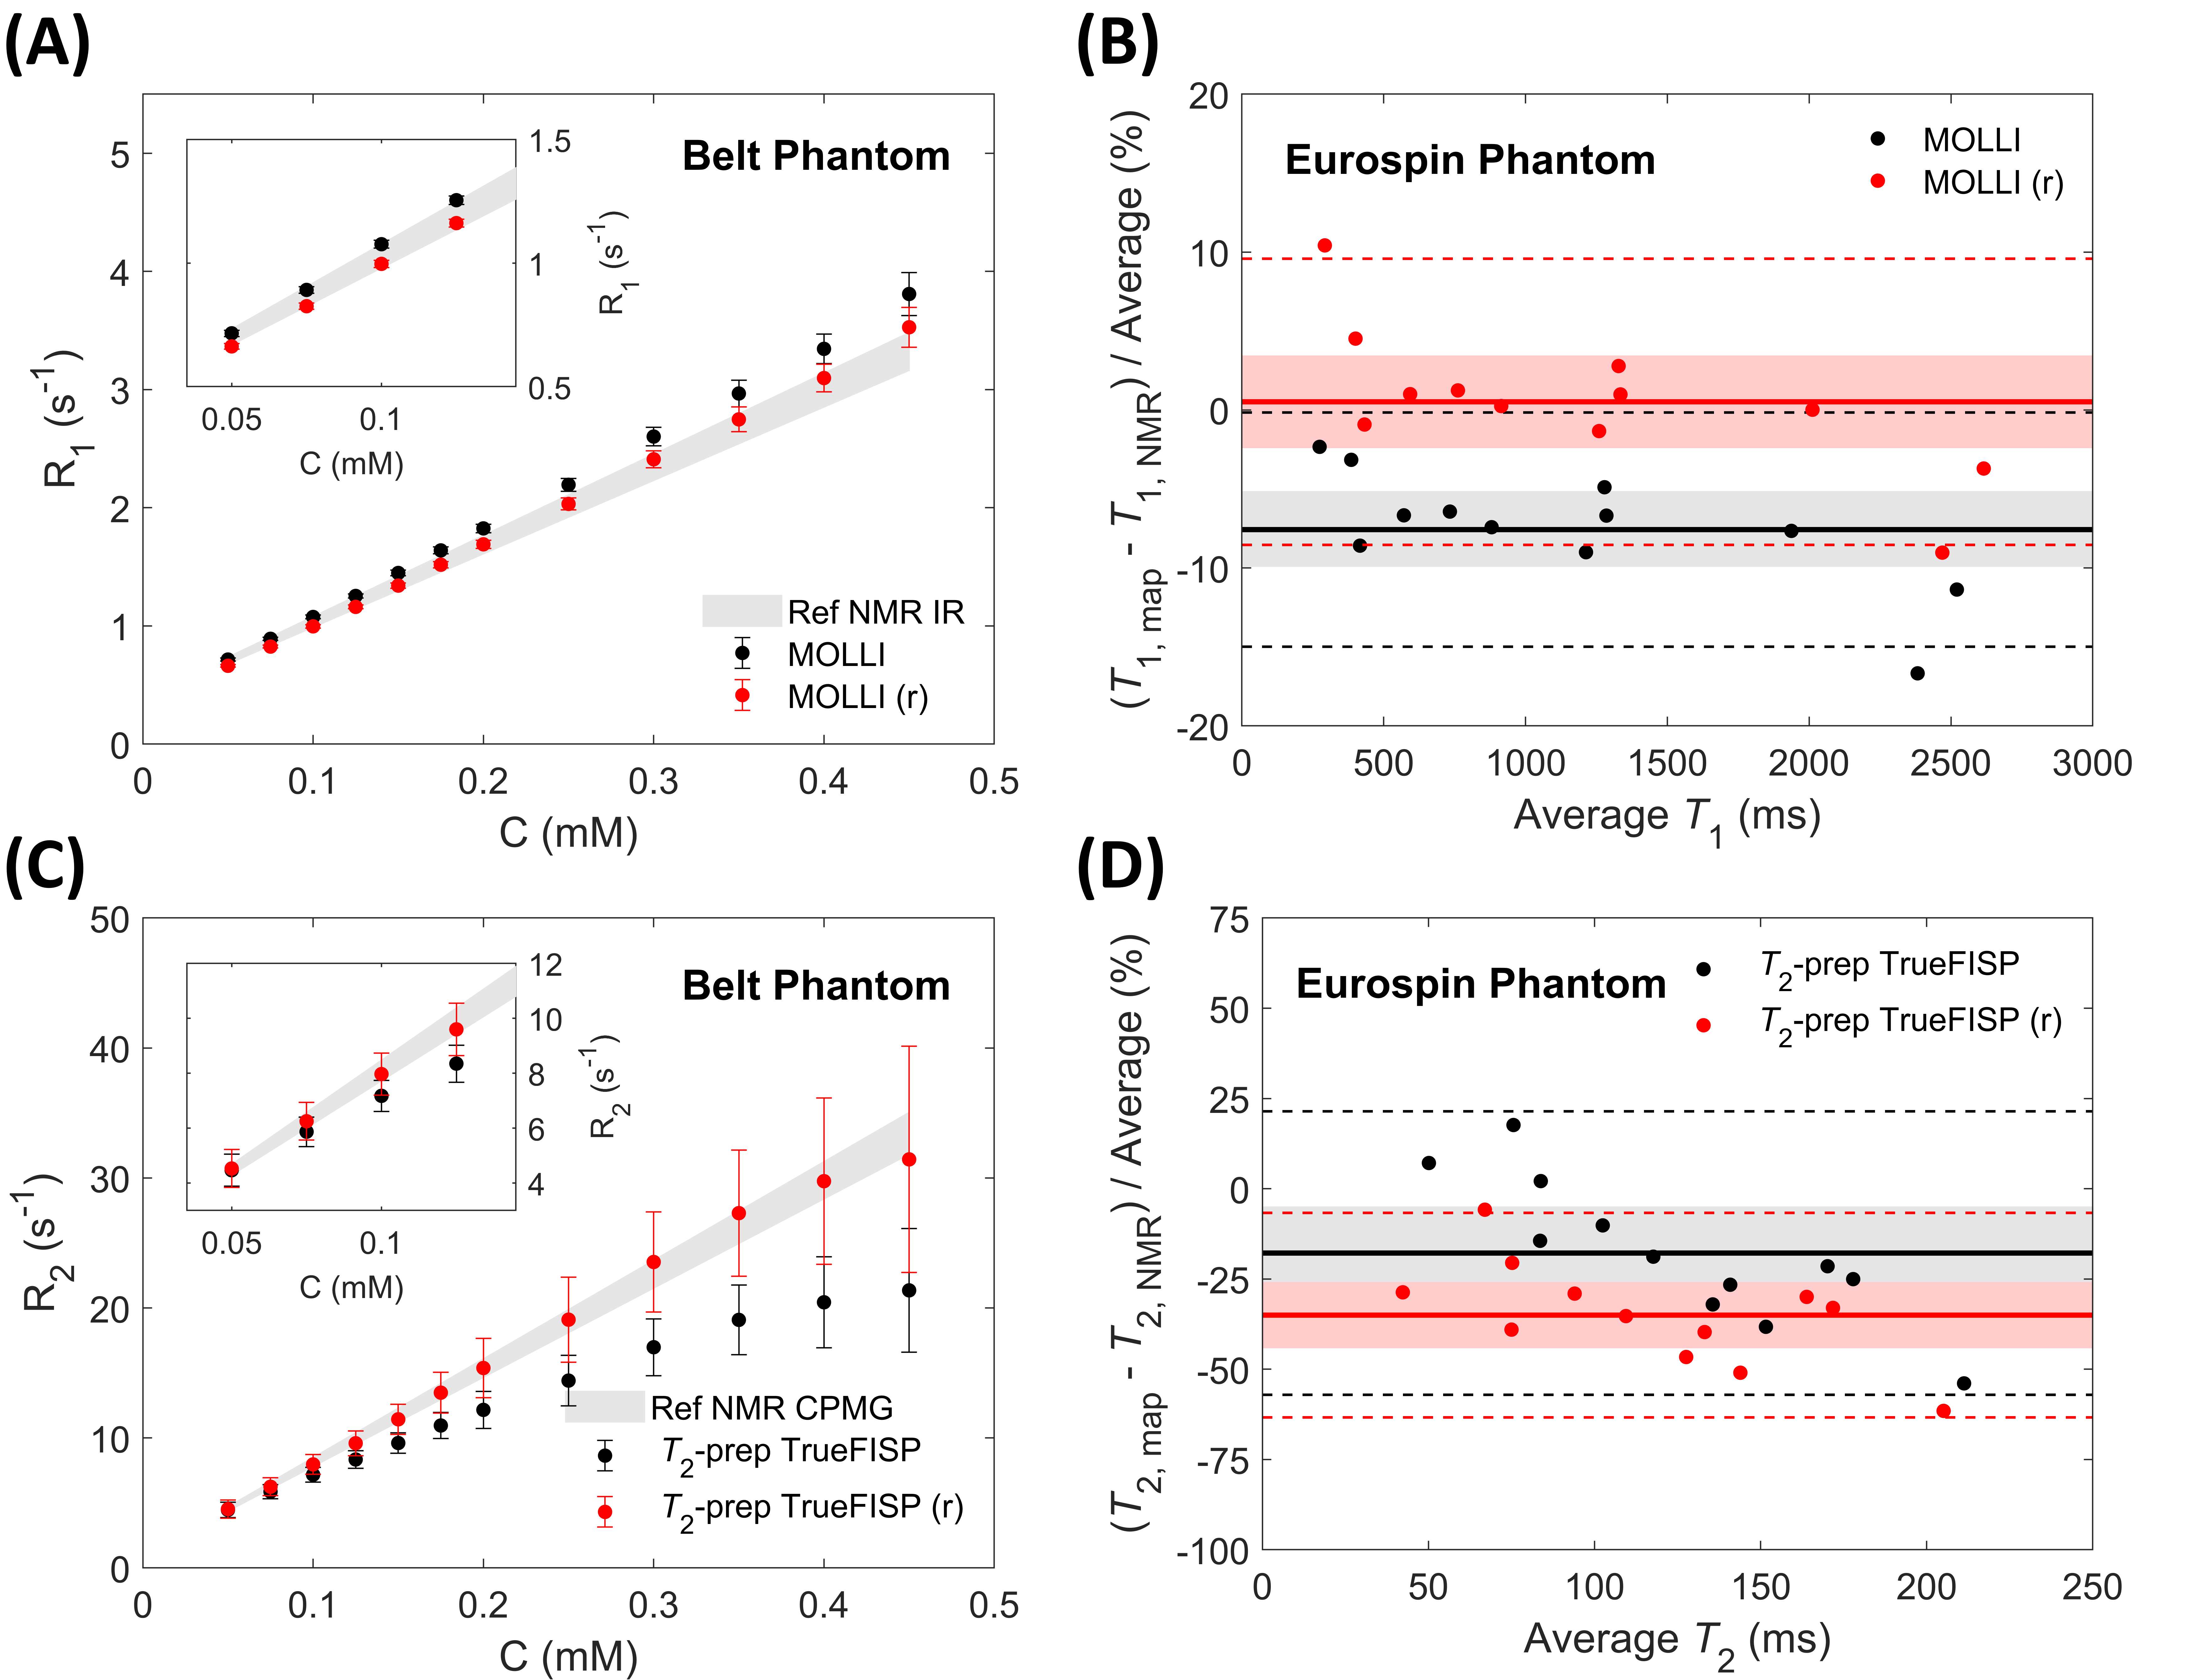
Figure 5 Effect of map recalibration on relaxation rates of the belt phantom’s samples (left) and Eurospin phantom’s samples (right) as measured on MOLLI (A and B) and T2-prep TrueFISP (C and D) maps with a simulated heart-rate of 60 bpm. The gray areas in the left column graphs represent the NMR reference values. Recalibrated data are indicated in red, original data in black. (Bland-Altman plots21,22: shaded areas = confidence level limits, dotted lines = limits of agreement, bold lines = mean values).