1339
A Recurrent Encoder-Decoder Network Accelerates T2 Mapping in Knee, Hip and Lumbar Spine
Aniket Tolpadi1,2, Francesco Calivà1, Misung Han1, Valentina Pedoia1, and Sharmila Majumdar1
1Radiology and Biomedical Imaging, UCSF, San Francisco, CA, United States, 2Bioengineering, University of California, Berkeley, Berkeley, CA, United States
1Radiology and Biomedical Imaging, UCSF, San Francisco, CA, United States, 2Bioengineering, University of California, Berkeley, Berkeley, CA, United States
Synopsis
Compositional MRI (cMRI) offers sensitivity to biochemical changes that can precede morphological changes in tissues and offer quantitative assessments of musculoskeletal tissue health but suffer from long scan times. We present a recurrent encoder-decoder architecture that predicts ground truth T2 maps from spatially undersampled echo images. Reconstructed maps showed strong fidelity to ground truth in lumbar spine IVDs and knee and hip knee cartilage. Reconstruction errors were below clinically significant T2 changes through R=12 in the knee and lumbar spine and R=8 in the hip. This work marks progress towards a clinical pipeline that reduces cMRI acquisition time.
Introduction
Compositional MRI (cMRI) techniques like T2 relaxometry are promising in musculoskeletal (MSK) imaging for detecting pre-morphological tissue changes1. Unlike conventional clinical protocols, T2 relaxometry offers sensitivity to proteoglycan, collagen, and water content2, thereby detecting biochemistry changes that can precede morphological tissue changes3 such as osteoarthritis onset4,5. T2 relaxometry also offers quantitative MSK tissue health assessments6, correlating with semiquantitative assessments such as Pfirrmann grades7 in intervertebral discs (IVDs) and Kellgren-Lawrence (KL)8 grades in the knee, while also correlating with well-validated metrics of hip cartilage health9. A challenge facing cMRI, however, is acquisition time: while mapping sequences like the magnetization-prepared angle-modulated partitioned k-space spoiled gradient echo snapshots (MAPSS) yield robust parameter maps, acquisition times can be as long as 10 minutes10. Additionally, in MSK imaging, a handful of tissues are often of heightened clinical interest, meaning cMRI acquisition times should be reduced while maintaining reconstruction quality in tissues like cartilage and IVDs.Methods
Image AcquisitionWe used previously acquired MAPSS datasets from patients in the knee, hip, and lumbar spine. Each acquisition included T1ρ-prepared images at four spin-lock times (TSLs) for T1ρ quantification, and three additional T2-prepared images for T2 quantification (TSL=0ms images were shared for TE=0ms images), but we only used four echo images for T2 quantification. 109 knee images were acquired sagitally across 109 patients; 89 hip images were acquired across 46 patients; 36 lumbar spine images were acquired across 31 patients. Acquisition parameters were as follows: FOV=14cm2; acquisition matrix=256×128; ±62.5kHz readout bandwidth; 64-view acquisition per T2 preparation; slice thickness=4.0mm (knee and hip) or 8.0mm (spine); TEs=0ms, 12.9ms, 25.7ms, 51.4ms (knee and spine) or 0ms, 10.4ms, 20.8ms, 41.7ms (hip).
T2 Fitting and Undersampling
The 4 T2 echo images were extracted, and later echo images for each slice were registered to the corresponding T2=0ms echo images using a 3D rigid registration algorithm with a normalized mutual information criterion11. Levenberg-Marquardt fitting of registered echos yielded ground truth T2 maps12.
To simulate accelerated acquisition, coil-combined echo images after reconstruction were Fourier transformed and retrospectively undersampled. The central 5 percent of k-space was sampled, and remaining lines sampled from the sampling ellipse using a normal distribution centered at (ky,kz)=(0,0). Undersampling was unique for each echo; for a given ky-kz not sampled at an echo, the ky-kz point was initialized with the corresponding ky-kz of the temporally closest echo for which that ky-kz was sampled, zero-filling if not sampled across any echo. k-Space was subsequently inverse Fourier transformed, yielding undersampled echos.
Training
A recurrent encoder-decoder network predicted fully sampled T2 maps from 4 undersampled T2 echos (Fig. 1). The network was trained with a 4-component loss whose weightings were optimized in a random hyperparameter search: global L1 loss, tissue-specific L1 loss (cartilage or IVD), feature-based loss12, and structural similarity index. Pipeline performance was quantified using Pearson’s r and normalized root mean square error (nRMSE) in cartilage or IVD.
Results
Visually, predicted hip cartilage maps preserve local T2 elevations through R=10, while corresponding Bland-Altman plots show low bias and tight limits of agreement, with slightly less bias in acetabular cartilage (Fig. 2). In knee cartilage, predicted T2 maps preserve patterns and textures of ground truth maps with low error rates through R=10, while Bland-Altman plots show tight limits of agreement and bias that is minimized in patellofemoral cartilage (Fig. 3). In lumbar spine IVDs, predicted T2 patterns were reasonably preserved through R=6, while performance drops by R=10; Bland-Altman plots showed the line of equality within limits of agreement through R=12, but fairly wide limits as compared to the knee and hip (Fig. 4).Reconstruction metrics in knee cartilage showed performance was best in patellofemoral cartilage, while T2 reconstruction errors were below 10 percent through R=10 (Fig. 5). In hip cartilage, reconstruction performance was best in femoral cartilage across tested R, but overall T2 quantification errors were below 9 percent through R=12. In lumbar spine IVDs, Pearson’s r showed strong correlations between predictions and ground truth through R=6.
Discussion and Conclusions
The recurrent encoder-decoder architecture shows strong performance across multiple MSK tissues—particularly knee and hip cartilage—in preserving T2 values and local patterns with minimal bias. Other knee cartilage studies found T2 is 13.4% higher in lateral femoral condyle cartilage and 12.3% higher in medical femoral condyle cartilage among patients with mild OA compared to controls13; our quantification errors are below these thresholds through R=12. In femoral hip cartilage, T2 values among healthy patients that progress to OA within 18 months are 7.3% higher than in controls14; our quantification errors are below these benchmarks through R=8. In IVDs, T2 decreases 24.2% in the annulus fibrosus from healthy to degenerative discs15; our quantification errors for full discs were below this benchmark through R=12. This framework can therefore reconstruct MSK T2 maps with quantification errors below clinical significance in many discs and cartilage compartments at high R.This work represents progress towards clinical pipelines that can dramatically reduce cMRI scan times. These findings justify investigation of ways to further improve map texture retention and extension to T1ρ mapping acceleration. Further applications include use of multi-coil k-space rather than retrospectively undersampled coil-combined images.
Acknowledgements
We would like to acknowledge Prachi Pandit for help in curating the lumbar spine dataset. We would also like to knowledge Claudia Iriondo for additional help in lumbar spine and hip dataset curation and IVD segmentation. Additionally, we also acknowledge Alex Beltran for assistance in knee dataset curation. Finally, we also would like to acknowledge our funding sources NIH UH3AR076724, NIHR01AR078762, and NIHR01AR069006.References
- Roemer FW, Kijowski R, Guermazi A. Editorial: from theory to practice – the challenges of compositional MRI in osteoarthritis research. Osteoarthr Cartil. 2017;25:1923-1925.
- Crema MD et al. Articular Cartilage in the Knee: Current MR Imaging Techniques and Applications in Clinical Practice and Research. Radiographics. 2011;31:37-61.
- Soellner ST, Goldmann A, Muelheims D, Welsch GH, Pachowsky ML. Intraoperative validation of quantitative T2 mapping in patients with articular cartilage lesions of the knee. Osteoarthr Cartil. 2017;25:1841-1849.
- Leibl H et al. Early T2 Changes predict Onset of Radiographic Knee Osteoarthritis – Data from the Osteoarthritis Initiative. Ann Rheum Dis. 2015;74:1353-1359.
- Atkinson HF et al. MRI T2 and T1r relaxation in patients at risk for knee osteoarthritis: a systematic review and meta-analysis. BMC Musculoskelet Disord. 2019. doi: 10.1186/s12891-019-2547-7.
- Friedrich KM et al. T2 Measurements of Cartilage in Osteoarthritis Patients with Meniscal Tears. AJR AM J Roentgenol. 2009;193:W411-W415.
- Pfirrmann CW, Metzdorf A, Zanetti M, Hodler J, Boos N. Magnetic resonance classification of lumbar intervertebral disc degeneration. Spine (Phila Pa 1976). 2001;26:1873-1878.
- Kellgren JH, Lawrence JS. Radiological Assessment of Osteo-Arthrosis. Ann Rheum Dis. 1957;16:494-502.
- Bashir A, Gray ML, Burstein D. Gd-DTPA2- as a measure of cartilage degradation. Magn Reson Med. 1996;36:665-673.
- Li X et al. Simultaneous acquisition of T1r and T2 quantification in knee cartilage – reproducibility and diurnal variation. J Magn Reson Imaging. 2014;39:1287-1293.
- Weingärtner S. Manual for RView. https://biomedic.doc.ic.ac.uk/uploads/Internal/rviewManual. Published February 16, 2010. Accessed July 2, 2021.
- More JJ. The Levenberg-Marquardt algorithm: Implementation and theory. In: Watson G.A. (eds) Numerical Analysis. Lecture Notes in Mathematics, vol 630. Springer, Berlin, Heidelberg. https://doi.org/10.1007/BFb0067700
- Dunn TC, Lu Y, Jin H, Ries MD, Majumdar S. T2 Relaxation Time of Cartilage at MR Imaging: Comparison with Severity of Knee Osteoarthritis. Radiology. 2004;232:592-598.
- Gallo MC et al. T1r and T2 Relaxation Times are Associated with Progression of Hip Osteoarthritis. Osteoarthr Cartilage. 2016;24:1399-1407.
- Cui YZ, Yang XH, Liu PF, Wang B, Chen C. Preliminary study on diagnosis of lumbar disc degeneration with magnetic resonance T1r, T2 mapping and DWI quantitative detection technologies. Eur Rev Med Pharmacol Sci. 2016;20:3344-3350.
Figures
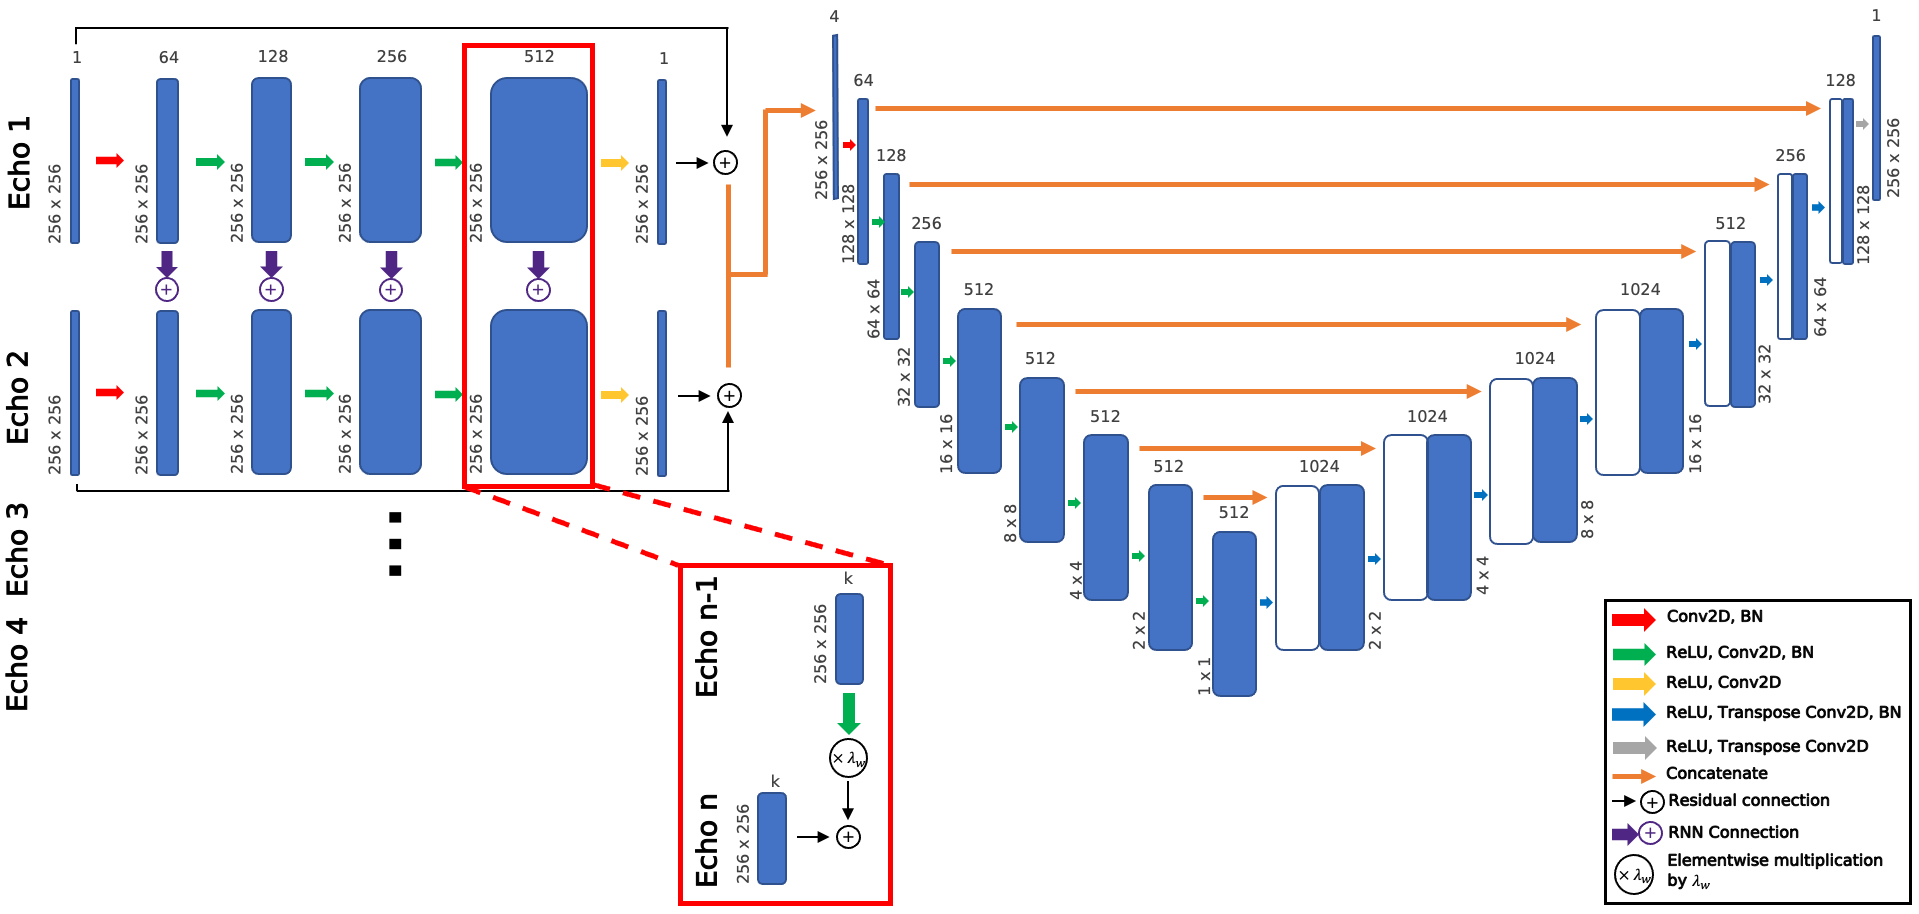
Figure 1: Recurrent encoder-decoder network to predict T2 map appearance from spatially undersampled T2-specific MAPSS acquisition echos. Each echo has a unique, 5-layer processing stream, with information passed from a given processing stream to corresponding layers in the subsequent temporal processing stream through RNN connections with weighting parameter λw=0.2. Processing stream outputs are concatenated and fed to the encoder-decoder network, which predicts T2 map appearance.
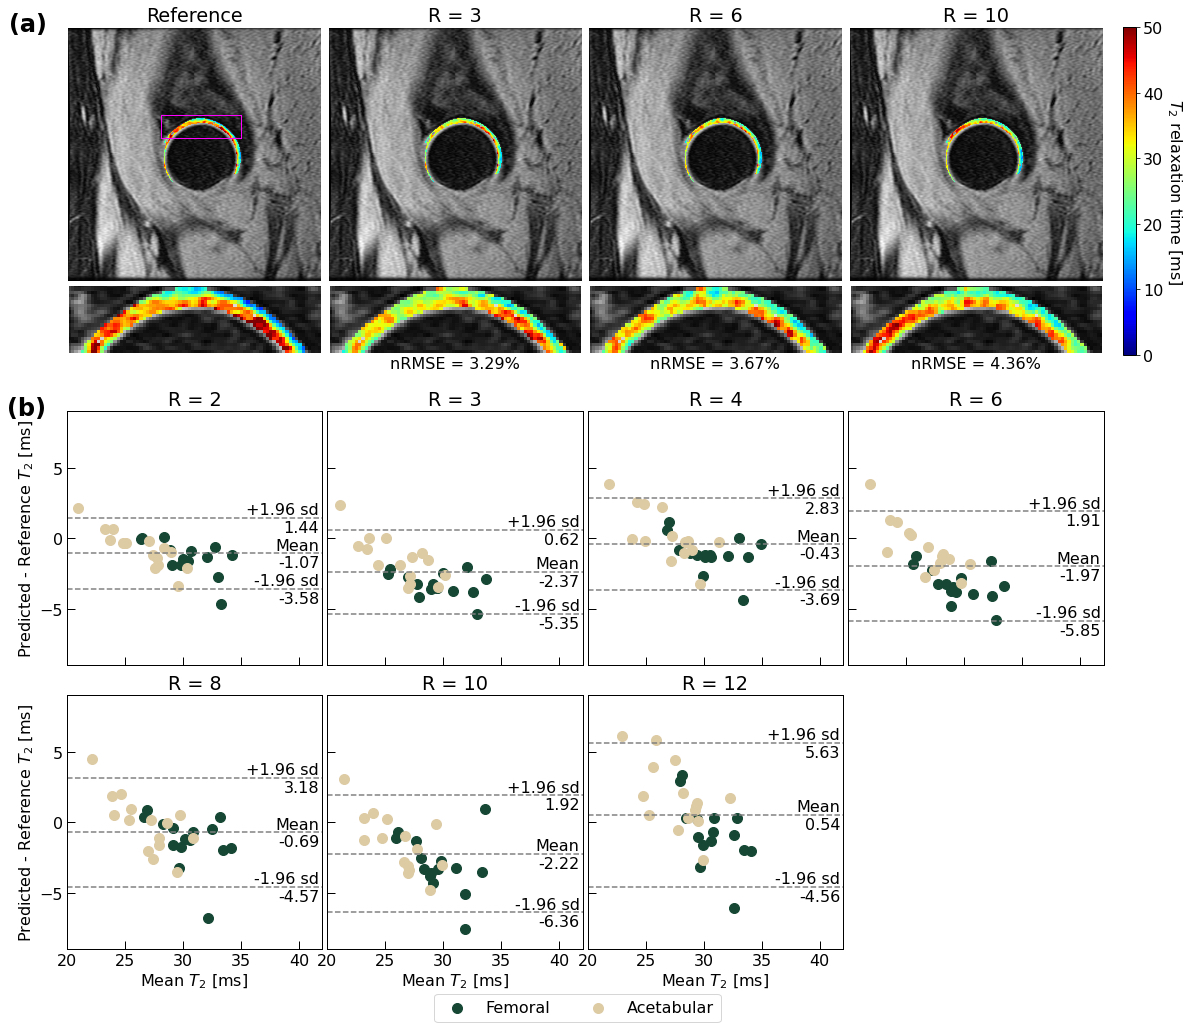
Figure 2: (a) Hip cartilage reconstructions for a patient and corresponding nRMSEs. Reconstructed hip cartilage maps cartilage are superimposed on the TE=0ms MAPSS echo. Reconstruction is strong through R=10, largely capturing local T2 elevation patterns. (b) Bland-Altman plots across test set (n=15, 2 cartilage compartments plotted for each) show limited bias and tight limits of agreement through R=12 in reproducing T2 values, with slightly lower bias in preserving acetabular cartilage T2.
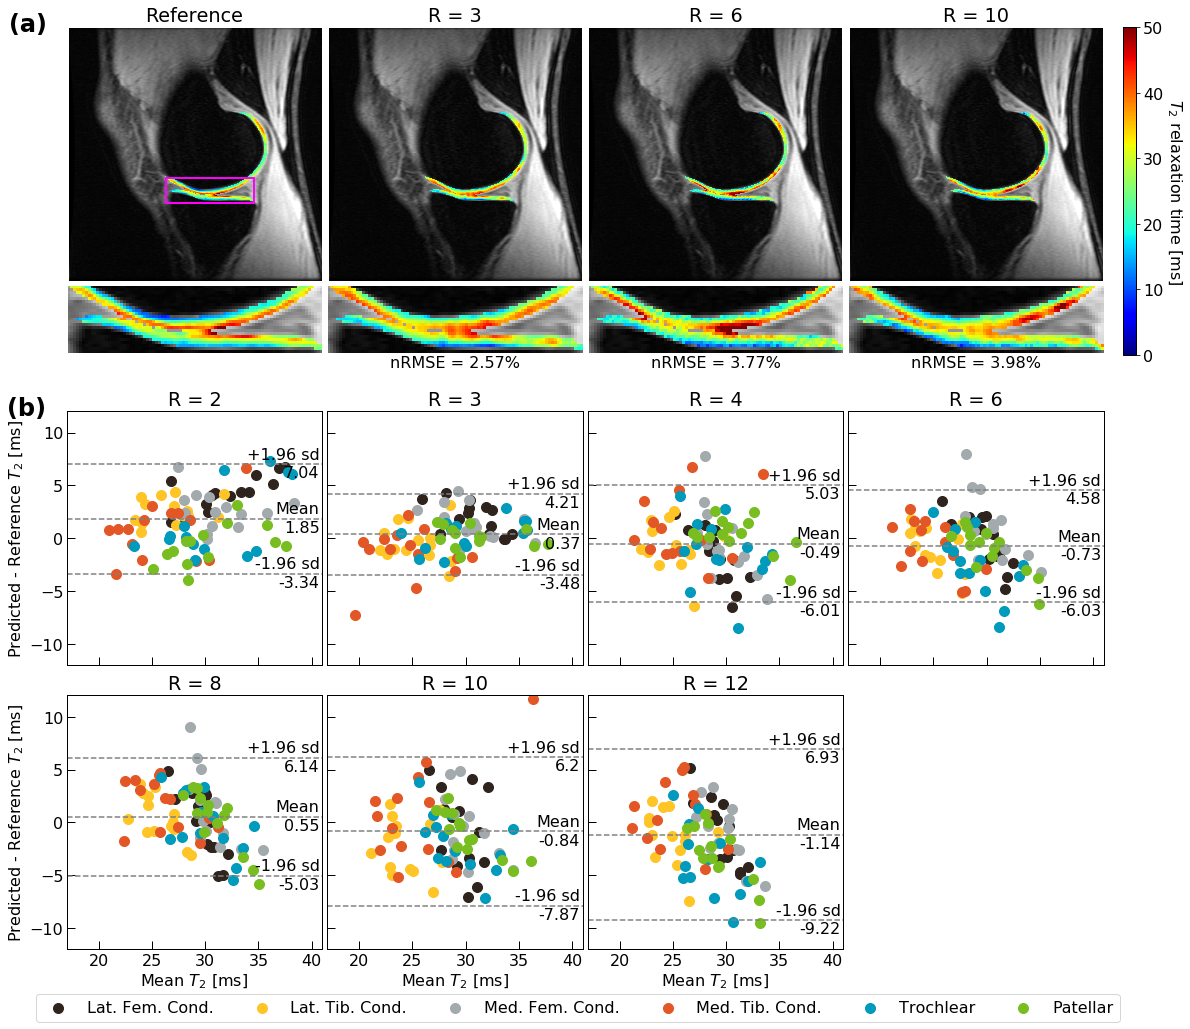
Figure 3: (a) Knee cartilage pipeline reconstructions for a patient and corresponding nRMSEs. Reconstructions are superimposed on the TE=0ms MAPSS echo. In this patient, performance is strong through R=10, particularly in medial tibiofemoral cartilage. (b) Bland-Altman across test set (n=14, 6 cartilage compartments plotted for each) show demonstrate minimal bias and tight limits of agreement across most tested R in reproducing T2 values, with best performance coming from patellofemoral cartilage.
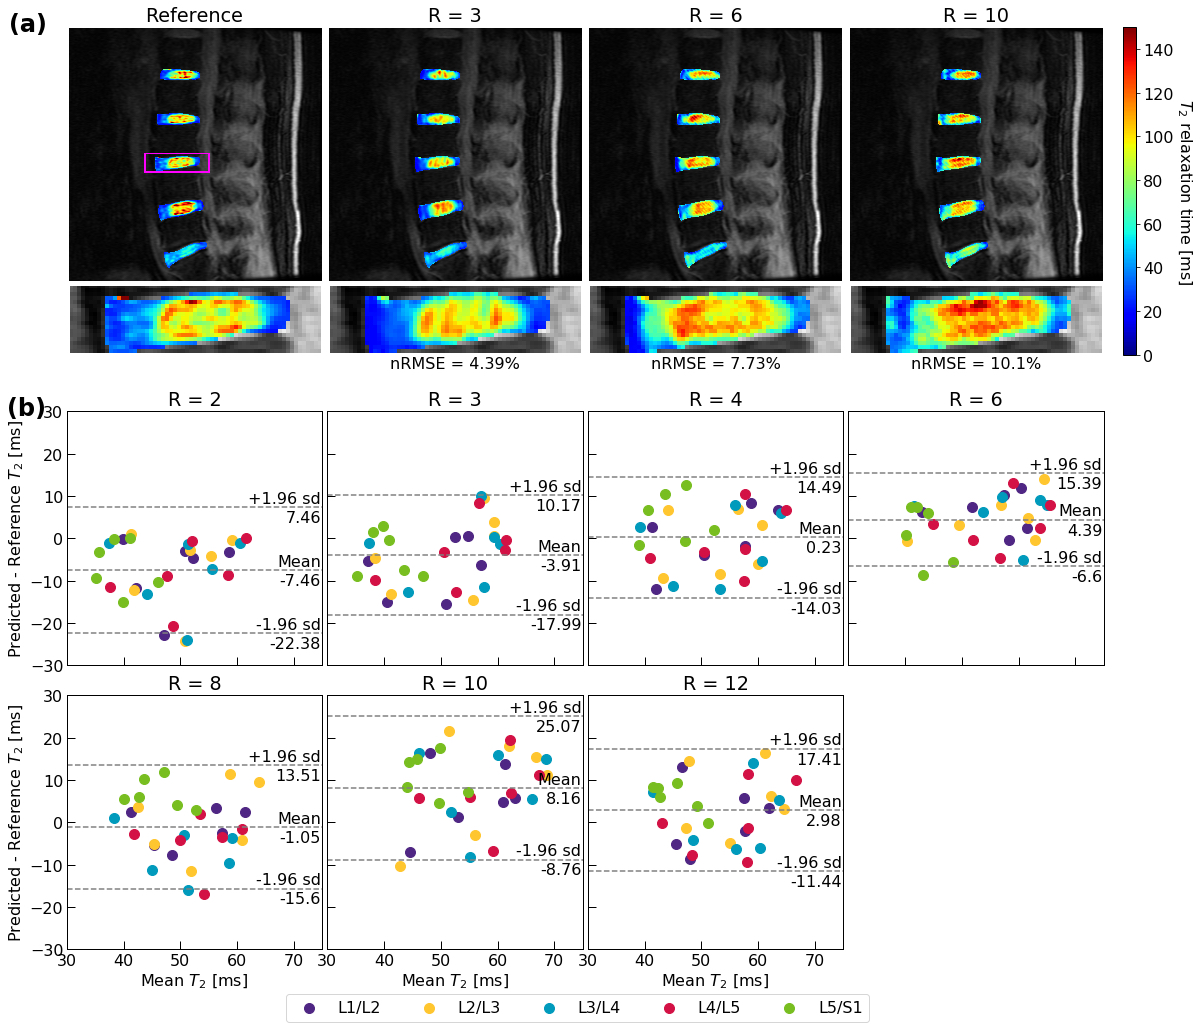
Figure 4: (a) Lumbar IVD reconstructions for a patient and corresponding nRMSEs. Reconstructions are superimposed on the TE=0ms MAPSS echo. Network performance is best through R=6, after which local T2 elevations are overestimated at R=10. (b) Bland-Altman across test set (n=6, 5 IVDs plotted for each) show some bias and fairly wide limits of agreement. Smaller dataset size and smaller number of slices in kz are likely responsible for poorer performance when compared to hip and knee cartilage.
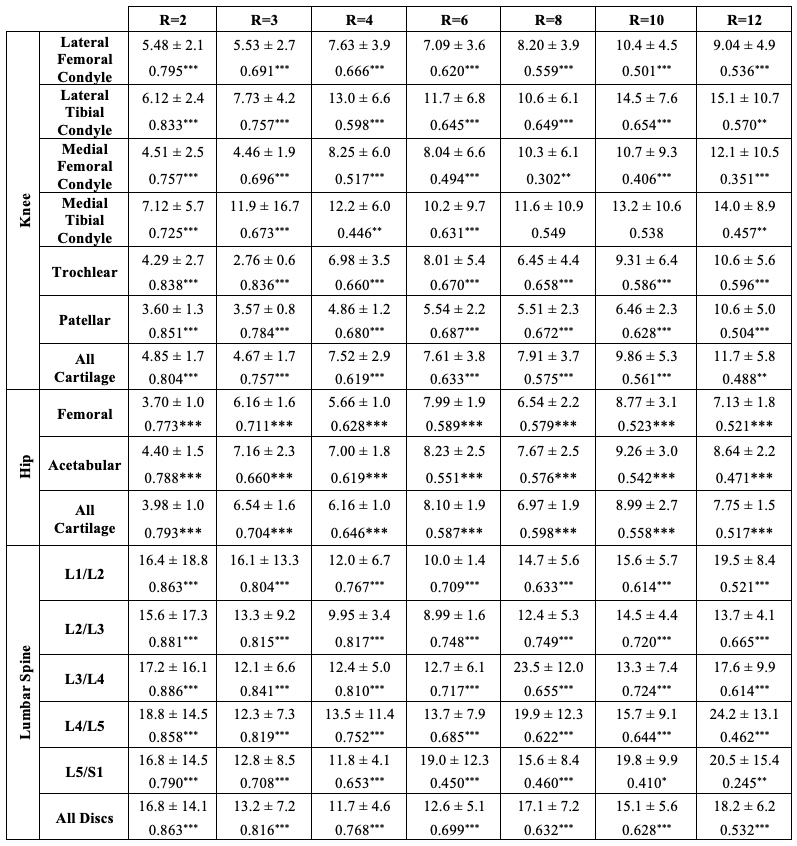
Figure 5: Trained pipeline performance for all three anatomies, reported as nRMSEs ±1 s.d. and Pearson’s r (* P<0.05, ** P<0.01, *** P<0.001). Knee and hip performance is below current scan-rescan reproducibility error rates across nearly all tested R, while Pearson’s r indicates strong reconstruction in the lumbar spine through R=6. Reconstructions within the knee were best within patellofemoral cartilage, best in femoral cartilage in the hip, and poorest in the L5/S1 IVD in the lumbar spine.
DOI: https://doi.org/10.58530/2022/1339