1337
Post mortem study of R2* and vessel distance maps across cortical depth1Biomedical Magnetic Resonance, Otto von Guericke University, Magdeburg, Germany, 2German Center for Neurodegenerative Disease, Magdeburg, Germany, 3Institute of Neuropathology, Medical Faculty at the Otto von Guericke University, Magdeburg, Germany, 4J. Philip Kistler Stroke Research Center, Massachusetts General Hospital, Boston, MA, United States, 5Department of Neurology, Otto-von-Guericke University, Magdeburg, Germany
Synopsis
In this proof-of-principle study, an image acquisition and processing pipeline was developed to assess the cortical vasculature and its surrounding tissue. To that end, a block of human brain, which included cortex and juxtacortical white matter, was scanned post-mortem at high resolution with a multi-echo GRE sequence at 9.4T. Subsequently, R2* and vessel distance maps (VDM) were computed and their layer-specific patterns analyzed.
Introduction
The cortical vasculature has a profound effect on brain function in health and disease1-3. Further, vascularization across the cortex is crucial to interpret (laminar) fMRI4-6. In this proof-of-principle study, an image acquisition and processing pipeline was developed to assess the cortical vasculature and its surrounding tissue. To that end, a block of human brain, which included cortex and juxtacortical white matter, was scanned post-mortem at high resolution. Subsequently, R2* and vessel distance maps were computed and their layer-specific patterns analyzed.Methods
A piece of the human parieto-occipital cortex was sampled and placed in a 10 mL tube filled with Fomblin. After reaching the MR scanner room temperature, the tissue sample was put into the cryo-coil of a 9.4T animal scanner (Bruker BioSpin MRI GmbH, Ettlingen, Germany). A multi-echo GRE sequence was acquired with the following parameters: 0.10x0.10x0.15mm voxel size; 20x20x13.8mm FOV; 8 echoes with 3ms spacing, first TE=2.5ms; TR=30ms; 4 averages, approx. 36min scan time.Per voxel, R2* was fitted mono-exponentially with ordinary least-squares (log-linear representation)7. The vasculature was enhanced in the R2* maps with a Frangi filter8, followed by hysteresis thresholding (thresholds obtained from 3-class Otsu method) to segment the vasculature9. Subsequently, vessel distance maps (VDM)10-12 were generated by computing the Euclidian distance13 of every voxel to its closest vessel. Although VDM is related to conventionally used vessel densities, VDM interpolates the spares vessel information while vessel densities summarize the vessel fraction for a given ROI into a single number. Thus, with VDM the closeness of each voxel to its surrounding vasculature is estimated, enabling spatially-resolved pattern analysis across the cortex. A manually delineated mask was created to extract the cortex surrounding the sulcus. Using LAYNII14, the normalized cortical depth was computed per voxel (equi-voluming approach). The processing pipeline is summarized in Fig.1. To assess potential interdependencies between R2* and vessel enhancement or VDM, Pearson correlation was calculated, respectively. Further, intra-cortical patterns were assessed visually and quantitatively.Results
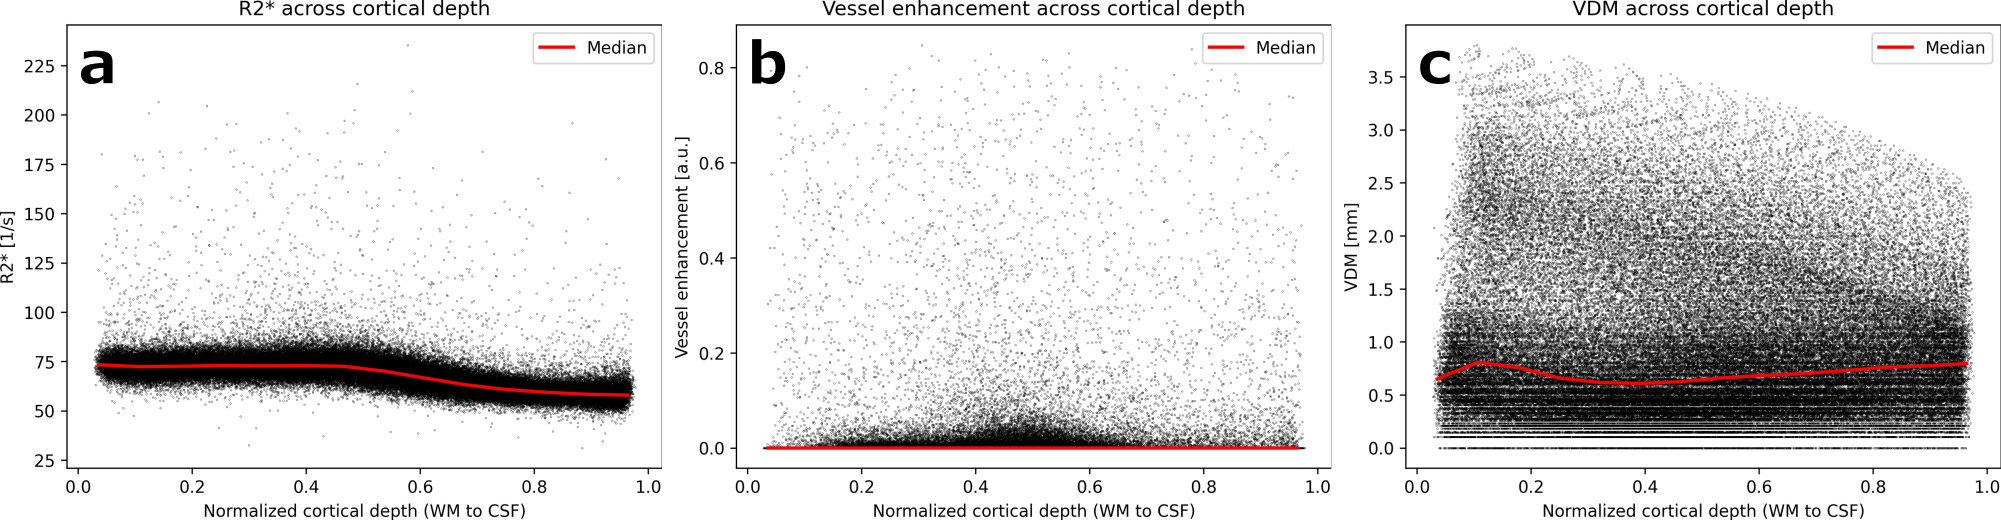
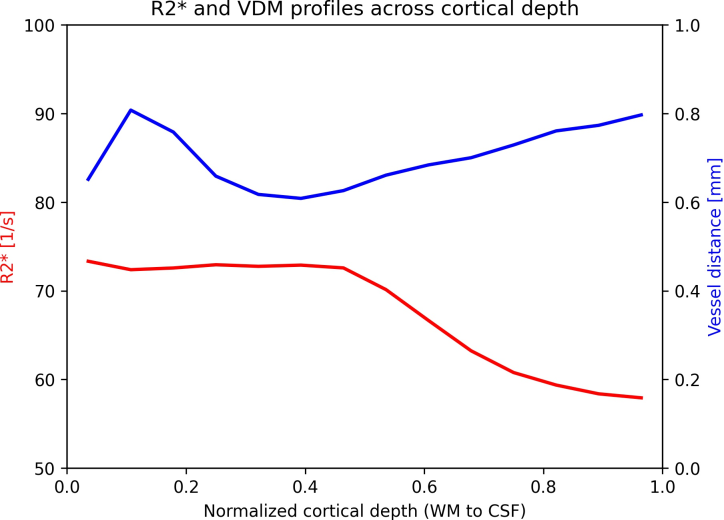
Fig.2 shows variations of R2* and vascular patterns across the cortex. A fair, statistically significant correlation between vessel enhancement and R2* was observed (see Fig.3). Hence, tubular structures tend to return higher R2* values. No correlation between R2* and vessel distances was found, albeit for vessels (distances of 0.0mm) which returned a large variety of R2* values, peaking at up to 225 1/s (see Fig.3). Fig. 4 shows R2*, vessel enhancement, and VDM across normalized cortical depth (0.0 as white matter, 1.0 as CSF boundary, respectively). Median R2* values plateaued around 70 to 75 1/s from white matter to the middle of the cortex before decreasing to approx. 55 1/s towards the pial surface. The here found median R2* values of 55 to 75 1/s, corresponding to considerably short T2* value, were potentially driven by the fixation and embedding process15,16. Interestingly, vessel enhancement is strongest in the middle of the cortex. Small vessels reaching only the upper layers of the cortex were rarely observed due to the resolution used (see Fig.1). Mostly vessels penetrating through a large portion of the cortex were detected. Further, vessels enhancement is lower for vessels with low vessel-to-tissue ratios, such as small vessels, hence, representing a bias in analysis. Since VDM is based on the vessel enhancement, a similar trend can be observed, with the lowest distances being detected in the center of the cortex. Further, the variability of distances increases towards the white matter boundary. Although the detected vasculature and its patterns did not reflect a steady increase in vascular density from white matter to pial surface, vascular density patterns studied by histology peaked in the middle layers of the cortex as well17,18.Comparing the median profiles of R2* and VDM across cross cortical depth (see Fig. 5) show an inverse relationship for the middle of the cortex to the pial surface (R2* decrease, while vessel distances increase), while from white matter to the cortex center R2* plateaus and vessel distances have an additional peak close to the white matter boundary.Discussion
In this proof of principle study, R2* and vessel distance maps in the human cortex were studied ex vivo. While tubular structures, i.e. vessels, returned higher R2* values, the vessel distances did not correlate with R2* values. Hence, the here detected vasculature is not driving the R2* distribution. R2* and vessel patterns were assessed visually and quantitatively by median R2* and VDM profiles across the cortex. These intra-cortical patterns require follow-up studies for verification. When combined with histology, in order to differentiate between arterial and venous vessel, this imaging and data processing pipeline opens new possibilities to study ex vivo changes of R2* and vascularization within the cortex. Further, fMRI models could benefit from reliably estimated intra-cortical vascular profiles. Future work will characterize the dependency of the detected patterns to the tissue-to-static field orientation and imaging resolution. Further, the vessel enhancement and segmentation will be improved.Acknowledgements
This work was funded by the DFG-MA 9235/1-1.References
1. Blinder P, Tsai PS, Kaufhold JP, Knutsen PM, Suhl H, Kleinfeld D. The cortical angiome: an interconnected vascular network with noncolumnar patterns of blood flow. Nat Neurosci . 2013;16(7):889–897. doi: 10.1038/nn.3426.
2. Charidimou A, Boulouis G, Gurol ME, Ayata C, Bacskai BJ, Frosch MP, Viswanathan A, Greenberg SM. Emerging concepts in sporadic cerebral amyloid angiopathy. Brain . 2017;140(7):1829–1850. doi: 10.1093/brain/awx047.
3. Charidimou A, Pantoni L, Love S. The concept of sporadic cerebral small vessel disease: A road map on key definitions and current concepts. Int J Stroke . 2016;11(1):6–18. doi: 10.1177/1747493015607485.
4. Drew PJ, Mateo C, Turner KL, Yu X, Kleinfeld D. Ultra-slow Oscillations in fMRI and Resting-State Connectivity: Neuronal and Vascular Contributions and Technical Confounds. Neuron . 2020;107(5):782–804. doi: 10.1016/j.neuron.2020.07.020.
5. Havlicek M, Uludağ K. A dynamical model of the laminar BOLD response. Neuroimage . 2020;204:116209. doi: 10.1016/j.neuroimage.2019.116209.
6. Markuerkiaga I, Barth M, Norris DG. A cortical vascular model for examining the specificity of the laminar BOLD signal. Neuroimage . 2016;132:491–498. doi: 10.1016/j.neuroimage.2016.02.073.
7. Weiskopf N, Callaghan MF, Josephs O, Lutti A, Mohammadi S. Estimating the apparent transverse relaxation time (R2(*)) from images with different contrasts (ESTATICS) reduces motion artifacts. Front Neurosci . 2014;8:278. doi: 10.3389/fnins.2014.00278.
8. Frangi AF, Niessen WJ, Vincken KL, Viergever MA. Multiscale vessel enhancement filtering . In: Wells WM, Colchester A, Delp S, editors. Medical image computing and computer-assisted intervention: MICCAI'98 fist international conference, Cambridge, MA, USA, October 11-13,1998 proceedings, vol. 1496. Berlin: Springer-Verlag; 1998. p. 130–137. (vol. 1496).
9. Mattern H.Openly available sMall vEsseL sEgmenTaTion pipelinE (OMELETTE). 29th Annual Meeting of International Society of Magnetic Resonance in Medicine.
10. Mattern H, Speck O. Vessel distance mapping. 36th Annual Scientific Meeting of European Society for Magnetic Resonance in Medicine and Biology.
11. Mattern H, Schreiber S, Speck S. Vessel distance mapping for deep gray matter structures. 29th Annual Meeting of International Society of Magnetic Resonance in Medicine.
12. Mattern H. Vessel distance mapping of the aging subcortical venous vasculature.37th Annual Scientific Meeting of European Society for Magnetic Resonance in Medicine and Biology.
13. Maurer CR, Qi R, Raghavan V. A linear time algorithm for computing exact Euclidean distance transforms of binary images in arbitrary dimensions. IEEE Trans. Pattern Anal. Mach. Intell. . 2003;25(2):265–270 doi: 10.1109/TPAMI.2003.1177156.
14. Huber LR, Poser BA, Bandettini PA et al. LayNii: A software suite for layer-fMRI. Neuroimage . 2021;237:118091. eng doi: 10.1016/j.neuroimage.2021.118091.
15. Bossoni L, Hegeman-Kleinn I, van Duinen SG, Bulk M, Vroegindeweij LHP, Langendonk JG, Hirschler L, Webb A, van der Weerd L. Off-resonance saturation as an MRI method to quantify mineral- iron in the post-mortem brain. Magn Reson Med . 2021. eng doi: 10.1002/mrm.29041.
16. Stone AJ, Tornifoglio B, Johnston RD, Shmueli K, Kerskens C, Lally C. Quantitative susceptibility mapping of carotid arterial tissue ex vivo: Assessing sensitivity to vessel microstructural composition. Magn Reson Med . 2021;86(5):2512–2527. eng doi: 10.1002/mrm.28893.
17. Adams DL, Piserchia V, Economides JR, Horton JC. Vascular Supply of the Cerebral Cortex is Specialized for Cell Layers but Not Columns. Cereb Cortex . 2015;25(10):3673–3681. eng doi: 10.1093/cercor/bhu221.
18. Schmid F, Barrett MJP, Jenny P, Weber B. Vascular density and distribution in neocortex. Neuroimage. 2019;197:792–805. eng doi: 10.1016/j.neuroimage.2017.06.046.
Figures
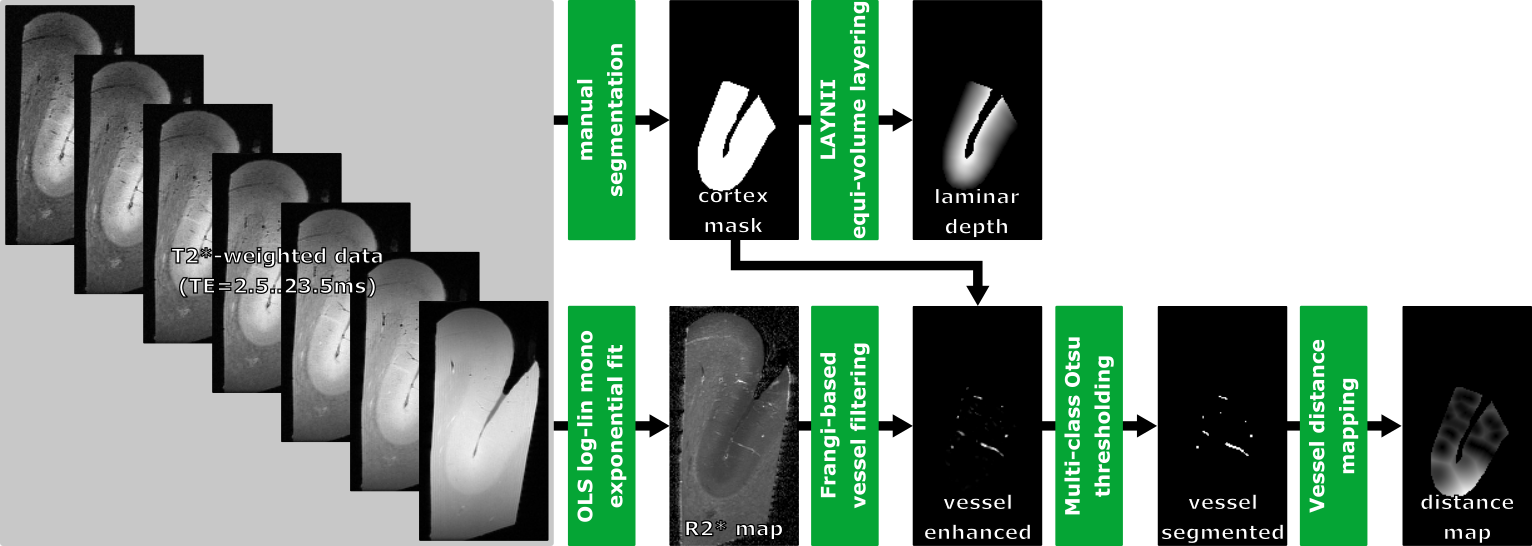
Figure 1: Processing Pipeline: R2* is fitted voxel-wise from the multi-echo data. To assess the vasculature regionally, vessels are enhanced, segmented, and then the vessel distance map is computed. A manually delineated mask is used to compute the laminar/cortical depth per voxel.
OLS – ordinary least-squares;
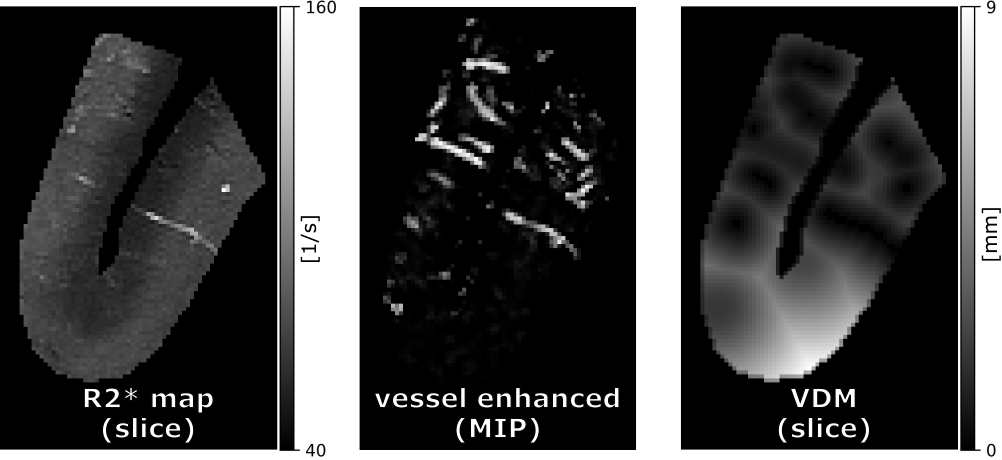
Figure 2: Assessment within cortex mask: Representative slices for R2* and VDM as well as a MIP over 10 slices of the vessel enhanced data of the manually segmented cortex are shown. Note that within a single VDM slice the vascular pattern in through-slice direction is also encoded (compare to vessel enhanced MIP).
MIP – maximum intensity projection; VDM - vessel distance map
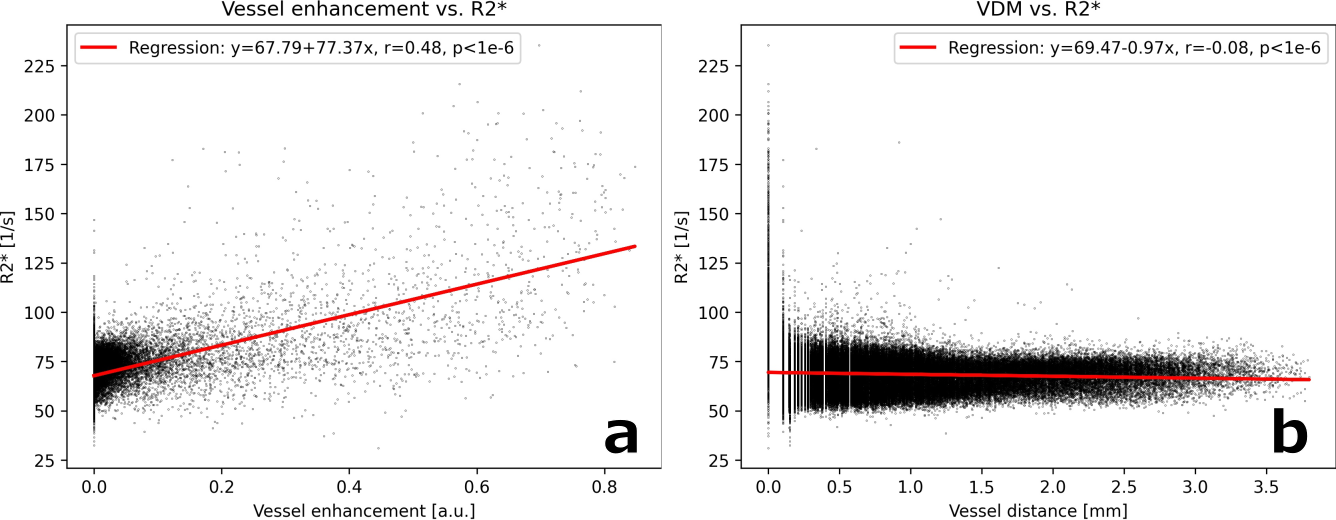
Figure 3: Correlation and regression result for R2* values with (a) vessel enhancement and (b) VDM.
VDM - vessel distance map