1336
Comparison of magnetization transfer quantification methods in the sciatic nerve of Charcot-Marie-Tooth Type 1A patients
Alison Roth1, Yongsheng Chen2, Jun Li2,3, and Richard D. Dortch1,4,5
1Division of Neuroimaging Research, Barrow Neurological Institute, Phoenix, AZ, United States, 2Department of Neurology, Wayne State University, Detroit, MI, United States, 3Department of Neurology, Vanderbilt University, Nashville, TN, United States, 4Vanderbilt University Institute of Imaging Science, Vanderbilt University, Nashville, TN, United States, 5Department of Biomedical Engineering, Vanderbilt University, Nashville, TN, United States
1Division of Neuroimaging Research, Barrow Neurological Institute, Phoenix, AZ, United States, 2Department of Neurology, Wayne State University, Detroit, MI, United States, 3Department of Neurology, Vanderbilt University, Nashville, TN, United States, 4Vanderbilt University Institute of Imaging Science, Vanderbilt University, Nashville, TN, United States, 5Department of Biomedical Engineering, Vanderbilt University, Nashville, TN, United States
Synopsis
Magnetization transfer (MT) can be quantified as the MT ratio (MTR), MT saturation (MTsat), and quantitative MT (qMT) pool-size-ratio (PSR). MTR is a promising peripheral nerve imaging biomarker in inherited neuropathies but has lower pathological specificity compared to MTsat and PSR. Here, MTR and MTsat metrics are compared to PSR. Eighteen subjects received 16 qMT scans, five T1-weighted scans, and the B0 and B1 fields were measured. Mean MTR, MTsat, and PSR were extracted from the sciatic nerve. MTR had the highest SNR (median>15.76) and scan-rescan repeatability (ICC=0.93, CV=4.6%), whereas MTsat had the strongest correlation to PSR (r=0.94, p<0.001).
Introduction
Magnetization transfer (MT) ratio (MTR) of peripheral nerves correlates with disability in patients with Charcot-Marie-Tooth Type 1A (CMT1A)1, which is an inherited dysmyelinating neuropathy. Although MTR reports on myelin content2, it is semi-quantitative, lacks pathological specificity, and is sensitive to scanner hardware and acquisition parameters3–5. Quantitative MT (qMT) methods provide tissue-specific parameters2,6–9 (e.g., macromolecular pool-size-ratio, PSR) that more specifically report on myelin; however, these methods require long scan times that limit clinical translation. More recently, MT saturation (MTsat)10,11, which isolates MT from T1 relaxation effects, has been proposed to improve pathological specificity while balancing scan time constraints. As such, this study systematically compared peripheral nerve MTR and MTsat values in terms of their relationships with myelin-specific PSRs, scan-rescan repeatability, and ability to differentiate heathy from dysmyelinated nerves, with the goal of establishing biomarkers of disease progression for future longitudinal studies in CMT1A.Methods
The thigh of 13 controls (21-43 y.o., 5 female) and five CMT1A patients (19-60 y.o., 3 female) was imaged on a 3.0-T MRI Philips scanner. MT data were acquired in each subject with a MT saturation pulse (20-ms sinc-Gauss at 1, 2, 4, 8, and 16 kHz off-resonance and 350°, 600°, and 800° effective flip angles), segmented EPI readout (5 lines/shot), and water-selective excitation pulse (1331, 6°). Additional parameters included: TR/TE=52-55/12.5 ms, SENSE factor=1.5, resolution=1.0x1.0x6.0mm3, and field-of-view=192x192x96mm3. A series of T1-weighted scans (6-30°, TR/TE=25/12.5 ms) were also acquired using the same sequence without an MT pulse. In addition, B0 was measured using a dual-gradient echo method12, and B1 map was estimated using the Bloch-Siegert method13.All data were non-rigidly co-registered using advanced normalization tools (ANTs)14. MTR was calculated from the reference data (no MT pulse) and a single MT-weighted image (1 kHz off-resonance at each MT pulse angle), and then was corrected for B1 inhomogeneities (MTRc)15. MTsat was calculated using the same images with each of the five T1-weighted images individually10,16 to determine the best subset of MT/T1-weighted acquisition parameters for MTsat. PSR was estimated by fitting all MT-weighted data to a two-pool MT model17 along with independent estimates of T1 (from all five T1-weighted scans), B1, and B0. The sciatic nerve was then manually segmented, and the mean slice-wise MT metrics were calculated for comparison.
Statistical Analysis
Linear relationships between PSR and MTR/MTsat (as a function of T1-weighted image flip angle and MT pulse angle) were evaluated using Pearson correlation in all subjects and ranked according to significant differences in Fisher-transformed correlation coefficient z-tests. The signal to noise ratio (SNR) was calculated for each estimated metric as the ratio of mean ROI values to the standard deviation across slices. The MT metrics were ranked based on SNR with ties assigned by the Wilcoxon signed-rank test. To evaluate scan-rescan repeatability, the relative scan-rescan limits of agreement were estimated based on two scans acquired in five control subjects (5-166 days between scans)18,19. Finally, clinical applicability of the metrics was assessed by evaluating significant differences between CMT1A patients and controls using the Wilcoxon rank-sum test. The effect size was assessed according to Cohen’s D calculated as the mean difference between groups divided by the standard deviation, which was assumed to differ across groups. Statistical significance was defined at the p<0.05 level.Results
Figure 1 shows representative parameter maps. Note the reduced sensitivity of MTsat to B1 variations (see posterior regions) relative to MTR, especially at lower MT pulse angles. All MTR and MTsat metrics significantly correlated with PSR (MTR without B1 map correction was weakest: r=0.71, p=0.001; MTsat when the T1 flip angle was 30° was the strongest: r=0.94, p<0.001, Figure 2). A saturation effect leading to non-linearities between MTsat and PSR was observed at higher values; however, this was reduced for larger T1 flip angles. The relationship between PSR and MTR/MTsat was largely consistent across MT pulse angles/offset frequencies. SNR was highest for the MTR methods and lowest for MTsat with T1 flip angle 6° (Figure 3). SNR significantly increased for MTR at higher powers, while no difference was observed across MT powers for MTsat. Additionally, B1 correction schemes had no significant effect on correlation to PSR or SNR for MTsat (data not shown). In terms of repeatability, all MT metrics showed acceptable levels of consistency across scans (Table 1). Finally, all MT metrics were significantly different between controls and CMT1A patients (Figure 3).Discussion and Conclusion
This study found that all MT metrics could differentiate healthy from dysmyelinated nerves. MTR was found to have higher precision than the other MT metrics and the narrowest limits of agreement but demonstrated the weakest relationship with PSR. In contrast, MTsat had the strongest correlation with PSR when T1 flip angle was 18-30° and achieved acceptable levels of precision and repeatability. In addition, MTsat was found to have reduced B1 sensitivity relative to MTR, although some sensitivity was observed at larger MT pulse angles. As a result, we are actively investigating more robust B1 correction strategies for MTsat. Future work will also include acquisition in a larger, longitudinal patient cohort to evaluate relationships between each MT metrics and disability and disease progression.Acknowledgements
This work was supported in part by an NIH/NCATS R21 TR003312 and Philips Healthcare.References
1. Dortch RD, Dethrage LM, Gore JC, et al. Proximal nerve magnetization transfer MRI relates to disability in Charcot-Marie-Tooth diseases. Neurology 2014;83(17):1545–1553.2. Samsonov A, Alexander AL, Mossahebi P, et al. Quantitative MR imaging of two-pool magnetization transfer model parameters in myelin mutant shaking pup. Neuroimage 2012;62(3):1390–1398.
3. Berry I, Barker GJ, Barkhof F, et al. A multicenter measurement of magnetization transfer ratio in normal white matter. J. Magn. Reson. Imaging 1999;9(3):441–446.
4. Henkelman RM, Huang X, Xiang Q-S, et al. Quantitative interpretation of magnetization transfer. Magn. Reson. Med. 1993;29(6):759–766.
5. Stanisz GJ, Odrobina EE, Pun J, et al. T1, T2 relaxation and magnetization transfer in tissue at 3T. Magn. Reson. Med. 2005;54(3):507–512.
6. Romero IO, Sinha U. Magnetization transfer saturation imaging of human calf muscle: Reproducibility and sensitivity to regional and sex differences. J. Magn. Reson. Imaging 2019;50(4):1227–1237.
7. Underhill HR, Rostomily RC, Mikheev AM, et al. Fast bound pool fraction imaging of the in vivo rat brain: Association with myelin content and validation in the C6 glioma model. Neuroimage 2011;54(3):2052–2065.
8. Gochberg DF, Kennan RP, Gore JC. Quantitative studies of magnetization transfer by selective excitation and T1 recovery. Magn. Reson. Med. 1997;38(2):224–231.
9. Schmierer K, Tozer DJ, Scaravilli F, et al. Quantitative magnetization transfer imaging in postmortem multiple sclerosis brain. J. Magn. Reson. Imaging 2007;26(1):41–51.
10. Helms G, Dathe H, Kallenberg K, Dechent P. High-resolution maps of magnetization transfer with inherent correction for RF inhomogeneity and T1 relaxation obtained from 3D FLASH MRI. Magn. Reson. Med. 2008;60(6):1396–1407.
11. Lema A, Bishop C, Malik O, et al. A Comparison of Magnetization Transfer Methods to Assess Brain and Cervical Cord Microstructure in Multiple Sclerosis. J. Neuroimaging 2017;27(2):221–226.
12. Skinner TE, Glover GH. An extended two-point dixon algorithm for calculating separate water, fat, and B0 images. Magn. Reson. Med. 1997;37(4):628–630.
13. Sacolick LI, Wiesinger F, Hancu I, Vogel MW. B1 mapping by Bloch-Siegert shift. Magn. Reson. Med. 2010;63(5):1315–1322.
14. Vercauteren T, Pennec X, Perchant A, Ayache N. Diffeomorphic demons: Efficient non-parametric image registration. Neuroimage 2009;45(1, Supplement 1):S61–S72.
15. Ropele S, Filippi M, Valsasina P, et al. Assessment and correction of B1-induced errors in magnetization transfer ratio measurements. Magn. Reson. Med. 2005;53(1):134–140.
16. Karakuzu A, Boudreau M, Duval T, et al. qMRLab: Quantitative MRI analysis, under one umbrella. J. Open Source Softw. 2020;5(53):2343.
17. Underhill HR, Yuan C, Yarnykh VL. Direct quantitative comparison between cross-relaxation imaging and diffusion tensor imaging of the human brain at 3.0 T. Neuroimage 2009;47(4):1568–1578.
18. Bland JM, Altman DG. Measuring agreement in method comparison studies. Stat. Methods Med. Res. 1999;8(2):135–160.
19. Bland JM, Altman DG. Agreement Between Methods of Measurement with Multiple Observations Per Individual. J. Biopharm. Stat. 2007;17(4):571–582.
Figures
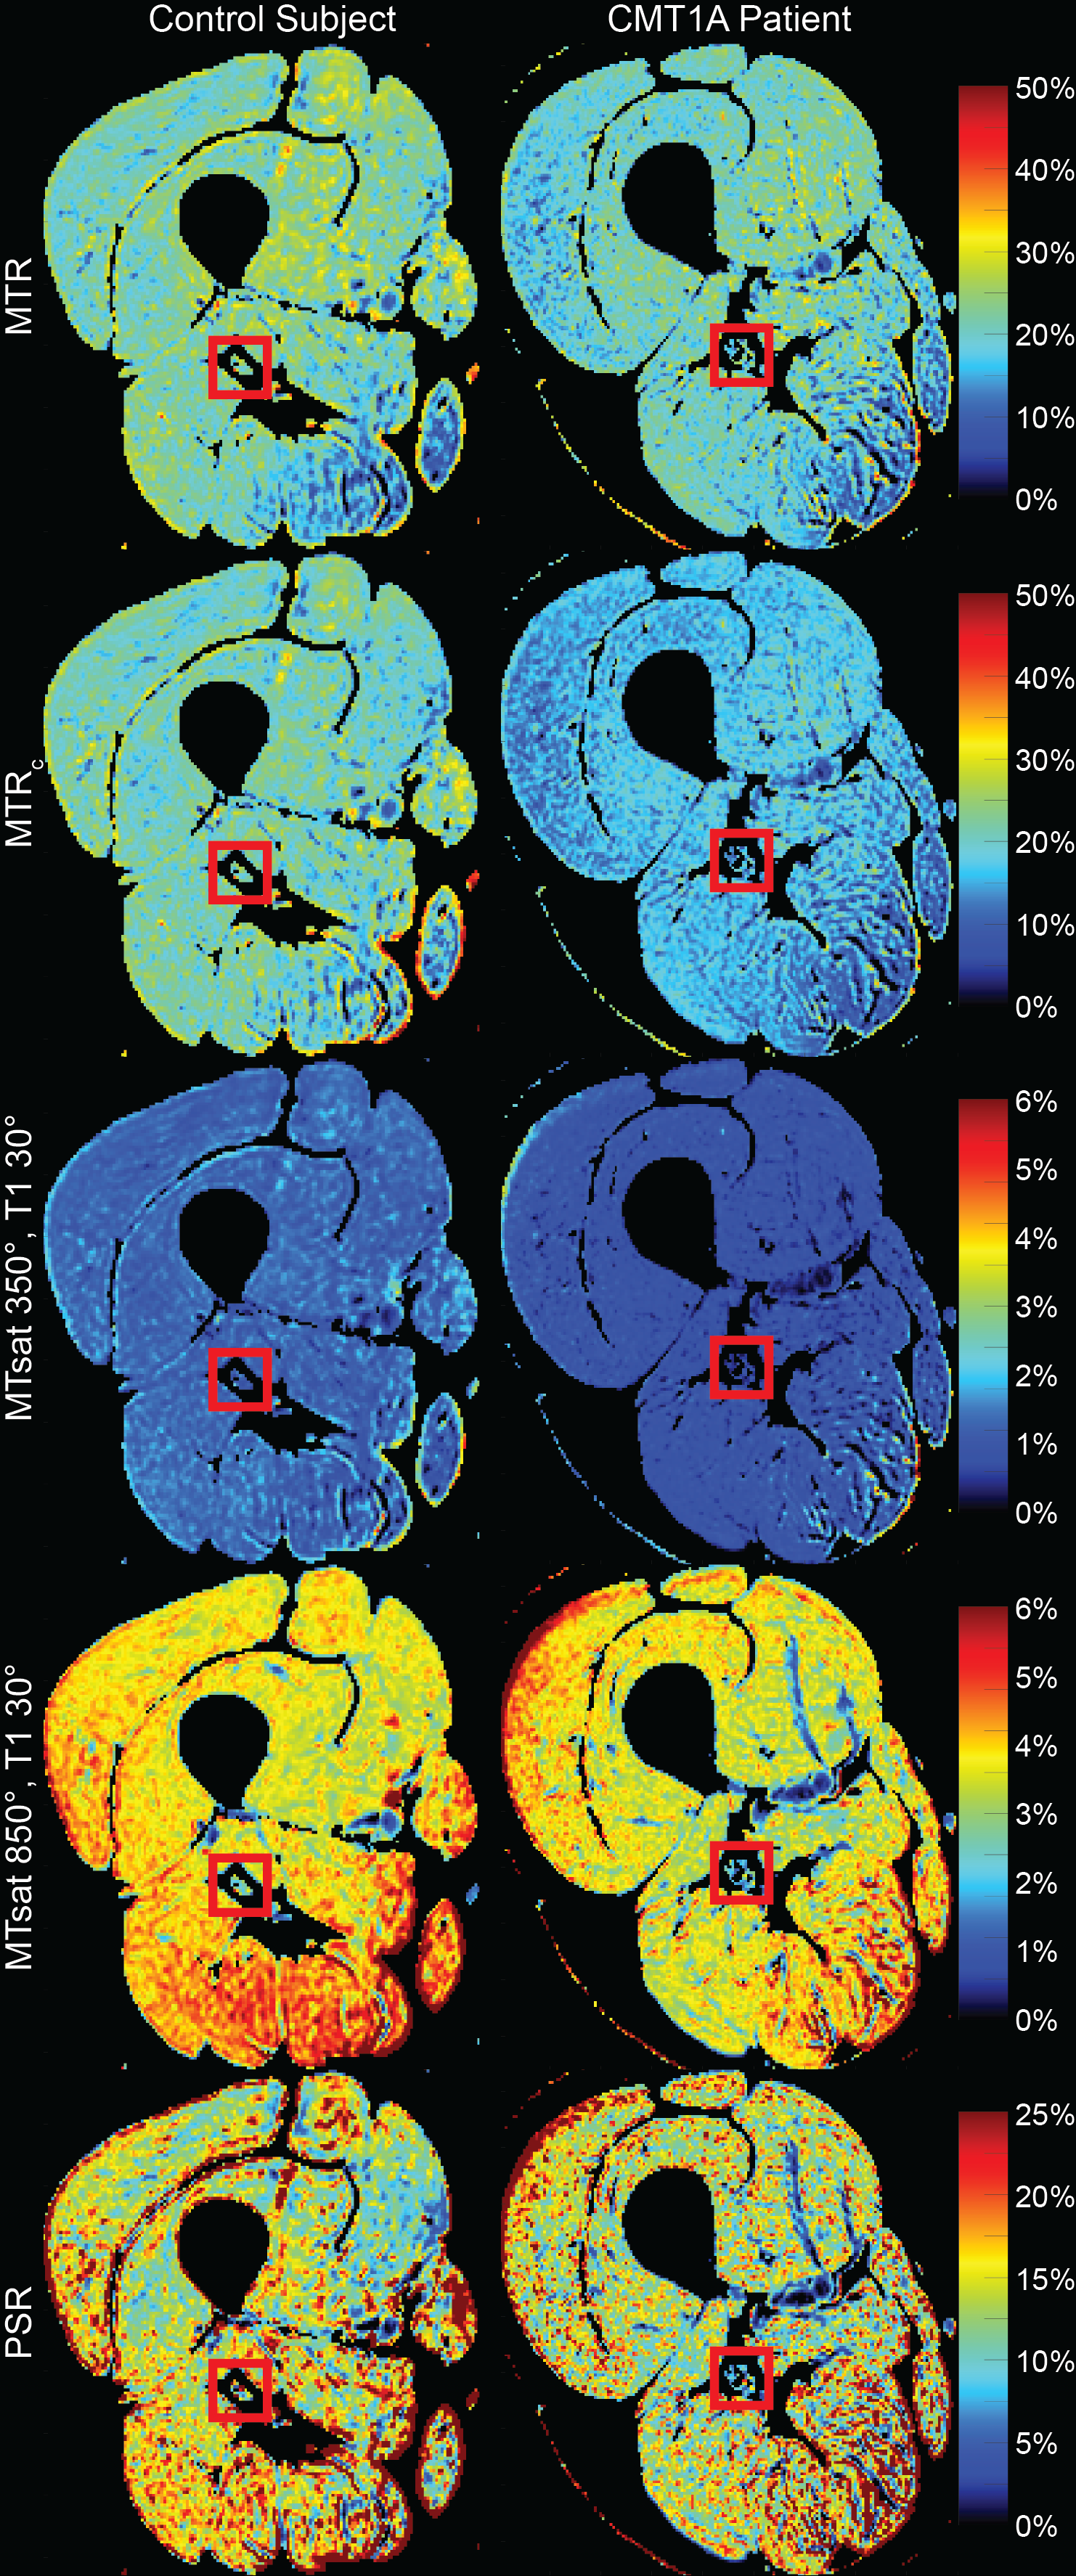
Figure 1 Example magnetization transfer (MT) ratio (MTR), MT saturation (MTsat), and pool size ratio (PSR) images of a healthy control subject (left) and CMT1A patient (right). MTR images were corrected for RF field inhomogeneities (MTRc). MTsat was calculated for low power (350° effective flip angle) and high power (850°). The T1-weighted image used to calculate MTsat had a flip angle of 30°. The sciatic nerve is identified by the red box.

Figure 2 Scatterplots of magnetization transfer (MT) ratio (MTR) and MT saturation (MTsat) vs. pool size ratio (PSR) with Pearson correlation coefficient (r) and p-value. Significant relationships were found between PSR and all metrics. MT metrics were ranked by correlation with PSR; ties assigned by Fisher-transformed correlation coefficient z-test. MTR was corrected for B1 inhomogeneities (MTRc). T1-weighted images were acquired with five flip angles for MTsat calculation (6-30°). MTR and MTsat were assessed at higher powers (600° and 850°). Controls in black, CMT1A in orange

Figure 3 Boxplot of the signal to noise ratio (SNR) measured for each magnetization transfer (MT) method (MT ratio (MTR), MT saturation (MTsat), and pool size ratio (PSR)) in the sciatic nerve of each scan. MTR was corrected for RF field inhomogeneities (MTRc). T1-weighted images were acquired with five flip angles to optimize MTsat calculation (6-30°). Methods were ranked by SNR with ties assigned according to the Wilcoxon signed-rank test.
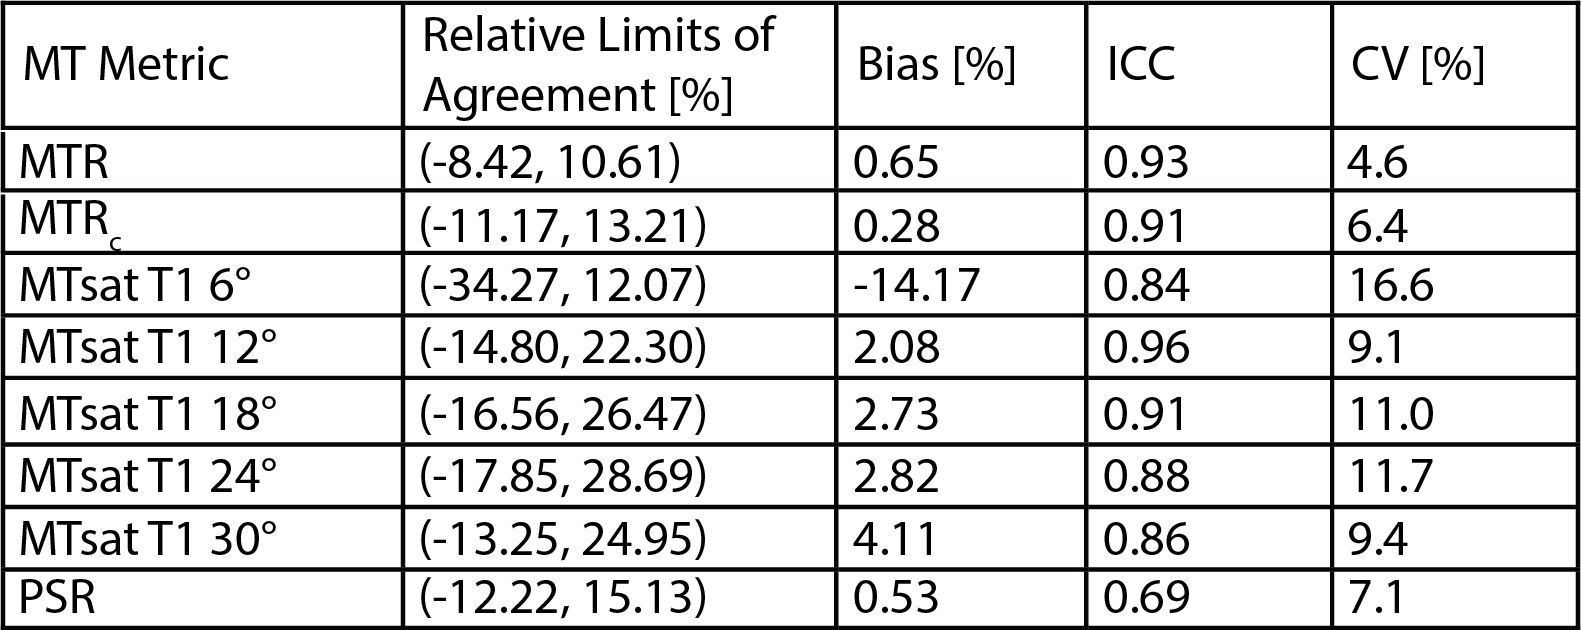
Table 1 Scan-rescan relative limits of agreement, bias, intraclass correlation (ICC), and coefficient of variation (CV) for all metrics measured in 5 healthy control patients. Scans were acquired 5-166 days apart (median 137). MTR is magnetization transfer ratio, MTsat is magnetization transfer saturation, and PSR is pool size ratio. T1-weighted images were acquired with five flip angles to optimize MTsat calculation (6-30°).
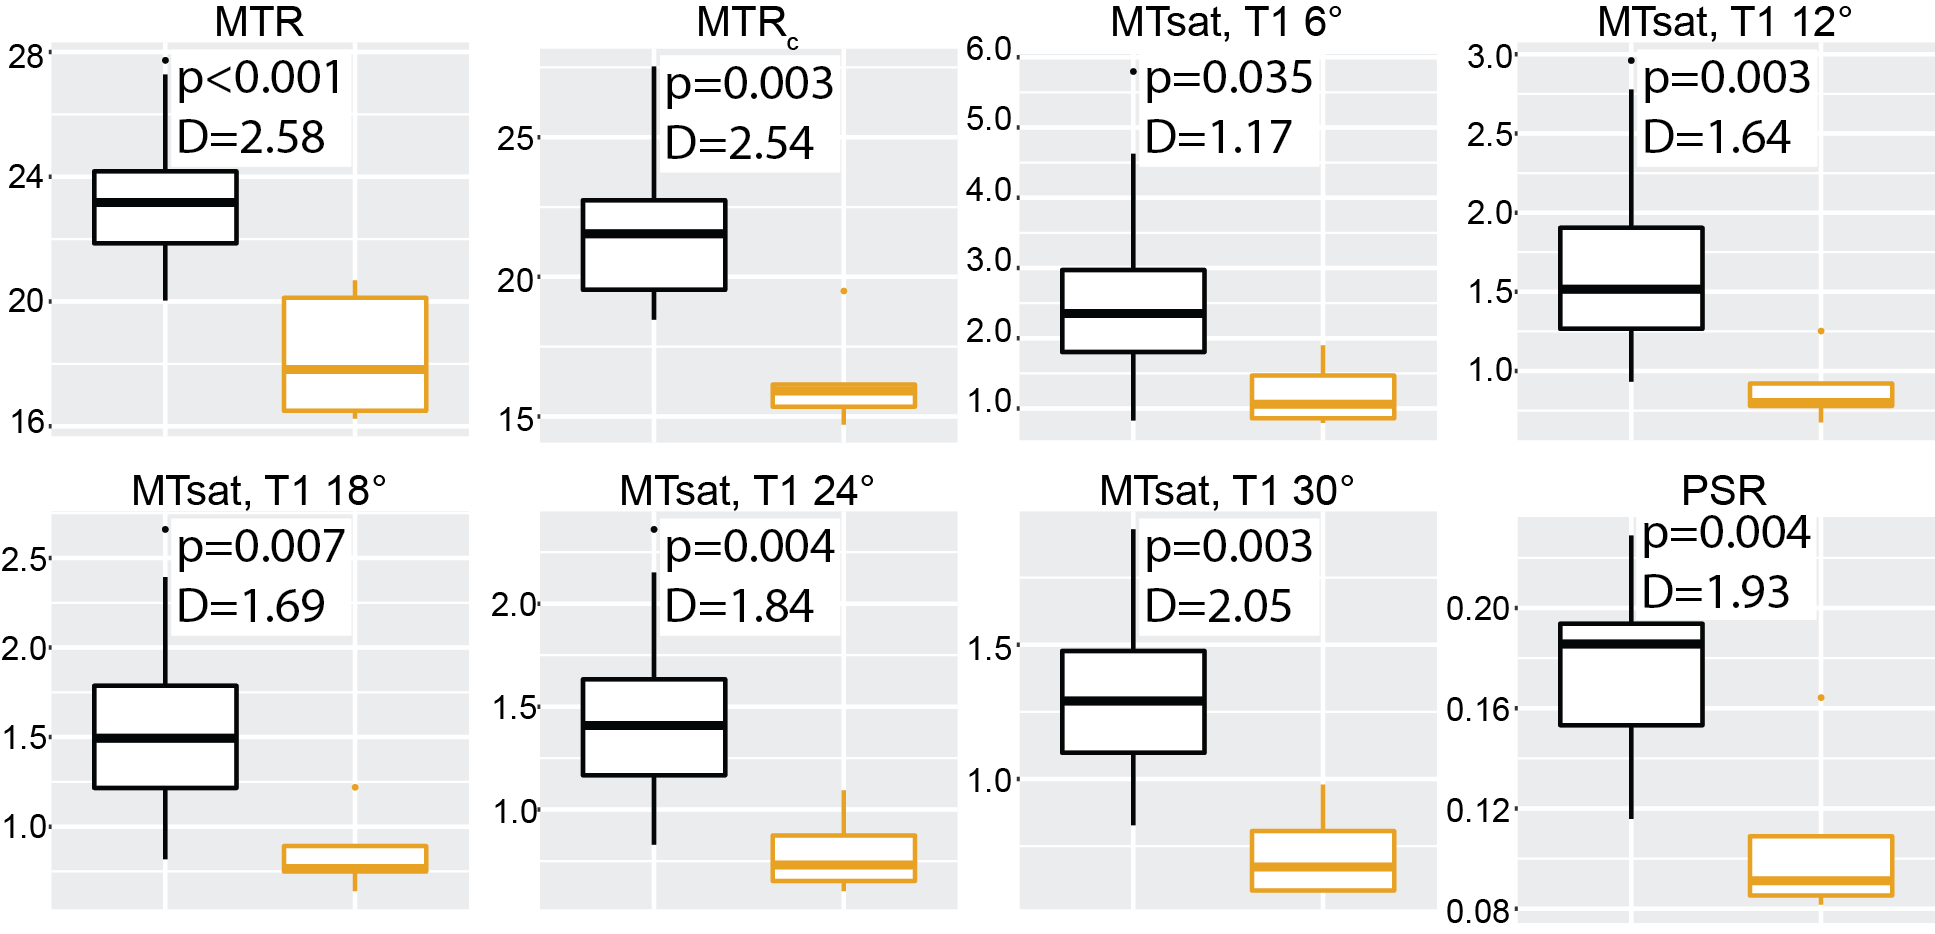
Figure 4 Box plots of magnetization transfer (MT) metrics by cohort with effect size (Cohen’s D). Significant differences were found for all MT metrics between the control and CMT1A subjects. MT ratio (MTR) images were corrected for RF field inhomogeneities (MTRc). T1-weighted images were acquired with five flip angles to optimize for use with MTsat (6-30°). Healthy control subjects are in black, CMT1A patients in orange. MTsat is MT saturation and PSR is pool-size-ratio.
DOI: https://doi.org/10.58530/2022/1336