1333
Analyzing Radiomic Features in Magnetic Resonance Images of Head and Neck Cancer during Radiation Therapy: Preliminary Results1Department of Diagnostic and Interventional Radiology, University of Tuebingen, Section on Experimental Radiology, Tuebingen, Germany, 2University of Stuttgart, Institute of Signal Processing and System Theory, Stuttgart, Germany, 3Department of Diagnostic and Interventional Radiology, University of Tuebingen, University Hospital Tuebingen, Tuebingen, Germany, 4Department of Radiation Oncology, University of Tuebingen, University Hospital and Medical Faculty, Tuebingen, Germany, 5Department of Radiation Oncology, University of Tuebingen, Section for Biomedical Physics, Tuebingen, Germany
Synopsis
The aim of this work was to identify potential texture features as imaging biomarkers for monitoring treatment response in head and neck cancer (HNC). For this purpose, a total number of 93 texture features were extracted on segmented calculated ADC maps and compared at baseline and in the early treatment phase of radiation therapy (RT). Fifteen texture features showed a statistically difference in the course of RT. In particular, features suggesting that ADC-based HNC texture became finer but more heterogeneous changed significantly. Presented preliminary results offer initial findings that will be systematically investigated in upcoming studies.
Introduction
There is an increasing interest in the identification of magnetic resonance imaging (MRI) biomarkers to rapidly and accurately predict the response of a tumor to therapy. In particular, the apparent diffusion coefficient (ADC-value) and radiomic texture features are considered promising biomarkers for monitoring treatment response in oncology1-10. Various publications have already shown that the ADC-value, as determined from diffusion weighted MRI (DWI), increases with a decrease of tumor cell density caused by the application of radiation therapy (RT)11,12. Further features changing significantly between baseline (pre-RT) and the early treatment phase can create synergies and thus enable an optimized prediction of tumor response. Texture analysis provides a promising tool for discovering new imaging biomarkers to identify changes in tumor during the course of therapy. The texture analysis technique uses mathematical methods to extract features in the image that contain information about the spatial distribution of image intensity-levels and their dependence to one another13,14. The overall purpose of this work was to identify potential texture features as imaging biomarkers for monitoring treatment response in head and neck cancer (HNC). For this, texture features were extracted on segmented calculated ADC maps and compared at baseline and in the early treatment phase. In addition, differences in significant features were compared with the change in the ADC-value over the course of therapy.Materials and Methods
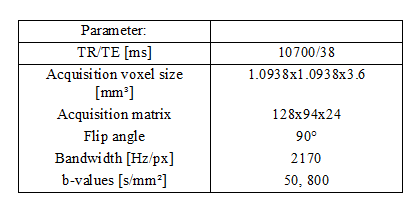
Patient and image acquisitionThe study included eight patients with locally advanced HNC who underwent RT. DWI was performed on a clinical, whole-body 3.0T MR-scanner (MAGNETOM Vida,Siemens Healthcare,Erlangen,Germany) at baseline (examination 1) and during the second week of RT (examination 2). ADC maps derived from DWI were used for the texture analysis described below. The parameterization of the imaging protocol is shown in Table 1.
Segmentation and feature extraction
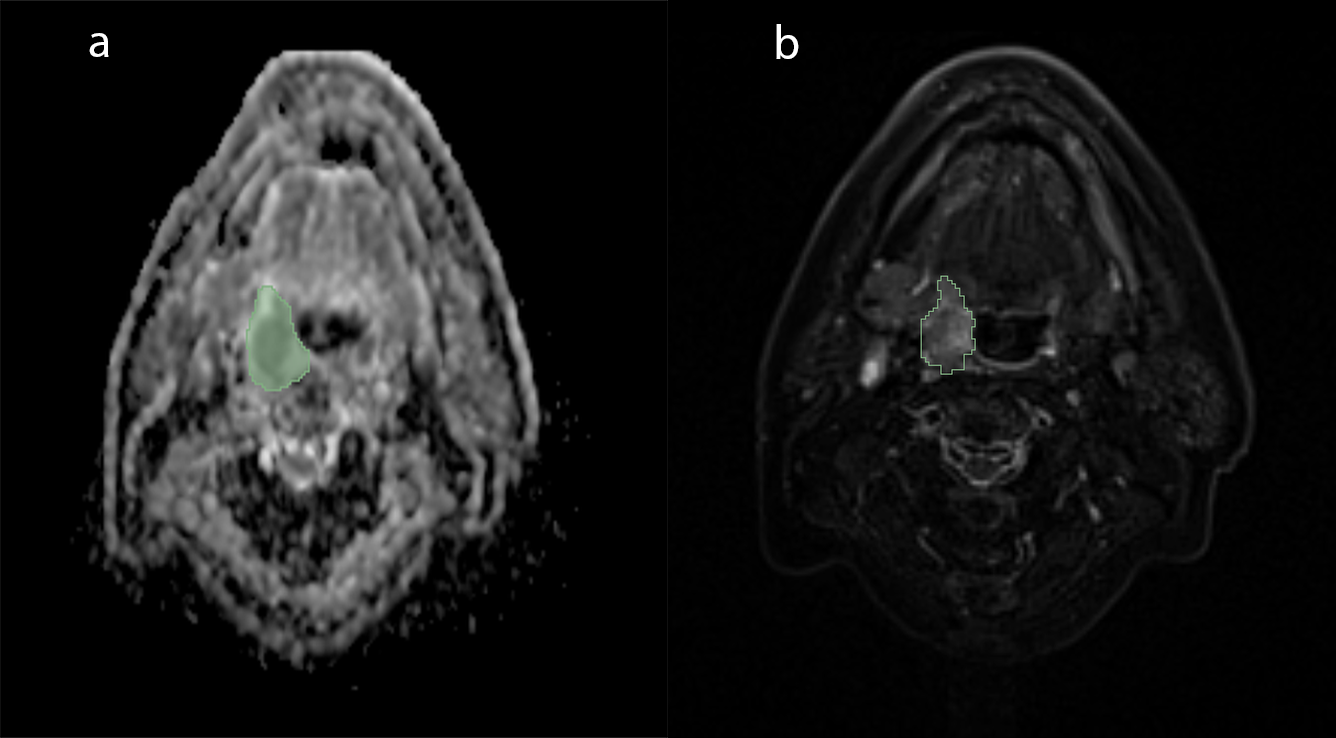
Tumor segmentation was carried out by an experienced radiologist using an open source medical image computing software (3D slicer15,https://www.slicer.org/). For each patient and each examination, the entire tumor volume was manually segmented on calculated ADC maps (Figure1). T2-weighted (T2w) and T1-weighted (T1w) dynamic contrast enhanced images were used as a reference for visual co-registration. Textural feature extraction was performed using the open source python package PyRadiomics16 as a plugin in 3D slicer. A total number of 93 texture features (first order (18), Gray Level Cooccurrence Matrix-(GLCM) (24), Gray Level Run Length Matrix-(GLRLM) (16), Gray Level Size Zone Matrix-(GLSZM) (16), Neighbouring Gray Tone Difference Matrix-(NGTDM) (5), Gray Level Dependence Matrix-(GLDM) (14)) were extracted from each segmented tumor. All features were computed on the original non-normalized ADC maps using a bin width of 25. The definition and mathematical calculation of the texture features can be found on the PyRadiomics documentation site (https://pyradiomics.readthedocs.io/en/latest/features.html).
Statistical analysis
To check whether and to what extent certain texture features change in the course of RT, relative differences in texture between the first and the second examination were calculated using the following formula: Δ(%) = ((feature2,mean - feature1,mean)/feature1,mean) *100%, the indices (1,2) stand for examination 1 (before RT) and examination 2 (second week of RT), respectively. For each feature and each examination, the mean value across all eight patients was considered.
Test on statistically significant differences was applied by using a two-sided Wilcoxon signed-rank test with a significance level of α = 0.05. The same procedure was carried out for the ADC-values of both examinations. All statistical analysis was performed in MATLAB (The MathWorks,Inc.,Natick,MA).
Results and Discussion
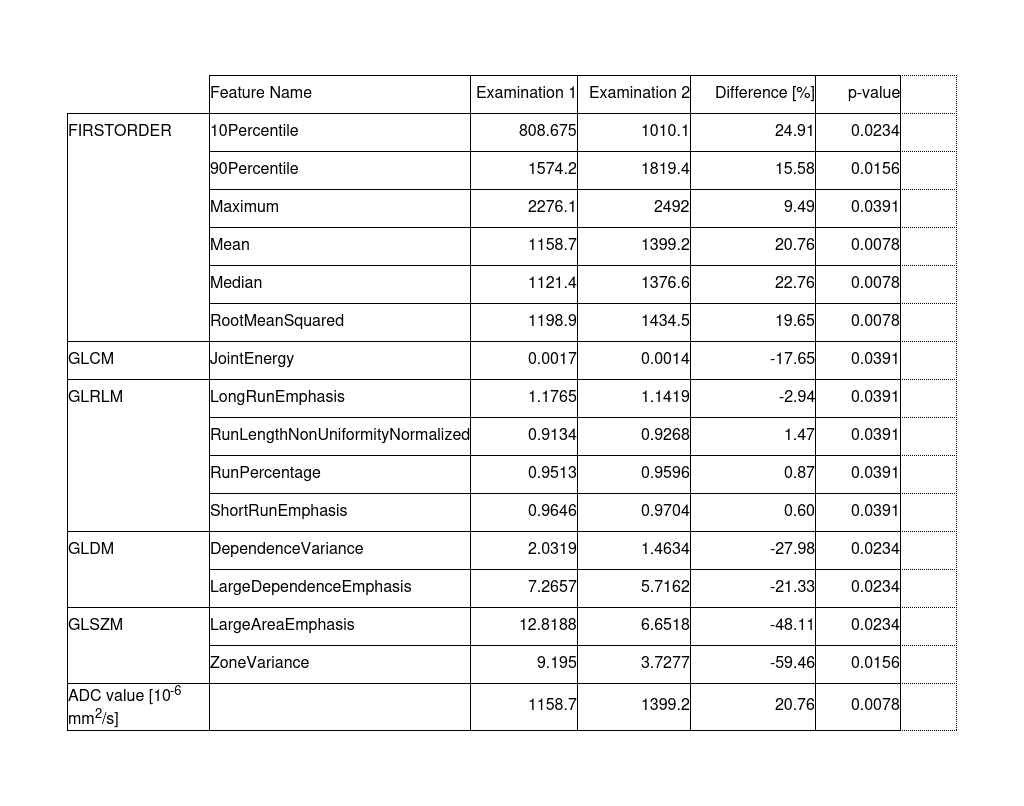
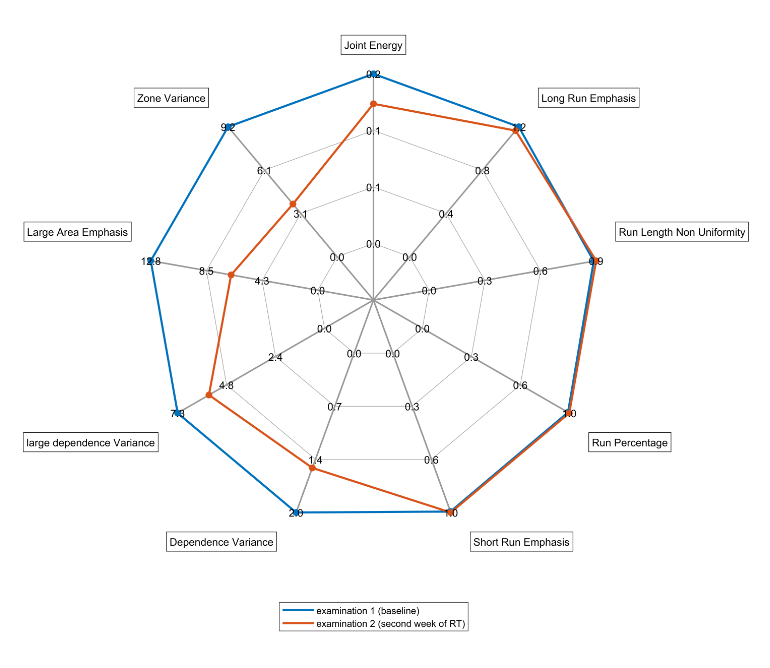
Fifteen texture features in HNC showed a statistically significant difference in the course of RT. Table 2 and Figure 2 illustrate the mean values of each feature and their percentage differences between the two examinations. In addition, the mean ADC-value of both examinations and their percentage difference is given. The ADC-value averaged over all patients increased during RT. There was a mean increase of about 20.75 % (p=0.0078). The First Order texture feature “mean” revealed similar values indicating proper texture analysis settings.The most pronounced changes were found for two texture features from the group of the GLSZM: LargeAreaEmphasis(GLSZM) (-48,1 %;p=0.0234) and ZoneVariance(GLSZM) (-59.5 %;p=0.0156). Since smaller values of these two texture features indicate more fine textures, the significant decrease in the values of both features suggests that texture in HNC became finer over the course of RT. In addition, the texture of HNC seems to become more heterogeneous due to the influence of RT, as highlighted by a decrease of LargeDependenceEmphasis(GLDM) (-21.3 %;p=0.0234), DependenceVariance(GLDM) (-27.9 %;p=0.0234) and JointEnergy(GLCM) (-17.6 %;p=0.0391). Lower values of these texture features indicate less homogeneous patterns in the masked tissue and thus a lower homogeneity of the HNC texture. Other significant texture features, such as GLRLM features, were not analyzed further due to their small differences (Δ(%) < 3%) between the two examinations.
Conclusion
Preliminary results in this work showed that ADC-based HNC texture became finer but more heterogeneous over the course of RT. Percentage changes in the corresponding texture features were comparable to or significantly greater than the change in the ADC-value. Due to the small number of patients, the strength of the preliminary results is limited. Nevertheless, presented results are promising and offer initial findings that will be systematically investigated in upcoming studies with a larger cohort of patients.Acknowledgements
This work was supported and funded by the German Research Foundation (DFG) under Grants SCHI 498/14-1| TH 1528/6-1| NI 707/7-1 (Package No. 997/1).References
1: Dregely I, Prezzi D, Kelly-Morland C, Roccia E, Neji R, Goh V. Imaging biomarkers in oncology: Basics and application to MRI. J Magn Reson Imaging. 2018 Jul;48(1):13-26. doi: 10.1002/jmri.26058. PMID: 29969192; PMCID: PMC6587121.
2: Litvin AA, Burkin DA, Kropinov AA, Paramzin FN. Radiomics and Digital Image Texture Analysis in Oncology (Review). Sovrem Tekhnologii Med. 2021;13(2):97-104. doi: 10.17691/stm2021.13.2.11. Epub 2021 Jan 1. PMID: 34513082; PMCID: PMC8353717.
3: Korte, J.C., Cardenas, C., Hardcastle, N. et al. Radiomics feature stability of open-source software evaluated on apparent diffusion coefficient maps in head and neck cancer. Sci Rep 11, 17633 (2021). https://doi.org/10.1038/s41598-021-96600-4
4: Jethanandani A, Lin TA, Volpe S, Elhalawani H, Mohamed ASR, Yang P, Fuller CD. Exploring Applications of Radiomics in Magnetic Resonance Imaging of Head and Neck Cancer: A Systematic Review. Front Oncol. 2018 May 14;8:131. doi: 10.3389/fonc.2018.00131. PMID: 29868465; PMCID: PMC5960677.
5: Alic L, Niessen WJ, Veenland JF. Quantification of heterogeneity as a biomarker in tumor imaging: a systematic review. PLoS One. 2014 Oct 20;9(10):e110300. doi: 10.1371/journal.pone.0110300. PMID: 25330171; PMCID: PMC4203782.
6: Harry VN, Semple SI, Parkin DE, Gilbert FJ. Use of new imaging techniques to predict tumour response to therapy. Lancet Oncol. 2010 Jan;11(1):92-102. doi: 10.1016/S1470-2045(09)70190-1. PMID: 20129132.
7: Rodrigues A, Loman K, Nawrocki J, Hoang JK, Chang Z, Mowery YM, Oyekunle T, Niedzwiecki D, Brizel DM, Craciunescu O. Establishing ADC-Based Histogram and Texture Features for Early Treatment-Induced Changes in Head and Neck Squamous Cell Carcinoma. Front Oncol. 2021 Sep 2;11:708398. doi: 10.3389/fonc.2021.708398. PMID: 34540674; PMCID: PMC8444263.
8: Brenet E, Barbe C, Hoeffel C, Dubernard X, Merol JC, Fath L, Servagi-Vernat S, Labrousse M. Predictive Value of Early Post-Treatment Diffusion-Weighted MRI for Recurrence or Tumor Progression of Head and Neck Squamous Cell Carcinoma Treated with Chemo-Radiotherapy. Cancers (Basel). 2020 May 14;12(5):1234. doi: 10.3390/cancers12051234. PMID: 32422975; PMCID: PMC7281260.
9: Chang Y, Lafata K, Sun W, Wang C, Chang Z, Kirkpatrick JP, Yin FF. An investigation of machine learning methods in delta-radiomics feature analysis. PLoS One. 2019 Dec 13;14(12):e0226348. doi: 10.1371/journal.pone.0226348. PMID: 31834910; PMCID: PMC6910670.
10: Connolly M, Srinivasan A. Diffusion-Weighted Imaging in Head and Neck Cancer: Technique, Limitations, and Applications. Magn Reson Imaging Clin N Am. 2018 Feb;26(1):121-133. doi: 10.1016/j.mric.2017.08.011. Epub 2017 Oct 14. PMID: 29128000.
11: van Houdt PJ, Yang Y, van der Heide UA. Quantitative Magnetic Resonance Imaging for Biological Image-Guided Adaptive Radiotherapy. Front Oncol. 2021 Jan 29;10:615643. doi: 10.3389/fonc.2020.615643. PMID: 33585242; PMCID: PMC7878523.
12: Thorwarth D, Ege M, Nachbar M, Mönnich D, Gani C, Zips D, Boeke S. Quantitative magnetic resonance imaging on hybrid magnetic resonance linear accelerators: Perspective on technical and clinical validation. Phys Imaging Radiat Oncol. 2020 Oct 17;16:69-73. doi: 10.1016/j.phro.2020.09.007. PM
13: R. M. Haralick, "Statistical and structural approaches to texture," in Proceedings of the IEEE, vol. 67, no. 5, pp. 786-804, May 1979, doi: 10.1109/PROC.1979.11328.
14: R. M. Haralick, K. Shanmugam and I. Dinstein, "Textural Features for Image Classification," in IEEE Transactions on Systems, Man, and Cybernetics, vol. SMC-3, no. 6, pp. 610-621, Nov. 1973, doi: 10.1109/TSMC.1973.4309314.
15: Fedorov A, Beichel R, Kalpathy-Cramer J, Finet J, Fillion-Robin JC, Pujol S, Bauer C, Jennings D, Fennessy F, Sonka M, Buatti J, Aylward S, Miller JV, Pieper S, Kikinis R. 3D Slicer as an image computing platform for the Quantitative Imaging Network. Magn Reson Imaging. 2012 Nov;30(9):1323-41. doi: 10.1016/j.mri.2012.05.001. Epub 2012 Jul 6. PMID: 22770690; PMCID: PMC3466397.
16: van Griethuysen JJM, Fedorov A, Parmar C, Hosny A, Aucoin N, Narayan V, Beets-Tan RGH, Fillion-Robin JC, Pieper S, Aerts HJWL. Computational Radiomics System to Decode the Radiographic Phenotype. Cancer Res. 2017 Nov 1;77(21):e104-e107. doi: 10.1158/0008-5472.CAN-17-0339. PMID: 29092951; PMCID: PMC5672828.
Figures