1332
Optimization of GLCM Texture Analysis settings in Liver Radial T2 Maps: Fibrotic vs Healthy Liver1Department of Biomedical Imaging and Image-Guided Therapy, Medical University Vienna, Vienna, Austria, 2Christian Doppler Laboratory for Clinical Molecular Imaging, MOLIMA, Vienna, Austria, 3Division of Endocrinology and Metabolism, Department of Medicine III, Medical University Vienna, Vienna, Austria
Synopsis
GLCM texture analysis is a promising technique for characterizing and classifying tissue pathologies. In liver applications it has been mostly performed on T2-weighted images. Fast radial T2 mapping techniques enable acquiring T2 maps in clinically feasible measurement time (during breath-hold). Here, we explored the performance of the different settings of GLCM texture analysis in liver T2 maps, which might be more advantageous compared to T2-weighted images. We identified the grey-level quantization of 8bits and direction of 90° as the best setting for discrimination between fibrotic and healthy livers.
Introduction
T2 mapping of a tissue is an MRI technique providing information about pathological status of a tissue. Even-though, liver T2 mapping has been proposed to be a marker of hepatic fibrosis and inflammation [1], long scan times precluded wide applications in clinical settings. Recently, radial turbo-spin-echo (rTSE) acquisition schemes provided good-quality T2 maps with high spatial resolution within a breath-hold period. This enables to integrate T2 mapping in the clinical measurements and to scrutinize their asset in clinical decisions [2].There have been several studies employing texture analysis on T2-weighted MR images of liver with promising results [3-5], but potential advantage of T2 mapping over T2 weighted imaging are: 1. lower influence of measurement parameters allows for data and result comparison between different centers and 2. Elimination of image inhomogeneity caused by imperfections of the B0 and B1 homogeneity, which is especially problematic for large organs, given the T2 value is an absolute measure of a signal. The additional benefit of rTSE T2 mapping technique is high in-plane resolution which improves the texture-based classification.
Grey-level co-occurrence matrix (GLCM) is a texture analysis method which examines the spatial relationships of pixels. The crucial step for data analysis and population discrimination is proper selection of calculated GLCM features which needs to be tailored to specific application [6].
Therefore, the goal of this study was to calculate and compare the GLCM features of rTSE acquired liver T2 maps between healthy controls and patients with advanced fibrosis with different GLCM calculation settings, and to analyze the influence of parameter settings for the discrimination.
Materials and methods
All measurements were performed on a 3T PrismaFit Siemens system (Siemens Healthcare, Erlangen, Germany) equipped with an 18-channel body coil and a 30-channel body coil and 32-channel spine coil. A list of 116 patients that underwent MR abdomen examination with rTSE T2 mapping sequence (parameters: TR = 1500ms, ETL = 29, TE range = 9.2 – 266ms, echo-spacing = 9.2ms, FOV 400x400 mm2, matrix size = 256x256, radial views = 290, FA = 180°, slice thickness = 6mm, number of slices = 5, time of acquisition = 17sec, with fat-suppression applied) and 2D SE-EPI MRE examination (parameters: TR/TE = 1000/47msec, FOV = 380 x 380, matrix = 256 x 256 (acquired 100 x 100), slice thickness = 8mm, number of slices = 4, breath-hold time = 11sec) was given. Patients with advanced fibrosis in radiological report and successful MRE examination with stiffness > 3 kPa were selected (26). Patients with degraded T2 map quality (7) and suspected iron overload (7) were excluded, which yielded 12 patients in total.Regions of interest (ROIs) covering whole transversal cross-section of the liver were manually selected in Slicer3D [7] on the slice with biggest liver coverage and with no streaking artifacts. Large vessels were excluded with LevelTracing algorithm. ROIs were subsequently transferred to Matlab, where the computation of GLCM together with 20 features was carried out [8]. Prior to that, ±3σ normalization was performed [9]. The GLCM computation was calculated for 4 different angles (0°, 45°, 90°, 135°) with fixed distance of 1 pixel, and for 5 different grey-quantization-levels (8, 16, 32, 64, 128), yielding 20 different settings for GLCM feature computation per subject.
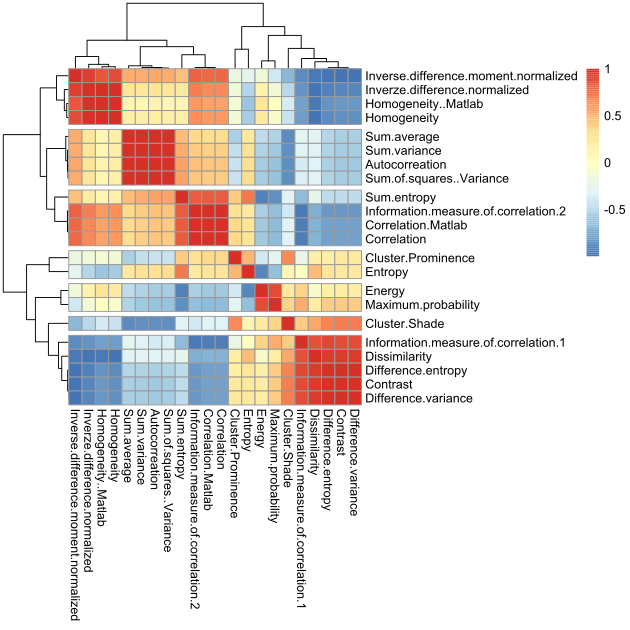
Statistical analysis of the data was performed in RStudio. The features of two groups (healthy vs fibrotic) were compared for each GLCM computation setting separately with Mann-Whitney U test. The highest number of statistically significant features was considered as the most discriminatory setting. To find the features that are correlated, clustered heatmap was assessed.
Results
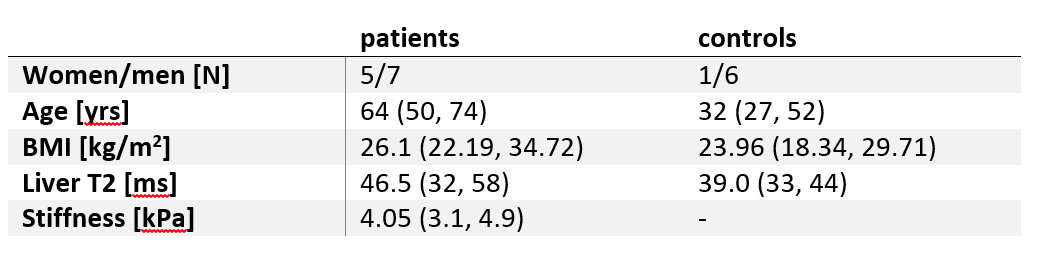
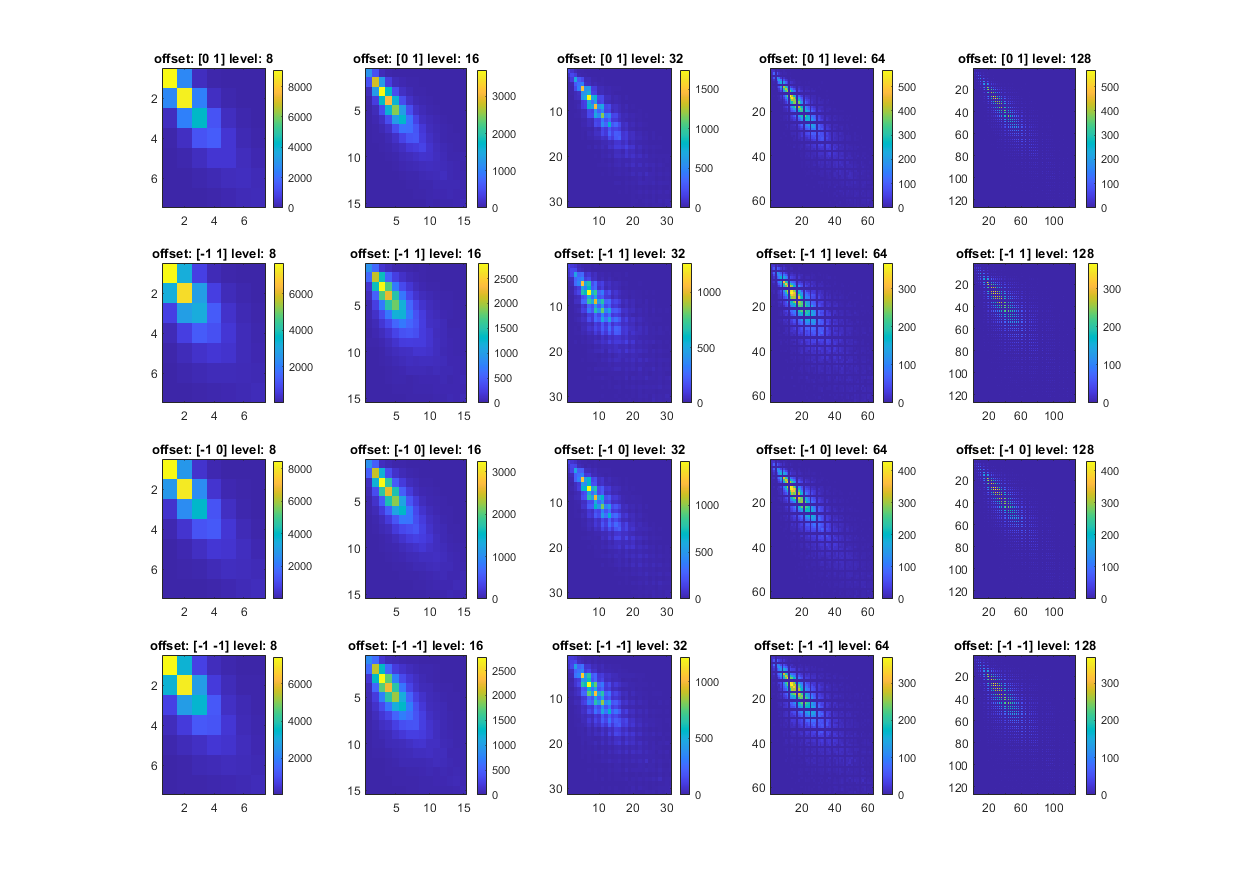
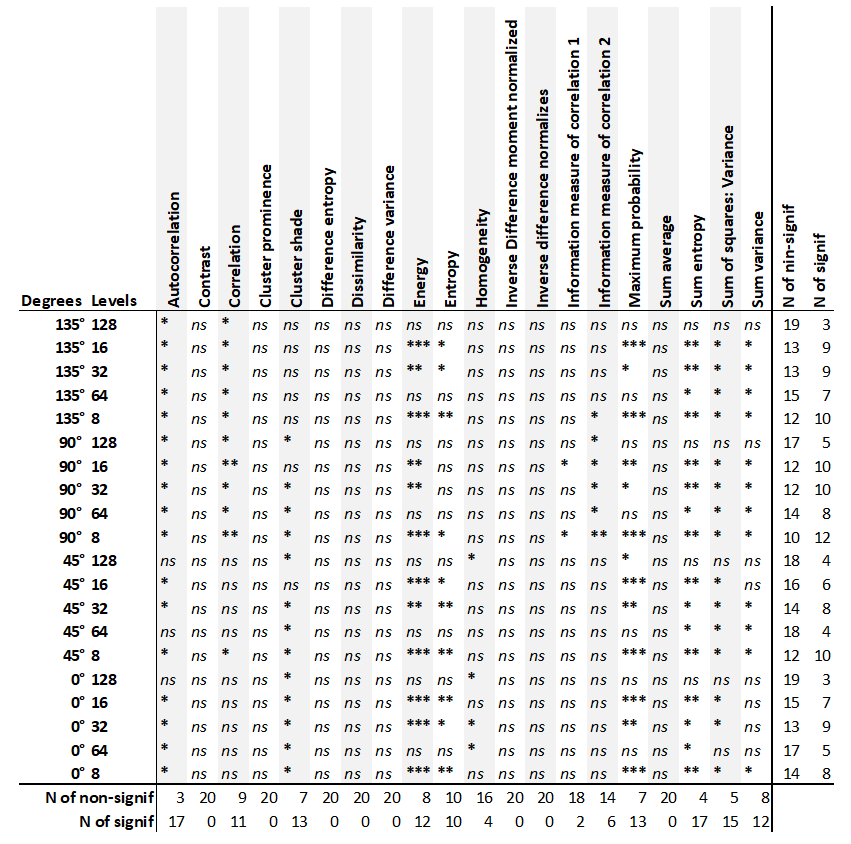
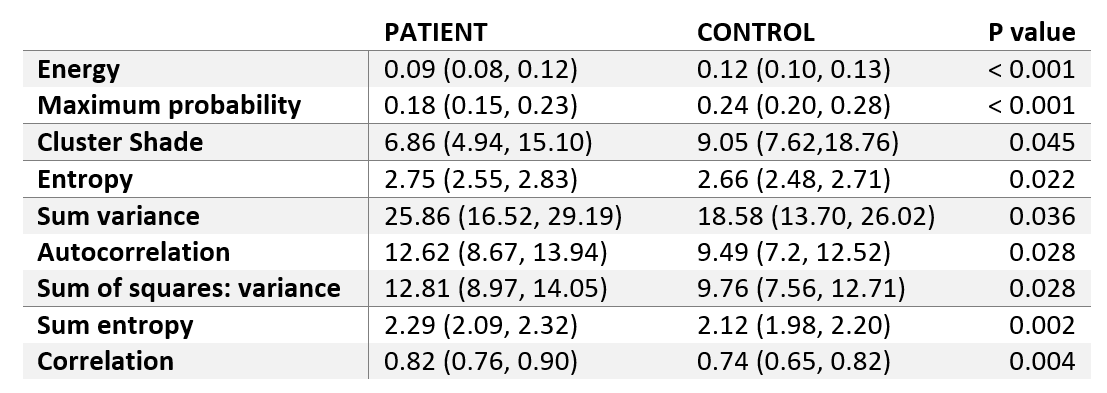
Patient and healthy control characteristics and T2 values are summarized in table 1. The mean T2 values of fibrotic patients were significantly different from healthy controls (p = 0.0196), but we have observed significant overlap between these two groups.An example of GLCM computation in a control for each setting is depicted in Figure 1. The number of statistically significantly different features for each setting is summarized in Table 2. Generally, grey-level quantization of 8 yielded the highest number of statistically significant features (except for the 0°), and the direction of 90° gave the highest number of significant features, yielding the setting of 90° and 8bit grey-level quantization to be the best setting. The comparison between the groups and the heatmap of the features for 90° and 8bit grey-level quantization is depicted in Table 3 and Figure 2, respectively.
Discussion
Even though there is statistically significant difference in T2 values between fibrotic and healthy livers, it doesn’t have sufficient discriminatory power. GLCM texture analysis might provide additional discrimination. The grid in 64 and 128bit in Fig.1 in our results suggest that the grey-level-quantization is too large. Decreasing the number of grey-levels to 32 and below improved the discrimination ability of some features. The dependence on the choice of direction was observed in cluster shade and correlation. These preliminary results will be used for further analysis on larger datasets of patients, which will be further used to build classification models.Conclusion
For the GLCM texture analysis of liver T2 maps, the best setting for computation is the grey-level quantization of 8bits in the direction of 90°.Acknowledgements
No acknowledgement found.References
1. Guimaraes AR, Siqueira L, Uppal R et al (2016) T2 relaxation time is related to liver fibrosis severity. Quantitative Imaging in Medicine and Surgery 6:103-114
2. D Bencikova, F Han, S Kannengieser, M Raudner, S Poetter-Lang, N Bastati,G. Reiter, A Ba-Ssalamah, S Trattnig, M Krššák (2021) Evaluation of a single-breath-hold radial turbo-spin-echo sequence for T2 mapping of the liver at 3T. Accepted to Eur J Radiol
3. House MJ, Bangma SJ, Thomas M et al (2015) Texture-Based Classification of Liver Fibrosis Using MRI. Journal of Magnetic Resonance Imaging 41:322-328
4. Jirak D, Dezortova M, Taimr P, Hajek M (2002) Texture analysis of human liver. Journal of Magnetic Resonance Imaging 15:68-74
5. Song JJ, Yu XL, Song WL et al (2020) MRI-Based Radiomics Models Developed With Features of the Whole Liver and Right Liver Lobe: Assessment of Hepatic Inflammatory Activity in Chronic Hepatic Disease. Journal of Magnetic Resonance Imaging 52:1668-1678
6. Andrés Larroza VBaDM (2016) Texture Analysis in Magnetic Resonance Imaging: Review and Considerations for Future Applications, , Assessment of Cellular and Organ Function and Dysfunction using Direct and Derived MRI Methodologies. IntechOpen
7. Fedorov A, Beichel R, Kalpathy-Cramer J et al (2012) 3D Slicer as an image computing platform for the Quantitative Imaging Network. Magnetic resonance imaging 30:1323-1341
8. Uppuluri A (2021) GLCM texture features (https://www.mathworks.com/matlabcentral/fileexchange/22187-glcm-texture-features), MATLAB Central File Exchange. Retrieved November 10, 2021. [online]
9. Collewet G, Strzelecki M, Mariette F (2004) Influence of MRI acquisition protocols and image intensity normalization methods on texture classification. Magnetic resonance imaging 22:81-91
Figures