1331
Assessing Inter-Observer Variability of MRI Tagging of the Colon Contents in Healthy Human Subjects
Meshari T Alshammari1,2, Ali S Alyami3, Victoria Wilkinson-Smith3, Luca Marciani1, Gordon W. Moran1, and Caroline L. Hoad3,4
1Translational Medical Sciences and National Institute for Health Research (NIHR) Nottingham Biomedical Research Centre, Nottingham University Hospitals NHS Trust and University of Nottingham, Nottingham, United Kingdom, 2Department of Diagnostic Radiology, College of Applied Medical Sciences, University of Hail, Hail, Saudi Arabia, 3NIHR Nottingham Biomedical Research Centre (BRC), Nottingham University Hospitals NHS Trust and University of Nottingham, Nottingham, United Kingdom, 4Sir Peter Mansfield Imaging Centre, School of Physics and Astronomy, University of Nottingham, Nottingham, United Kingdom
1Translational Medical Sciences and National Institute for Health Research (NIHR) Nottingham Biomedical Research Centre, Nottingham University Hospitals NHS Trust and University of Nottingham, Nottingham, United Kingdom, 2Department of Diagnostic Radiology, College of Applied Medical Sciences, University of Hail, Hail, Saudi Arabia, 3NIHR Nottingham Biomedical Research Centre (BRC), Nottingham University Hospitals NHS Trust and University of Nottingham, Nottingham, United Kingdom, 4Sir Peter Mansfield Imaging Centre, School of Physics and Astronomy, University of Nottingham, Nottingham, United Kingdom
Synopsis
MRI Tagging techniques have been applied to the GI tract to assess bowel contractions and colon content mixing. Two independent datasets of healthy adults were used to evaluate the dependence of the percentage Coefficient of variation (%CoV) measurement on inter-observer variability in the ascending colon and descending colon. There was little difference between both AC and DC measurements of the %CoV with high inter-rater agreement (intra-class correlation coefficient > 0.95). This technique could be used to provide objective measures for the motility assessment of the colon in inflammatory and functional bowel diseases.
Introduction
Assessments of motility of the large bowel using magnetic resonance imaging (MRI) are being rapidly developed. MRI tagging is routinely used to assess cardiac function, however MRI Tagging techniques have been applied to the GI tract to assess bowel contractions1 and content mixing2. Pritchard’s method assessed the colonic contents mixing by observing the signal intensity changes through time measured from a tagged cine MRI acquisition showing significant differences between healthy and constipated subjects. The aim of this study was to evaluate the dependence of this measurement on inter-observer variability in both the ascending colon (AC) and descending colon (DC).Methods
Two independent datasets of healthy adults were used, Study 1 (unpublished data): following a 1L mannitol drink including 13 datasets from 10 subjects and Study 23: following a 0.5-1L Moviprep® drink including 31 datasets from 8 subjects. All studies were approved by the local Research Ethics Committees. Colonic tagging data was acquired on a 3T Ingenia wide-bore scanner (Philips, Best, The Netherlands) using a single sagittal oblique 15 mm slice cine balanced turbo field echo (bTFE) acquisition, placed either over the AC or DC with 33 frames acquired in a 20 sec breath-hold. Dark horizontal strips (tag lines) were 12 mm apart (FOV= 330 x 259 mm2; resolution = 0.98 x 0.98 mm2; FA = 45°). The mean and the standard deviation (STDEV) maps (figure 1A) were generated pixel-by-pixel using a custom-written software2 in MATLAB. The colonic regions of interest (ROIs) were defined (figure 1B) using MIPAV software4 using the mean map as the reference image. Two observers for each study independently defined the ROIs and the resulting coefficient of variation (CoV) defined as: ROI signal stdev map*100/ROI signal mean map was calculated. Bland-Altman plots and scatter plots with the identity line were used to visualise the data. Inter-rater reliability analysis was conducted using SPSS and estimated with a 2-way mixed-model, absolute agreement intraclass correlation coefficient (ICC) with a 95% confidence level. Interpretation of ICC inter-rater agreement measures was following the Koo, T. K et al. guidelines5: below 0.50: poor, between 0.50 and 0.75: moderate, between 0.75 and 0.90: good, above 0.90: excellent.Results
Scatter plots (figures 2) and Bland-Altman plots (figures 3) showed a large range of data with low variation and small limits of agreements (<5% CoV). The ICC of inter-rater reliability of Study 1 (N=13) was excellent; 0.97 (95% CI, 0.93-0.99) for the AC measurements, 0.98 (95% CI, 0.92-0.99) for the DC measurements. The ICC of inter-rater reliability of Study 2 (N=31) was excellent; 0.97 (95% CI, 0.94-0.98) and 0.98 (95% CI, 0.96-0.99) for the AC measurements and the DC measurements, respectively.Discussion and conclusion
MRI tagging can provide an assessment of colonic content mixing. The analysis approach using the CoV described here provided excellent agreement between the measurements carried out by two different trained observers. There was little difference between both AC and DC measurements of the colonic tagging CoV with high inter-rater agreement. These results add further validation data to previous research3 which demonstrated the test-retest accuracy of MR tagging technique to assess the colonic content mixing. This non-invasive technique could be used to provide objective measures for the motility assessment of the colon in both inflammatory and functional bowel diseases. Future work should investigate and confirm the reliability of acquiring this technique in larger cohorts of both healthy participants and patients.Acknowledgements
No acknowledgement found.References
- van der Paardt MP, Sprengers AM, Zijta FM, Lamerichs R, Nederveen AJ, Stoker J. Noninvasive automated motion assessment of intestinal motility by continuously tagged MR imaging. J Magn Reson Imaging. 2014;39(1):9-16.
- Pritchard SE, Paul J, Major G, et al. Assessment of motion of colonic contents in the human colon using MRI tagging. Neurogastroent Motil. 2017;29(9).
- Wilkinson-Smith V, Menys A, Bradley C, et al. The MRI colonic function test: Reproducibility of the Macrogol stimulus challenge. Neurogastroenterol Motil. 2020;32(11):e13942.
- McAuliffe M, Lalonde F, McGarry DP, Gandler W, Csaky K, Trus B. Medical Image Processing, Analysis & Visualization in Clinical Research. Vol 142001.
- Koo TK, Li MY. A Guideline of Selecting and Reporting Intraclass Correlation Coefficients for Reliability Research. Journal of Chiropractic Medicine. 2016;15(2):155-163.
Figures
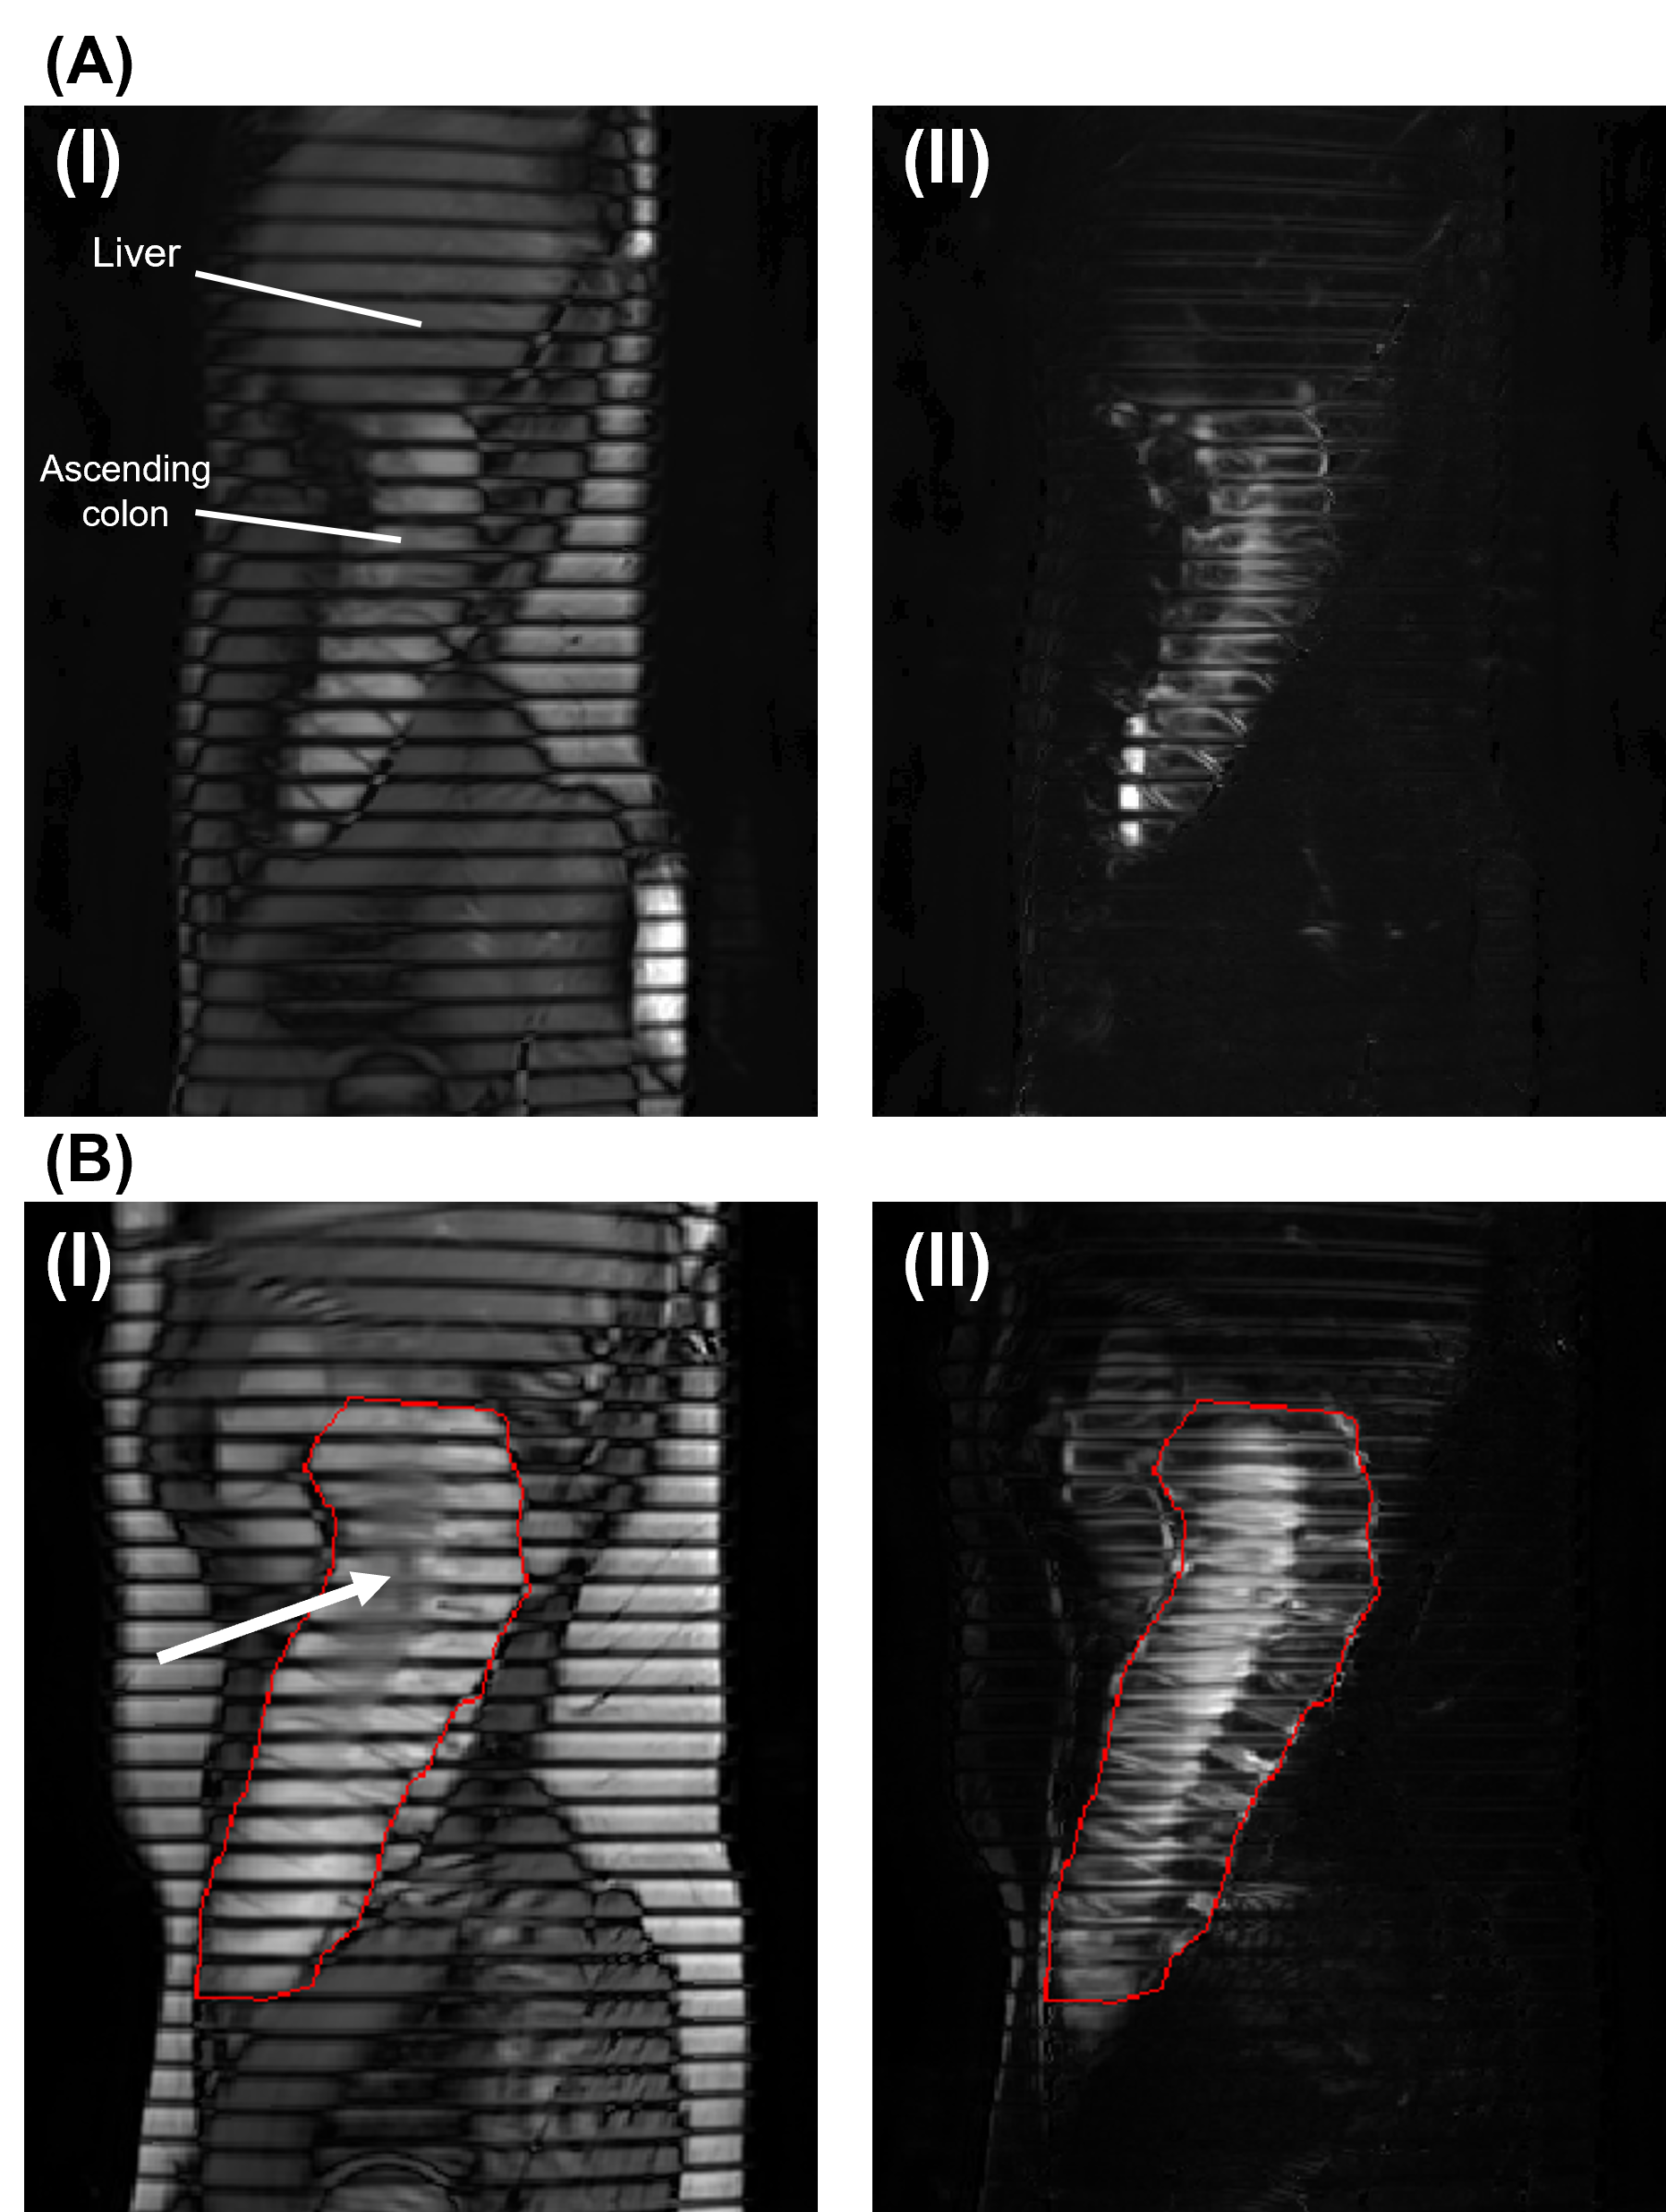
Figure 1: (A) Maps of an ascending colon (sagittal oblique images) after applying tag lines (dark horizontal stripes across the image), (i) Mean pixel intensity map (with anatomical labels), (ii) Corresponding pixel standard deviation (STDEV) map. Bright signal on the STDEV map indicates variable signal through time, arising from mixing and movement of the contents. (B) An ascending colon region of interest (ROI) is outlined in red for both mean (i) and STDEV (ii) maps. A visible smearing of the tags is highlighted (white arrow) which corresponds to motion/mixing of the AC contents.
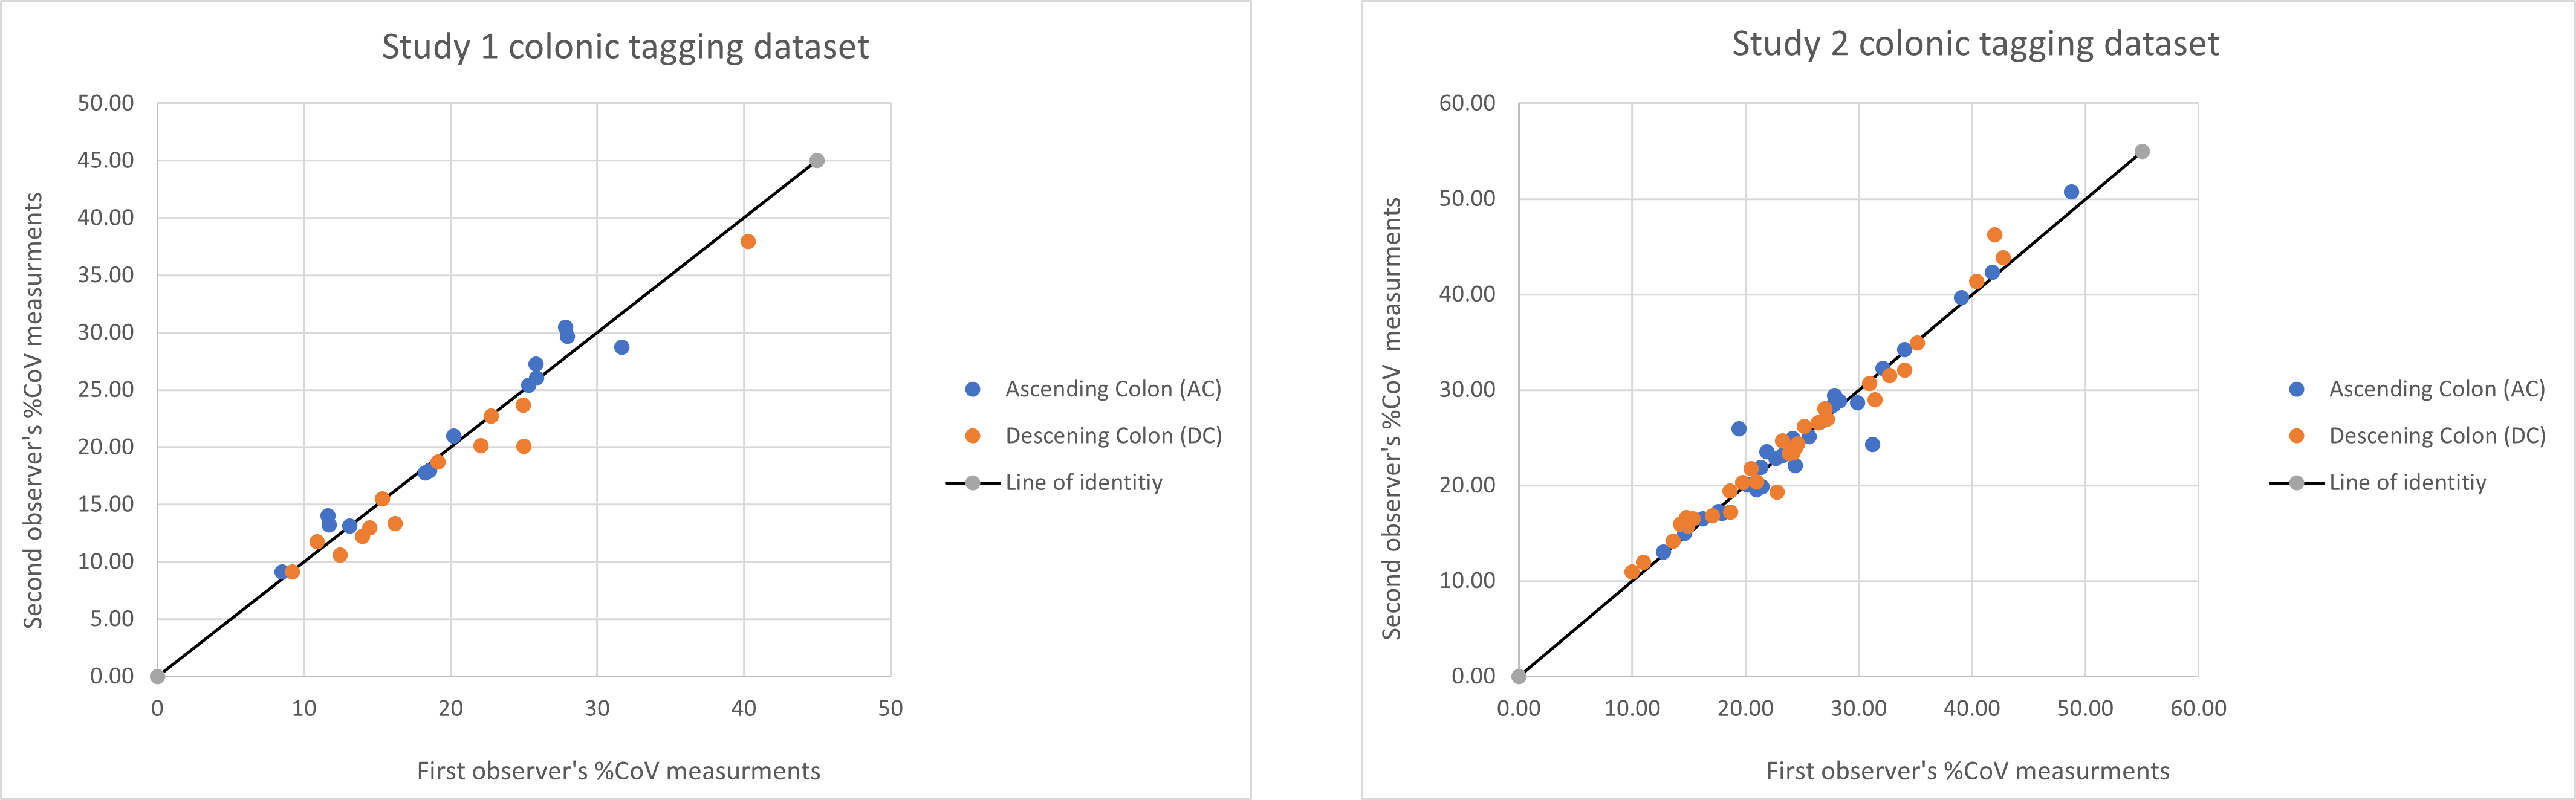
Figure 2: Scatter plot for Study 1 and Study 2 colonic tagging datasets, with identity line.
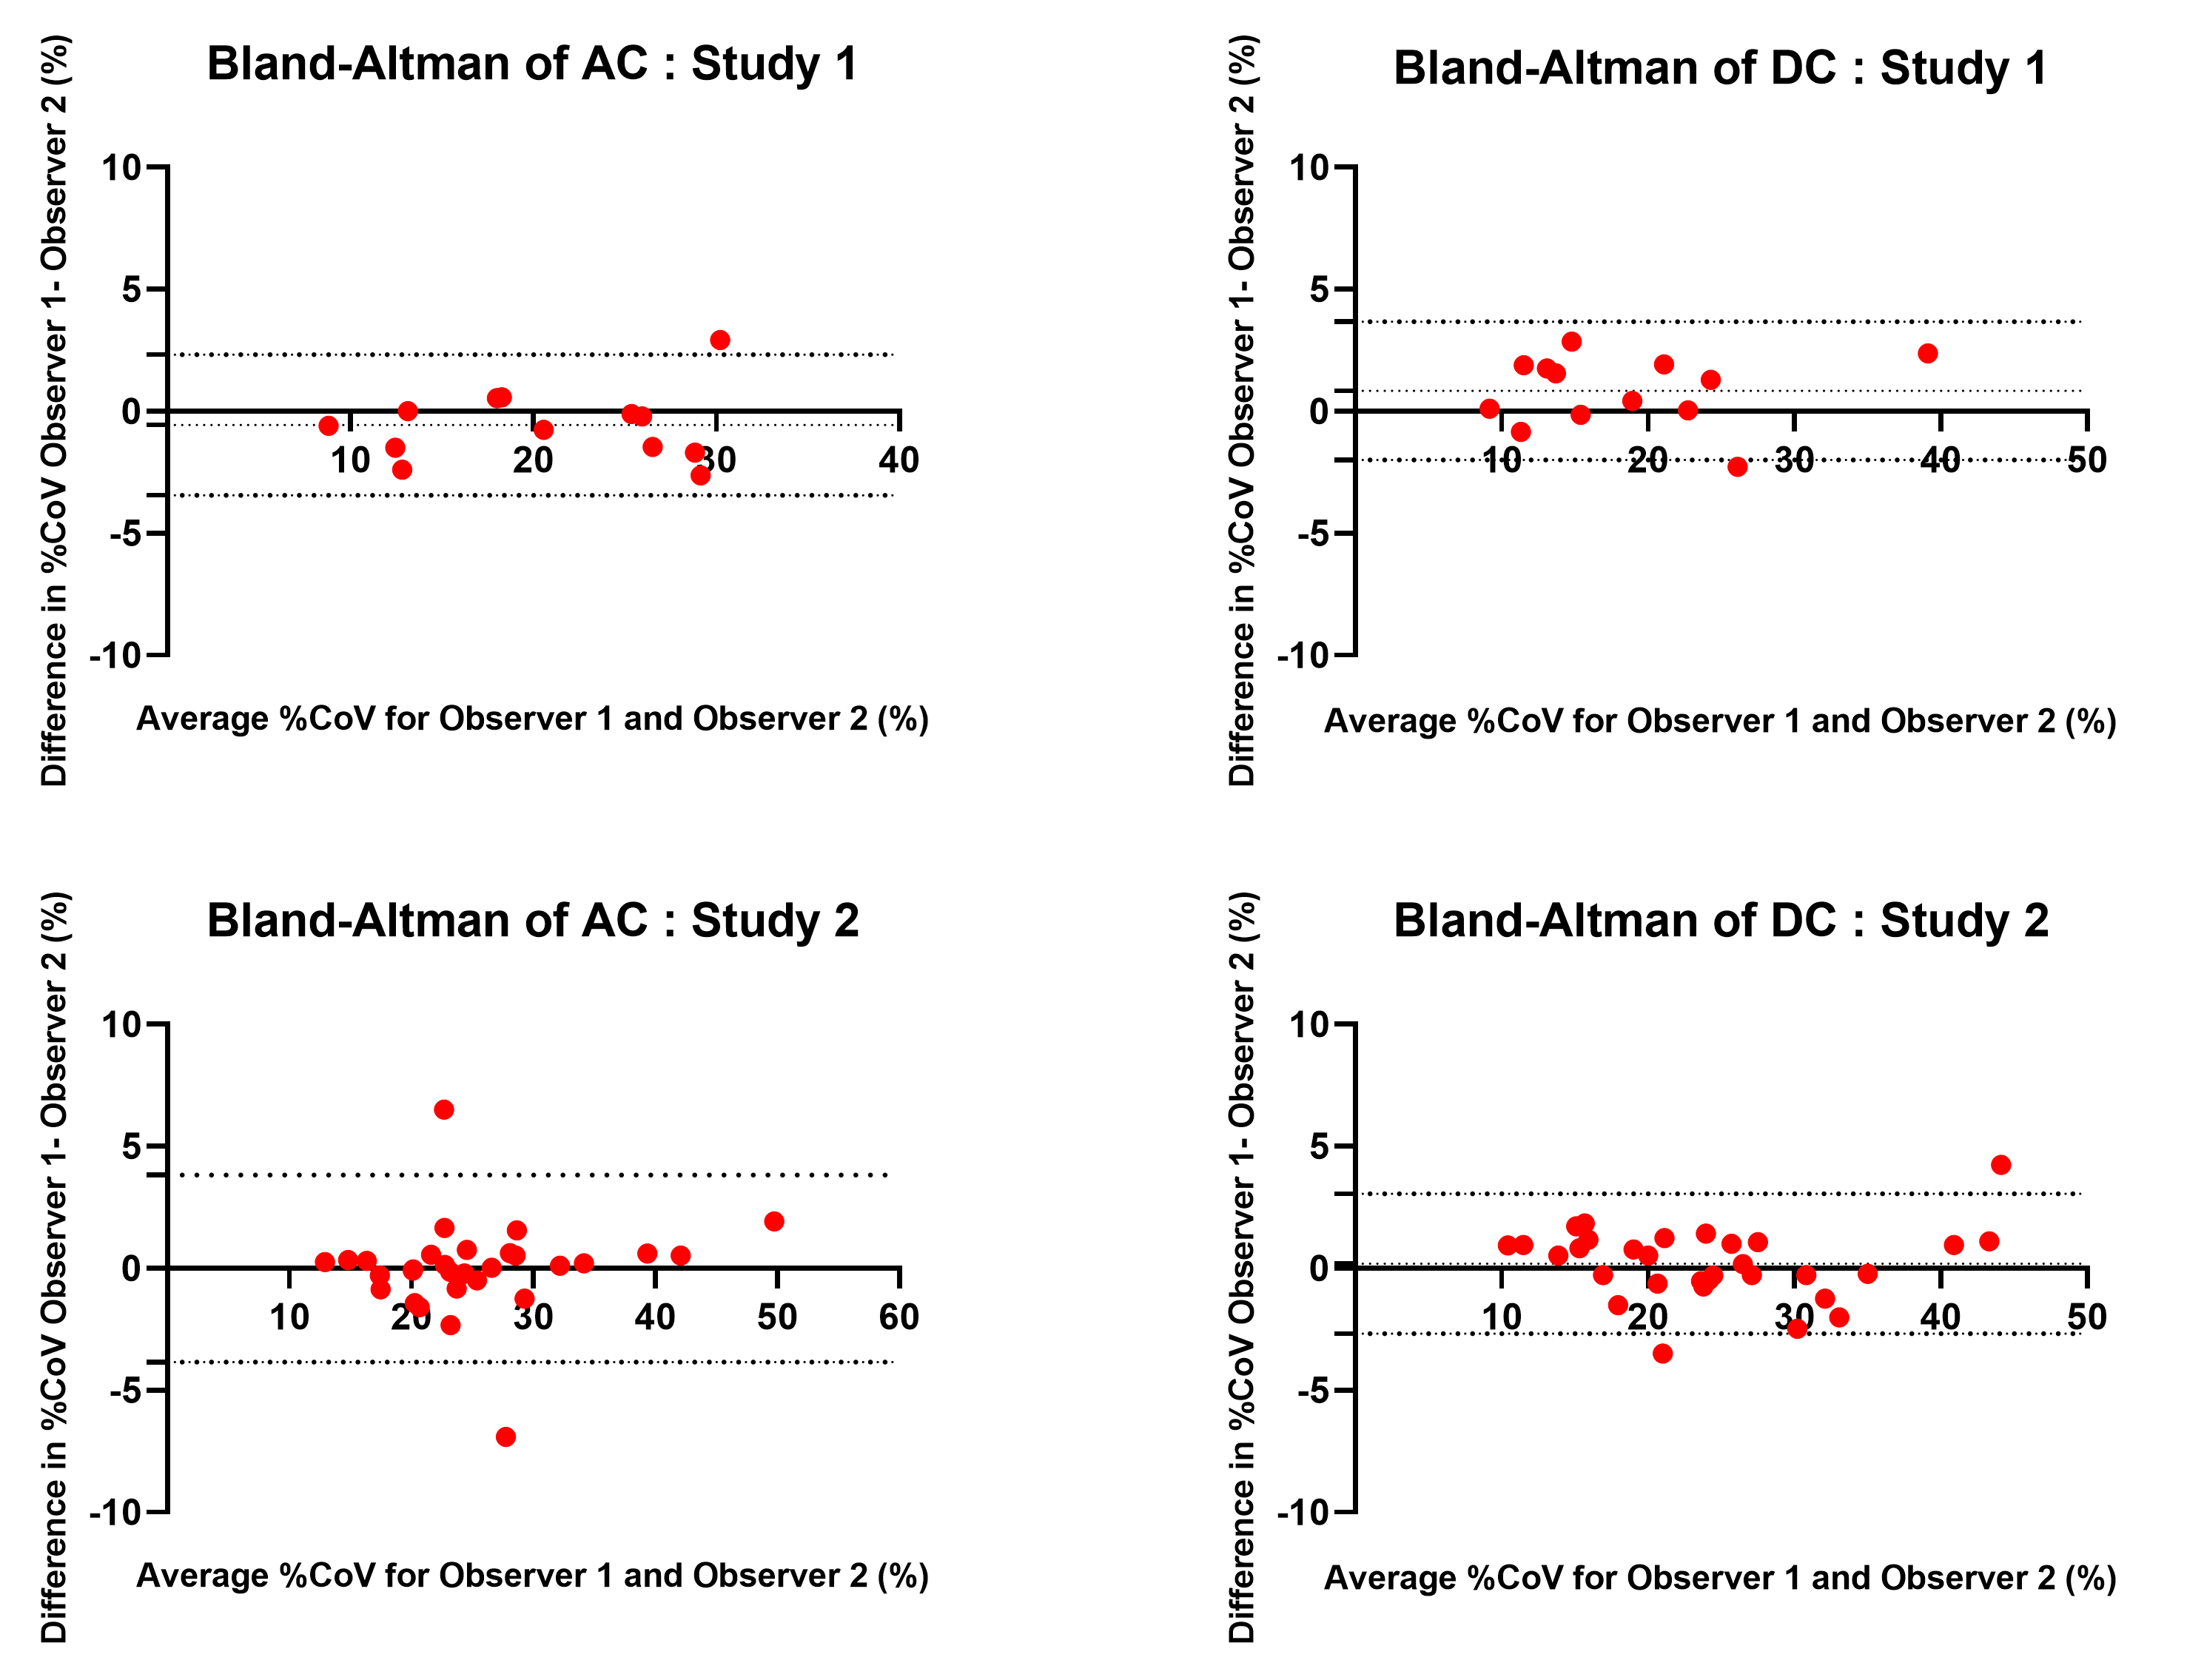
Figure 3: Bland-Altman plots for Study 1 and Study 2 colonic tagging datasets which describe agreement between two the measurements separately for ACs and DCs. They show difference vs average with dotted lines representing bias and 95% limits of agreement.
DOI: https://doi.org/10.58530/2022/1331