1325
Structural Brain Changes during Early Development in Non-human Primate, Common Marmoset: A Longitudinal MRI study
Akiko Uematsu1,2, Junichi Hata3, Makoto Fuskushima1, Noriyuki Kishi2, Ayako Muyarama2, Takuya Hayashi1, and Hideyuki Okano2,4
1BDR Laboratory for Brain Connectomics Imaging, RIKEN, Kobe, Japan, 2CBSLaboratory for Marmoset Neural Architecture, RIKEN, Wako, Japan, 3Graduate School of Human Health Sciences, Tokyo Metropolitan University, Tokyo, Japan, 4Department of Physiology, Keio University School of Medicine, Tokyo, Japan
1BDR Laboratory for Brain Connectomics Imaging, RIKEN, Kobe, Japan, 2CBSLaboratory for Marmoset Neural Architecture, RIKEN, Wako, Japan, 3Graduate School of Human Health Sciences, Tokyo Metropolitan University, Tokyo, Japan, 4Department of Physiology, Keio University School of Medicine, Tokyo, Japan
Synopsis
Neuronal brain development at early life stage is critical for proper function at later life stages. Here, we delineate the maturational process of marmoset brain structure in both macro and micro level at very early life stage with longitudinal multi-modal MRI images. Integrating multi-modal MRI images provided more detailed and accurate information of changes in tissue property especially for frontal brain regions throughout development than a single-modal image analysis.
Introduction
Proper brain development at early life stage is crucial for well-being and cognitive function at later life stages. Nevertheless, the detailed biological process of brain development has been largely veiled due to practical and technical limitations of in-vivo imaging. Use of a small non-human primate, common marmoset (Callithrix jacchus) in developmental biology may benefit from its early maturity and prolific breeder, living in family group with both maternal and paternal caregiving like human beings1.Here, using an ultra-high field MRI technique, we examine in-vivo longitudinal changes of the brain microstructure of marmosets during a half year of their life, which corresponds to human's first 2 years of life.Methods
A total of 75 time points of structural brain data were acquired from normally developing 13 marmosets using a 9.4T animal MRI scanner (Biospec 94/30, Bruker BioSpin: Germany). All experimental procedures were approved by the Experimental Animal Committee of RIKEN (Approval number H29-2-244). The structural data included multi-modal imaging with T1 weighted (T1w), T2 weighted (T2w), and diffusion-weighted MRI (dMRI) data to examine gray and white matter macro and microstructure, acquired with the following sequences: T1w with 3D MDFE (TR/TE = 6000 ms/2.0 ms, resolution= 0.27x0.27x0.54 mm3), T2w with RARE (TR/TE = 4000 ms/11.0 ms, resolution=0.27x0.27x0.54 mm3), dMRI with a multi-shot (four shots) EPI (TR/TE = 3000 ms/25.57 ms, resolution=0.35x0.35x0.70, 30 diffusion directions at b = 1000 s/mm2 with two b = 0 s/mm2 and two opposing phase encoding b = 0 s/mm2). T1w and T2w images were analyzed by optimized protocols of inhomogeneity corrections, automated parcellations, and cross-subject registrations by adapting non-human primate version of the human connectome project (NHP-HCP) pipelines2,3 with FreeSurfer version 7.1. In addition, we referred Hashikawa atlas parcellation4, which is recreated with joint label fusion technique5 to better fit for marmoset MRI brain at each developmental stage. dMRI was preprocessed with MRtrix3, including denoise, degibss, distortion correction, and bias field correction.Results
The intracranial volume in marmoset increased nonlinearly from 2 weeks (6392±788 mm3) to 6 months (9503±624 mm3) (Figure 1), whereas body weight were linearly increased from 45.8 ± 4.5 g to 278.0 ± 53.9 g. Such a nonlinear pattern was also observed in mean FA whereas mean MD values decreased nonlinearly in whole white matter. In particular, the periods from birth to 2 months old at macrolevel (volume) and to 1 month old at micro level (DTI values) were most evident in growth rate, but the growth patterns were heterogenous across brain regions. The developmental patterns were similar among siblings, and body weight (nutrient conditions) also seemed another factor for individual volume difference during that period.We also delineated the maturational process qualitatively. T1w and T2w images revealed robust changes in morphometry and contrast of gray and white matter during first half year of life (Figure 2). At the earlier age, the contrast of T2w image depicted higher intensity in white matter except posterior limbs of internal capsule whereas that of T1w image was lower in the whole brain, except a part of frontal regions. Mean diffusivity (MD) reduces its values of the frontal regions including gray and white matter areas along with development.
Discussions
The contrast changes in T1w and T2w images during development suggested the postnatal white matter maturational process begins from internal capsule, which contains very long tracts including corticospinal motor and sensory fibers followed by changes in the long tracts within cerebrum including visual radiations, longitudinal and interhemispheric callosal fiber tracts. The volume increases in the motor and sensory regions in the early marmosets may be associated with increase of fibers, neuropils, arborization and myelination, possibly adapting perceived external stimuli like parent’s call and keeps clinging to their caregivers. The frontal regions are yet immature at 6 months old. However, its developmental changes of T1w and MD contrast suggested that microstructure became dense from sparse via dendric arborizations, synaptogenesis, increment of glial cells, and the enlargement of neuronal soma in gray matter and increase of the diameter or the number of fiber bundles and myelination in white matter, but further investigation is needed by comparing histology.Noted that image processing of premature marmoset brain is technically challenging, which is also the case with human infant and child data6. Thus, further tuning of MRI data analysis in the current data may be required to find the specific changes associated with brain development and social behavior and fully understand the usefulness of this animal as a model of brain development and disorders.
Acknowledgements
This study was supported by the program for Brain Mapping by Integrated Neurotechnologies for Disease Studies (Brain/MINDS) [grant number 15653395] and Brain/MINDS Beyond [grant number: JP21dm0307006] from the Japan Agency for Medical Research and development (AMED)References
- H. Okano. "Current status of and perspectives on the application of marmosets in neurobiology." Annual Review of Neuroscience 44 (2021)
- M.F.Glasser., et al. "The minimal preprocessing pipelines for the Human Connectome Project." Neuroimage 80 (2013): 105-124
- T. Hayashi, et al. "The nonhuman primate neuroimaging and neuroanatomy project." NeuroImage 229 (2021)
- A. Woodward, et al. "The Brain/MINDS 3D digital marmoset brain atlas." Scientific data 5.1 (2018): 1-12
- H. Wang, et al. "Multi-atlas segmentation with joint label fusion." IEEE transactions on pattern analysis and machine intelligence 35.3 (2012)
- 1. Howell, Brittany R., et al. "The UNC/UMN Baby Connectome Project (BCP): An overview of the study design and protocol development." NeuroImage 185 (2019): 891-905.
Figures
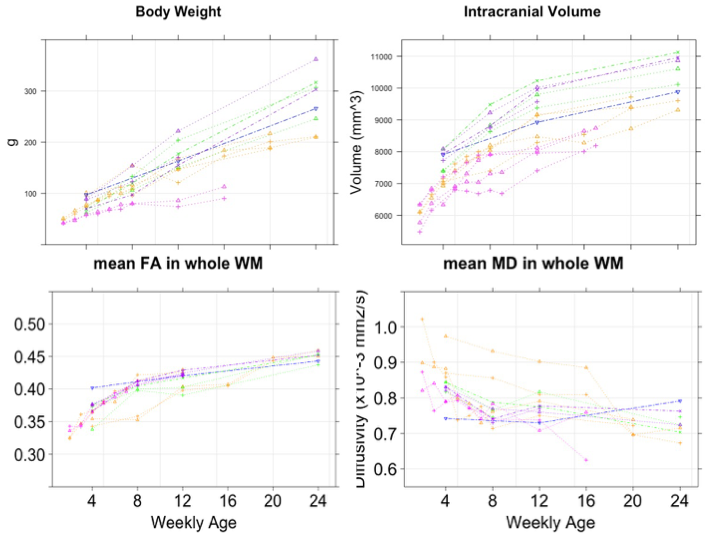
Developmental trajectories of body weight and intracranial volume in marmoset from 2 weeks to 6 months old.
Each individual trajectory is drawn with spaghetti plots. The same-colored line means the same kin family and the same point shape is the litter mates
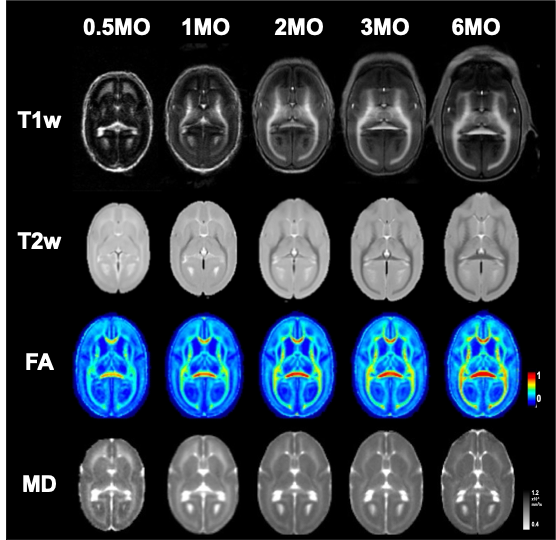
Age-specific averaged images of T1w, T2w, Jet-colored FA, and MD
DOI: https://doi.org/10.58530/2022/1325