1323
Specific Quantification of Myelin by QSM and MWI: Comparison to DTI in Mouse of Pelizaeus Merzbacher Disease and Metachromatic Leukodystrophy1Great Ormond Street Hospital for Children, London, United Kingdom, 2University Medical Center Hamburg-Eppendorf, Hamburg, Germany, 3Max-Planck-Institute of Experimental Medicine, Goettingen, Germany, 4Rheinische Friedrich-Wilhelms Universität Bonn, Bonn, Germany
Synopsis
Two different disease models, i.e., of Pelizaeus Merzbacher disease (PMD) and Metachromatic Leukodystrophy (MLD), were studied in mice using QSM, MWF, MTR and DTI as well as histopathology to assess their ability to specifically quantify myelin damage. Electron microscopy of PMD showed damaged myelin, but histological micrographs of MLD showed regular brain tissue integrity but with an abnormal presence of macrophages. Only MWF and QSM showed a difference between PMD and WT, but no difference between MLD and WT, which suggests, that MWF and QSM are highly specific to myelin damage.
Introduction
Postnatal assessment of normal myelin development or disorders affecting myelination (e.g., hypomyelination, leukodystrophies) is largely based on qualitative T1- and T2-weighted images in clinical routine. Common quantitative imaging methods like quantitative T2 (qT2) [1], Diffusion Tensor Imaging (DTI) [2] and Magnetization Transfer Ratio imaging (MTR) [3] are not necessarily specific to myelin. For example, Winklewski et al. noted that the DTI parameter of radial diffusivity (RD) does not seem to be specific to myelin integrity, but both, myelin integrity and extra-axial water content [4]. In contrast, Myelin Water Imaging (MWI) detects the amount of water of multiple tissue compartments based on their transverse relaxation [5]. The resulting myelin water fraction (MWF) gives the ratio of the water amount trapped within the myelin sheath and the total water amount of all tissue compartments. MWF seems to correlate well with white matter myelin content [6]. Quantitative Susceptibility Mapping (QSM), which assesses the magnetic property (susceptibility) of brain tissue, is highly sensitive to the diamagnetic myelin in white matter. The superiority of QSM in detecting myelin compared to DTI has recently been shown in the normal developing mouse brain [7]. In this project, two different disease models, i.e., of Pelizaeus Merzbacher disease (PMD) and Metachromatic Leukodystrophy (MLD), were studied in mice using QSM, MWI, MTR and DTI as well as histopathology to assess their ability to specifically quantify myelin damage.Materials and Methods
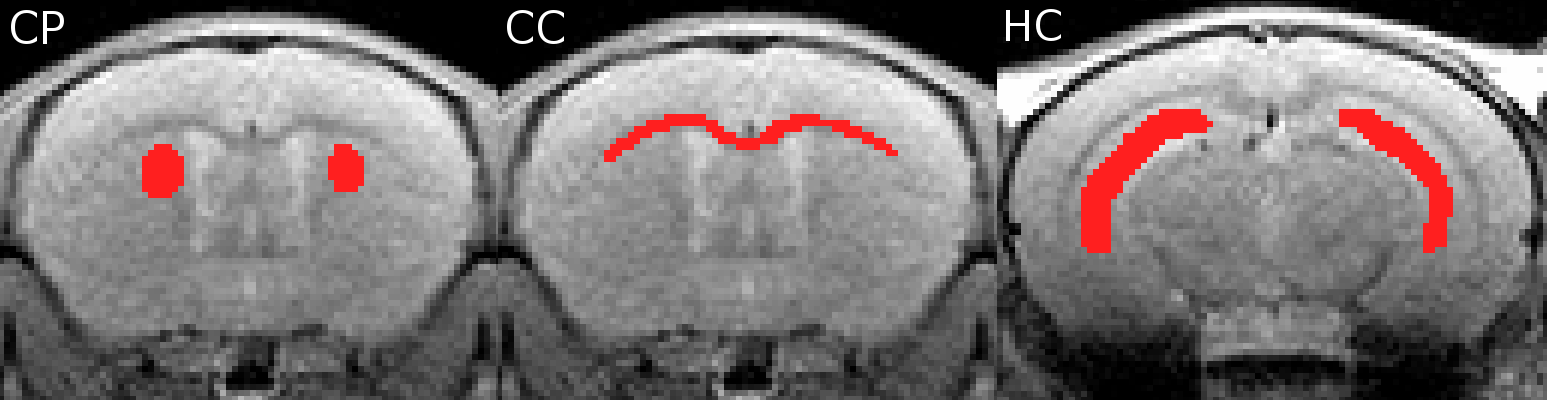
Seven PLBH (i.e., PMD) mice and 3 wild-type (WT) controls (Max Planck Institute for experimental medicine, Göttingen, Germany) as well as 8 MLD mice and 8 WT controls (Rheinische Friedrich-Wilhelms Universität, Bonn, Germany) were studied using a small animal MRI scanner (7T ClinScan, Bruker, Ettlingen, Germany) with the following sequence parameters: DTI: 12 diffusion weighting directions, b-value=1000s/mm, TR/TE=15000/34ms, BW=2894Hz/Px, 24 slices, 0.4mm slice thickness, FoV=15×15mm², matrix=96×96, parallel acquisition factor 2, 27 separate reference lines, 6/8 partial Fourier, 2 averages, TA=7:15min. MTR: TR/TE=302/2.9ms, FA=20°, BW=250Hz/Px, 24 slices, 0.4mm slice thickness, FoV=15×15mm², matrix=128x128, 2 averages, 2 concatenations, TA=2×2:35min. The non-slice selective magnetization saturation pulse was 1.5kHz off-resonance with a band width of 130Hz and an effective flip angle of 395°. QSM: 3D multi-echo gradient-echo sequence, 8 echoes, TR/TE/ΔTE=60/1.28/1.6ms, FA=15°, BW=890Hz/Px, FoV=15×15×7.68mm², matrix=128×128×64, 25% oversampling in slice encoding direction, elliptical k-space scanning, TA=8:02min. Quantitative susceptibility image analysis and reconstruction was done using an in-house developed post-processing Matlab routine comprising complex fitting of phase data for robust estimation of the frequency shift maps, Laplacian background field correction for local frequency shift estimation and threshold based k-space division for dipole inversion [9, 10]. MWI: 2D multi-echo spin-echo sequence, 32 spin echoes, TR/TE/ΔTE=3000/5.5/5.5ms, flip angles=90°/180°, BW=501Hz/pixel, FoV=15x15mm², matrix=128x128, 6/8 partial Fourier, parallel acquisition factor 2, 32 reference lines, slice thickness=0.4mm, gap between slices=1.2mm, 7 slices, 4 averages, total acquisition time 12:51min. Myelin water image analysis and reconstruction was done using an optimized reconstruction algorithm [8]. For data analysis, the following maps were calculated: AD, RD, mean diffusivity (MD) and fractional anisotropy (FA) for DTI, R2 and MWF for MWI as well as R2* and the magnetic susceptibility for QSM. A regions-of-interest (ROI) based analysis was done for caudoputamen (CP), corpus callosum (CC) and hippocampus (HC) (Fig.1).Results
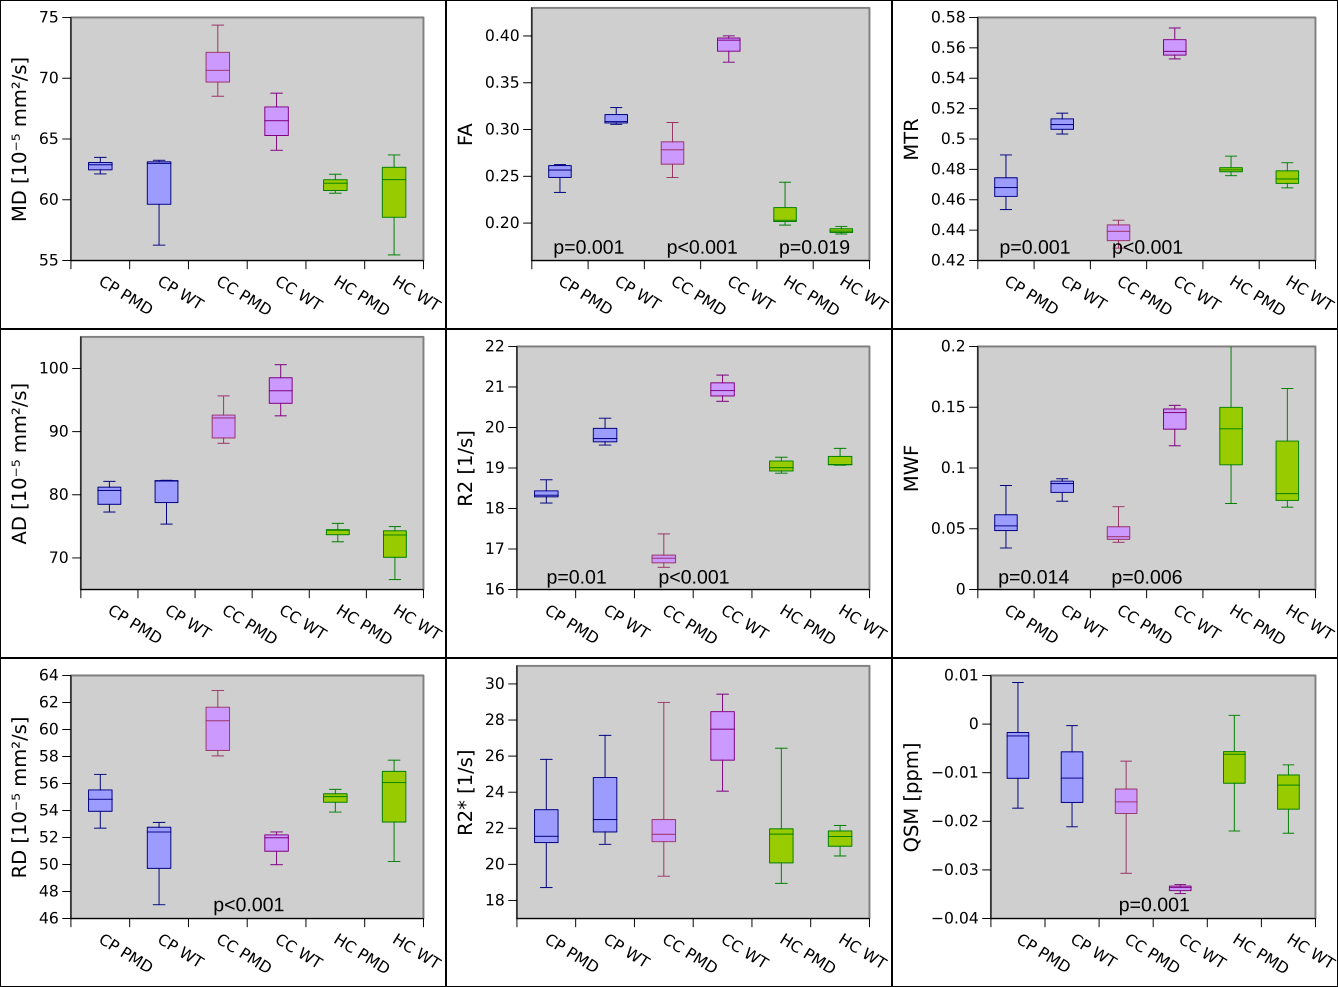
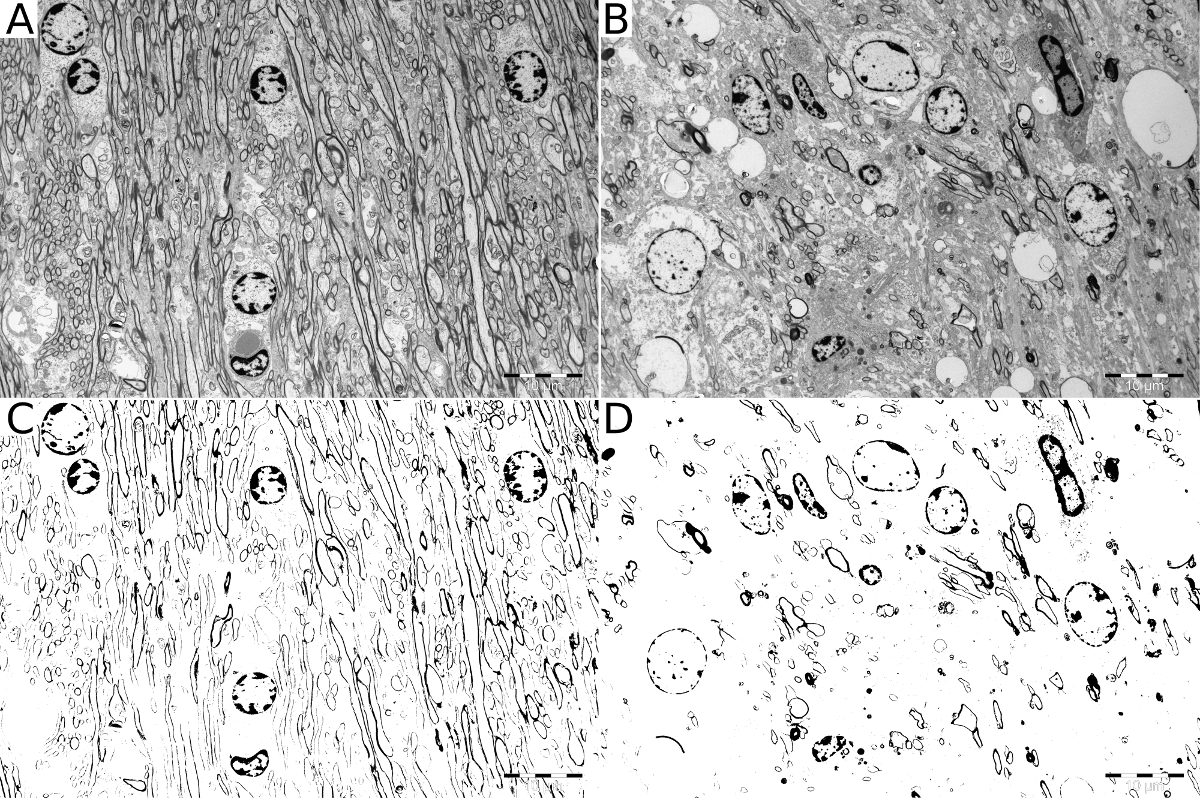
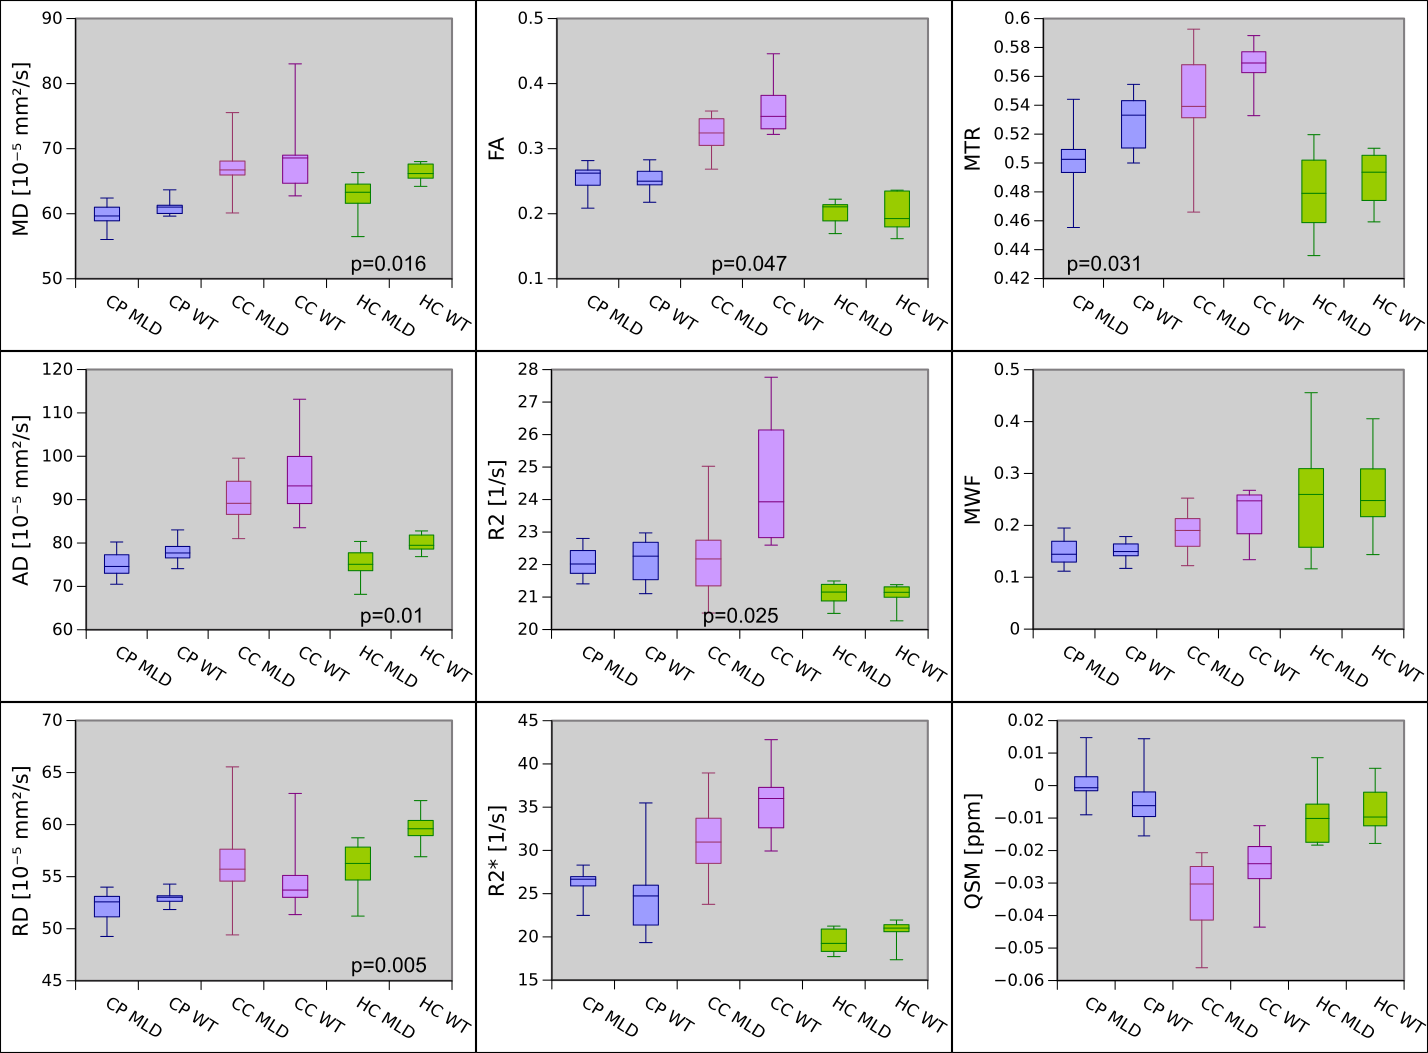
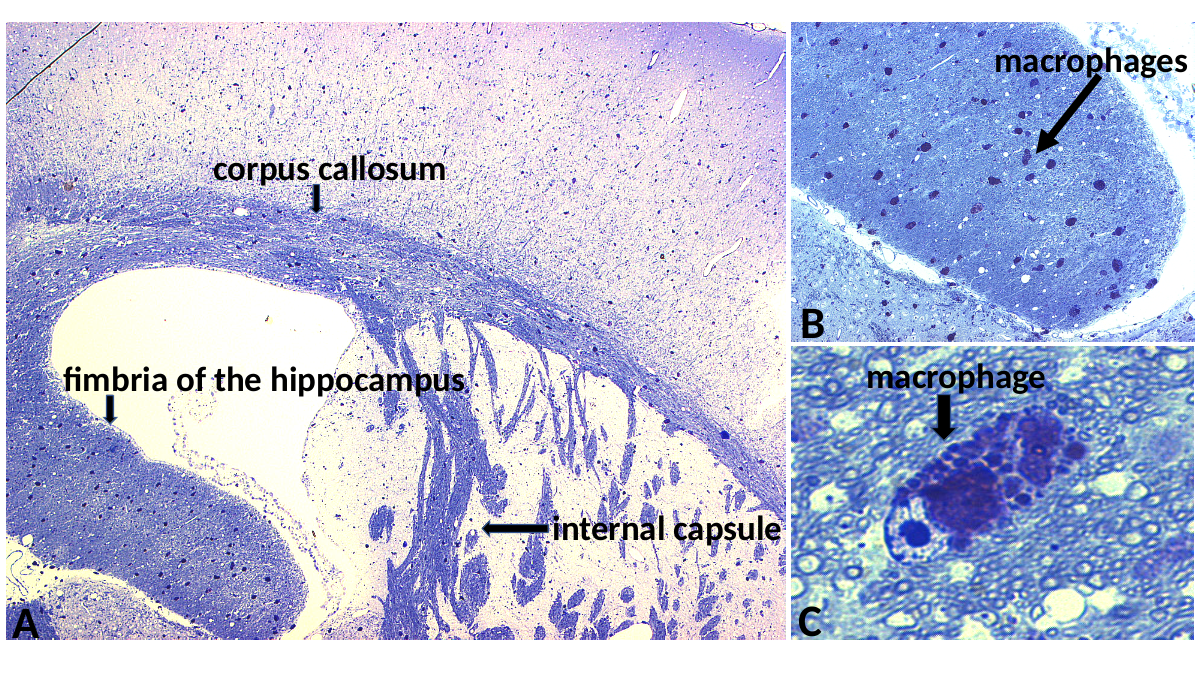
The CC showed highly statistically significant differences between PMD and WT mice for RD, FA, R2, MTR, WMF and QSM (Fig.2). The difference for MWF and QSM is about 50%. In agreement with this, electron microscopy of CC also showed about 50% less myelin between PMD and WT (Fig.3). Statistically significant differences between MLD and WT mice were found in HC for MD, AD and RD. No ROI showed differences between MLD and WT for MWI or QSM (Fig.4). The histological micrographs of a MLD mouse show regular brain tissue except for a high density of diffusely distributed large macrophages (Fig.5).Discussion and Conclusion
DTI, R2 and MTR parameters showed some differences for both PMD and MLD mice with respect to WT. For PMD mice, these findings may be caused by damaged myelin, but for MLD mice tissue integrity appears to be compromized by the high density of diffusely distributed large macrophages. In addition, MWF and QSM suggested a 50% difference of myelin in the CC between PMD and WT. This was confirmed by electron microscopy. In contrast, no difference was found for MWF and QSM between MLD and WT, where regular brain tissue was found on histological micrographs of MLD mice, which only showed an abnormal presence of macrophages. This suggests, that MWF and QSM are highly specific to myelin damage.Acknowledgements
We wish to thank Dushyant Kumar for providing the myelin water imaging reconstruction algorithm [8].References
1. Ding XQ, Kucinski T, Wittkugel O et al. Normal brain maturation characterized with age-related T2 relaxation times: an attempt to develop a quantitative imaging measure for clinical use. Invest Radiol. 2004 Dec;39(12):740-6.
2. Löbel U, Sedlacik J, Güllmar D, Kaiser WA, Reichenbach JR, Mentzel HJ. Diffusion tensor imaging: the normal evolution of ADC, RA, FA, and eigenvalues studied in multiple anatomical regions of the brain. Neuroradiology. 2009 Apr;51(4):253-63.
3. Dreha-Kulaczewski SF1, Brockmann K, Henneke M, Dechent P, Wilken B, Gärtner J, Helms G. Assessment of myelination in hypomyelinating disorders by quantitative MRI. J Magn Reson Imaging. 2012 Dec;36(6):1329-38. doi: 10.1002/jmri.23774. Epub 2012 Aug 21.
4. Winklewski PJ, Sabisz A, Naumczyk P, Jodzio K, Szurowska E, Szarmach A. Understanding the Physiopathology Behind Axial and Radial Diffusivity Changes-What Do We Know? Front Neurol. 2018 Feb 27;9:92.
5. MacKay A, Whittall K, Adler J, Li D, Paty D, Graeb D. In vivo visualization of myelin water in brain by magnetic resonance. Magn Reson Med Off J Soc Magn Reson Med Soc Magn Reson Med. 1994 Jun;31(6):673–7.
6. Laule C, Leung E, Li DK, et al. Myelin water imaging in multiple sclerosis: quantitative correlations with histopathology. Mult Scler. 2006;12:747–753.
7. Argyridis I, Li W, Johnson GA, Liu C. Quantitative magnetic susceptibility of the developing mouse brain reveals microstructural changes in the white matter. NeuroImage. 2013 Nov 22;88C:134–42.
8. Kumar D, Siemonsen S, Heesen C, Fiehler J, Sedlacik J. Noise robust spatially regularized myelin water fraction mapping with the intrinsic B1-error correction based on the linearized version of the extended phase graph model. J Magn Reson Imaging JMRI. 2016 Apr;43(4):800–17.
9. Shmueli K, de Zwart JA, van Gelderen P, Li T-Q, Dodd SJ, Duyn JH. Magnetic susceptibility mapping of brain tissue in vivo using MRI phase data. Magn Reson Med. 2009 Dec;62(6):1510–22.
10. Schweser F, Deistung A, Sommer K, Reichenbach JR. Toward online reconstruction of quantitative susceptibility maps: superfast dipole inversion. Magn Reson Med. 2013 Jun;69(6):1582-94.
Figures