1321
Prediction of WHO histological grade of paediatric posterior fossa ependymoma using diagnostic MR imaging and machine learning1Children's Brain Tumour Research Centre, University of Nottingham, Nottingham, United Kingdom, 2Radiological Sciences, University of Nottingham, Nottingham, United Kingdom, 3Institute of Cancer and Genomic Sciences, University of Birmingham, Birmingham, United Kingdom
Synopsis
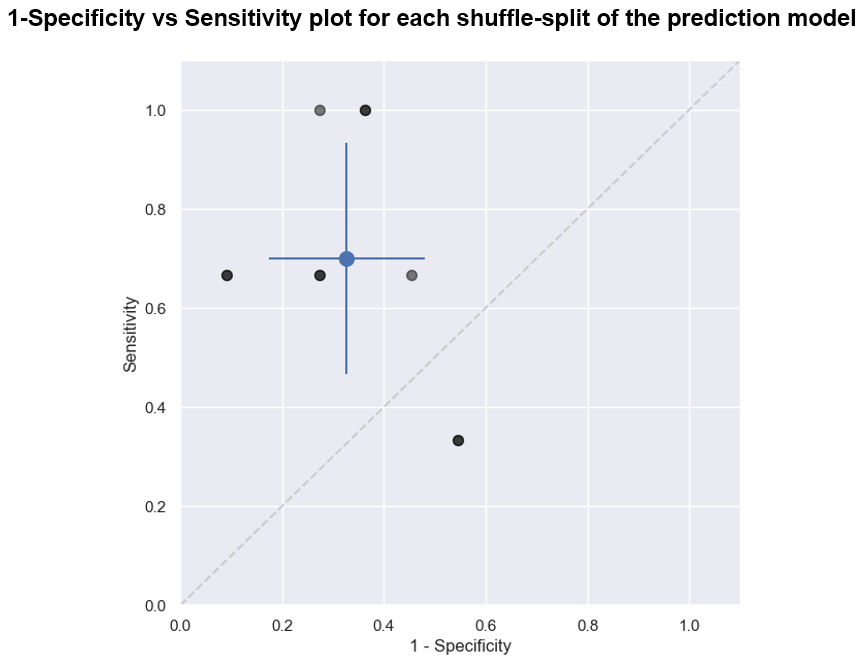
Ependymoma is the second most common paediatric malignant brain tumour and has a dismal outcome. WHO histological grade provides insight to prognosis and in most series confers a poor survival. Here we present a method to non-invasively predict the grade of paediatric posterior fossa ependymoma using diagnostic MR imaging (T2w and ADC) and machine learning. We found that WHO Grade II and III tumours can both be predicted with a sensitivity/specificity of 0.7±0.23 and 0.67±0.15 respectively. We believe these results provide the basis for a clinically important aid to decision making in the early stages of treatment.
Introduction
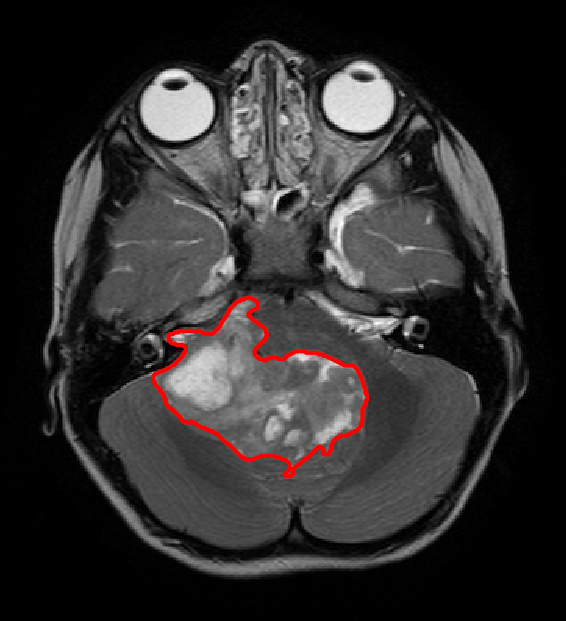
Ependymoma is the second most common malignant paediatric central nervous system (CNS) tumour 1 (Figure 1). Long term prognosis is poor, with a 10-year overall survival of 50% 2. Approximately half of all ependymoma relapse, which leads to an overall survival of 25%3. WHO histological grading finds that posterior fossa ependymoma can be either Grade II or Grade III, with Grade III possessing a significantly worse outcome 4. Early non-invasive prediction of histological grade will enhance the planning and refinement of treatment, as well as informing with the family in the crucial early stages of the patient’s clinical management. We aim to predict histological grade of paediatric posterior fossa ependymoma using diagnostic magnetic resonance imaging and radiomics with machine learning.Methods
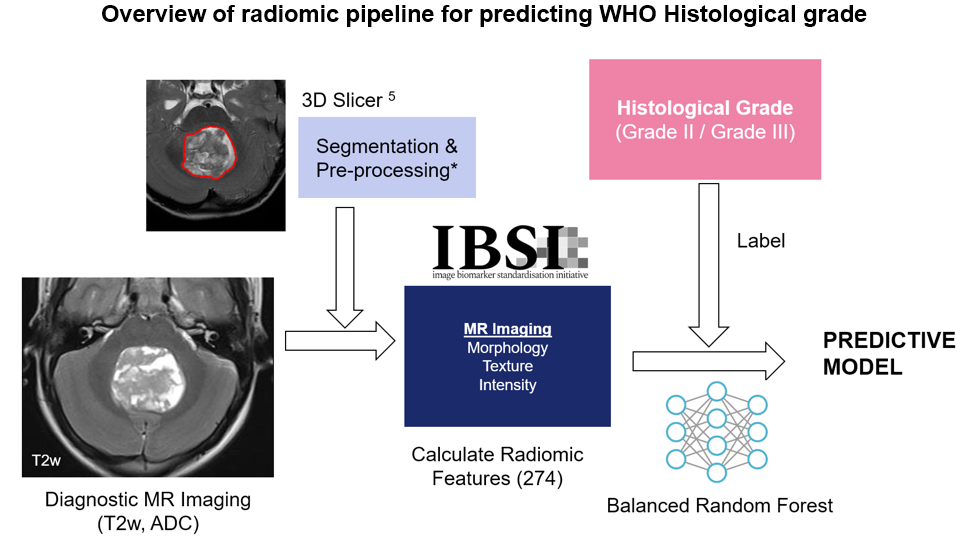
69 patients with posterior fossa ependymoma were included in this study (54 Grade III, 15 Grade II; 38 Male, 31 Female; 4.13 ± 4.46 years old). Diagnostic axial T2w and quantitative ADC maps were acquired for each patient across 17 institutions. Patients were recruited and scanned under the SIOPII Ependymoma clinical trial ethics. The tumour volume was manually segmented using 3DSlicer 5, which defines the tumour margin containing all necrotic and cystic areas. The T2w images are normalised such that the grey matter, white matter and CSF peaks are the same for all patients 6. T2w and ADC images are regridded to 0.5x0.5mm in-plane resolution with slice thickness untouched, and intensities are discretised to 64 values, as recommend by consensus studies 7. A total of 274 quantitative radiomic features were calculated from T2w and ADC images, described by the Image Biomarker Standardization Initiative 7 (Figure 2).The distributions of feature values are compared between the Grade II and III tumours using a two-tailed t-test.
A balanced random forest classifier8 was used to build a predictive model using 100 estimators. Data was split in training and test sets using a stratified shuffle split (80/20 train/test split, 10 splits). Performance was assessed using a confusion matrix which was calculated from each split and averaged. The results of this model were compared to a dummy classifier which predicts grade based solely on prevalence.
Results
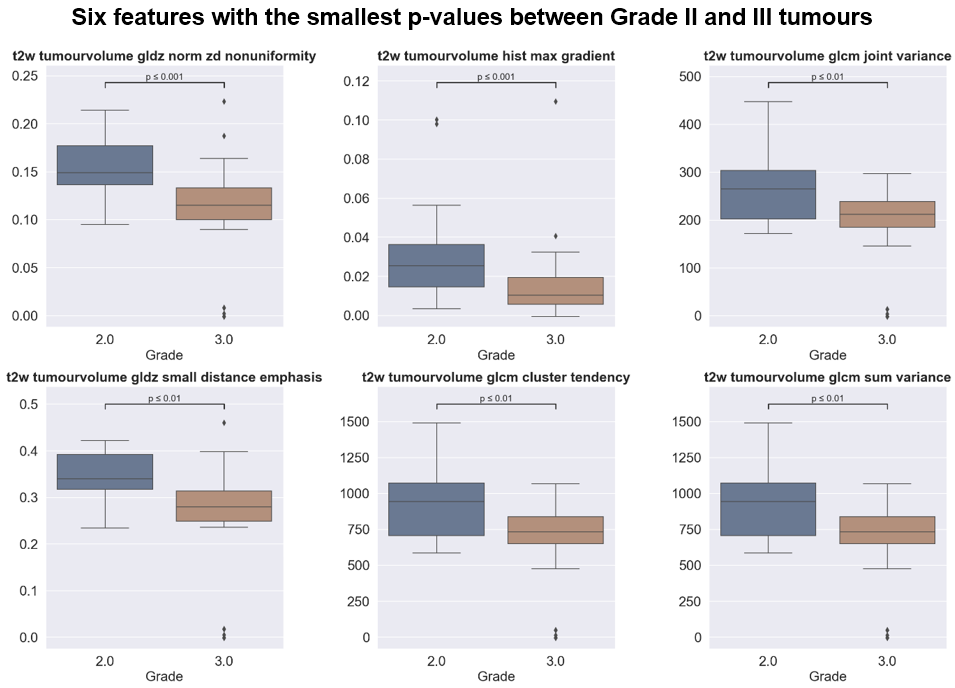
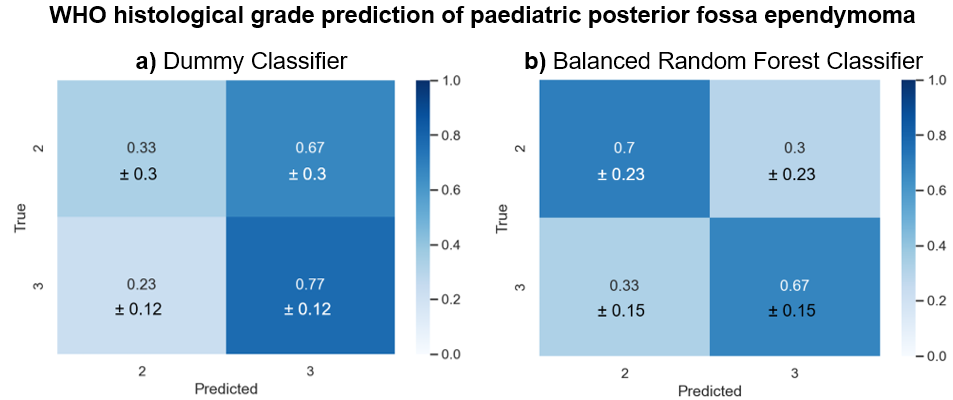
We found that 29 of the 274 features showed a significant difference (p<0.05) between Grade II and Grade III (6 features with the smallest p-value are shown in Figure 3). However, if the Bonferroni correction or FDR correction is applied, none of the features demonstrated a significant difference.The dummy classifier correctly predicted Grade II and III with a sensitivity of 0.33±0.3 and specificity of 0.77±0.12 respectively (Figure 4a). The balanced random forest classifier correctly predicted Grade II and III with a sensitivity of 0.7±0.23 and specificity of 0.67±0.15 (Figure 4b and Figure 5).
Discussion
The radiomic feature values alone were not sufficient in order to identify Grade II from Grade III as none showed a significant difference when the Bonferroni correction was applied. However, the application of a predictive model built using machine learning was able to identify grade.The dummy classifier correctly identifies Grade II and III at the expected rate when prevalence is considered. As 70% of the tumours included were Grade III, it is expected that many Grade II tumours are misclassified when predicted based on prevalence. The balanced random forest classifier, however, improves the correct classification rate of the Grade II tumours. The imbalanced nature of the dataset meant that a balanced version of the random forest classifier was used.
Conclusion
We have shown that WHO histological grade of paediatric posterior fossa ependymoma can be predicted with a sensitivity of 0.7±0.23 and specificity of 0.67±0.15. This model needs further refinement and the inclusion of other clinical marker predictions (such as 1q gain and DNA methylation) in order to act as a clinical aid.The extensive pre-processing required on the acquired images may pose a limitation the clinical use of this method and must be streamlined for application. In the future, we hope to refine this model by including additional scan types such as T1w with/without contrast agents and increasing patient numbers.
Acknowledgements
Authors would like to thank Children with Cancer and the Children's Cancer and Leukaemia Group for funding.References
1. Stiller CA, Bayne AM, Chakrabarty A, Kenny T, Chumas P. Incidence of childhood CNS tumours in Britain and variation in rates by definition of malignant behaviour: population-based study. BMC Cancer. Feb 11 2019;19(1):139. doi:10.1186/s12885-019-5344-7
2. Marinoff AE, Ma C, Guo D, et al. Rethinking childhood ependymoma: a retrospective, multi-center analysis reveals poor long-term overall survival. J Neurooncol. Oct 2017;135(1):201-211. doi:10.1007/s11060-017-2568-8
3. Ritzmann TA, Kilday JP, Grundy RG. Pediatric ependymomas: destined to recur? Neuro Oncol. Jun 1 2021;23(6):874-876. doi:10.1093/neuonc/noab066
4. Sasaki A, Hirato J, Hirose T, et al. Review of ependymomas: assessment of consensus in pathological diagnosis and correlations with genetic profiles and outcome. Brain Tumor Pathol. Apr 2019;36(2):92-101. doi:10.1007/s10014-019-00338-x
5. Kikinis R, Pieper S, Vosburgh K. 3D Slicer: A Platform for Subject-Specific Image Analysis, Visualization, and Clinical Support. 2014:277-289.
6. Robitaille N, Mouiha A, Crepeault B, Valdivia F, Duchesne S, The Alzheimer's Disease Neuroimaging I. Tissue-based MRI intensity standardization: application to multicentric datasets. Int J Biomed Imaging. 2012;2012:347120. doi:10.1155/2012/347120
7. Zwanenburg A, Vallieres M, Abdalah MA, et al. The Image Biomarker Standardization Initiative: Standardized Quantitative Radiomics for High-Throughput Image-based Phenotyping. Radiology. May 2020;295(2):328-338. doi:10.1148/radiol.2020191145
8. Lema, itre G, Nogueira F, Aridas CK. Imbalanced-learn: A Python Toolbox to Tackle the Curse of Imbalanced Datasets in Machine Learning. Journal of Machine Learning Research. 2017 2017;18(17):1-5.
Figures