1318
Characterization of cardiac alterations in transgenic rat model of pulmonary arterial hypertension exposed to chronic hypoxia1IHU Liryc, Bordeaux, France, 2CRCTB-INSERM U1045, Bordeaux, France, 3Université Paris–Saclay, AP-HP, INSERM UMR_S 999, Le Kremlin Bicêtre, France
Synopsis
Transgenic rats with Bmpr2 mutation is a model of heritable pulmonary arterial hypertension (PAH). This study aims to evaluate cardiac alterations of Bmpr2-mutants associated with a risk factor (hypoxia) by MRI and 31P-MRS. Transgenic rats exposed to chronic hypoxia showed a drastic dilatation of the RV along with an increased wall thickness and no variation of ejection fraction, thus resembling right heart failure with preserved ejection fraction. The cardiac energy balance is disturbed in Bmpr2 rats under hypoxia indicating a metabolic insult. Bmpr2 mutation associated with chronic hypoxia can aggravate right heart failure and thereby accentuated the onsets of PAH.
Introduction
Advanced stage of pulmonary arterial hypertension (PAH) is characterized by an increase in the mean pulmonary arterial pressure (mPAP) along with right ventricular failure leading to patient death without heart-lung transplant1. In heritable cases, PAH is mostly associated to mutations in Bone Morphogenic Protein Receptor 2 (Bpmr2) gene. Patient’s carriers of Bmpr2 mutations are diagnosed younger and showed more severe clinical features2. Moreover, Bmpr2 gene is expressed in the right ventricle (RV) and it was hypothesized that RV function is the main determinant in the clinical phenotypes of mutation carriers and noncarriers3. The severity of PAH phenotype in Bmpr2 carriers is also influenced by hypoxia. Indeed, Bmpr2 carriers exposed to hypoxia showed an increased susceptibility to hypoxic pulmonary vasoconstriction4,5. Rodents exposed to chronic hypoxia demonstrated disturbances in genes associated with proliferation and apoptosis of endothelial cells leading to an increased mPAP6.In this project, experiments were performed on a rat model with a monoallelic mutation of Bmpr2 which showed a similar penetrance of spontaneous PAH as the one observed in humans (~20%)7. This study aims to evaluate the contribution of Bmpr2 mutation in cardiac alterations in transgenic rats exposed to a risk factor (chronic hypoxia) by magnetic resonance imaging (MRI) and 31P magnetic resonance spectroscopy (31P MRS).
Methods
Male Sprague-Dawley rats aged of 3-month-old with transgenic genotype (TG, bmpr2 monoallelic mutation) or wild type genotype (WT, non-mutated brothers) were divided in two conditions: normoxia and chronic hypoxia (Fig.1).MR acquisitions were performed on a 9.4T Biospec MRI (Bruker, Wissembourg, France) of 30 cm aperture. A transmit-quadrature 1H coil coupled with phase array coil in reception was used for MRI and a 1H/31P surface coil for localized spectroscopy. All animal experimental procedures were approved by the ethics committee.
Animals were anesthetized with 4% isoflurane then maintained at 2% (1L.min-1 mixed in air) during acquisitions. The physiological parameters (ECG and respiration) were monitored continuously (SA Instruments).
Several scout images were acquired to determine the short axis view of the rat heart. Short-axis cine FLASH was acquired with the following parameters: TE/TR=1.60/80ms; flip angle=15°; 20 contiguous slices; in-plane resolution=300x300µm2; slice thickness=1mm; 10 frames per cardiac cycle; 5 averages; cardiac and respiratory triggering. These MR images were used to assess: (i) end-diastolic (ED) and end-systolic (ES) volumes of left ventricle (LV) and right ventricle (RV); (ii) ejection fraction (EF); (iii) cardiac output and (iv) wall thickness of mid-LV, mid-septum and mid-RV at end-diastolic stage. Images were analyzed on Horos (LGPL-3.0) with MRHeart plugin8.
Localized 31P spectra were then acquired on ventricles by outer volume suppression method9: 6 saturation bands were surrounding the volume of interest (10x10x14mm3) followed by a non-selective pulse of 200µs (α= 90°; TR= 1.5s; bandwidth= 8KHz; 4096 points; 64 averages ; acquisition time=3min12s) triggered onto the respiration and cardiac cycle. Beforehand, a localized shimming on the heart was performed with the use of the 1H surface coil, resulting in a proton linewidth of approximately 65Hz. Phosphocreatine (PCr) and ATPβ were quantified by AMARES (apodization of 20Hz) (jMRUI 6.0) to assess the cardiac energy balance. Groups were compared by one-way ANOVA followed by a post-hoc test of Tukey (GraphPad Prism 9.2).
Results
Volumetric measurements on short axis views (Fig.2) showed a slight decrease in end-diastolic and end-systolic volumes of LV in TG-Normoxia rats compared to WT-Normoxia rats: -28.9% and -22.7% respectively (Fig.3A&3B). A major increase of RV volume was measured in WT-Hypoxia group compared to WT-Normoxia group: +73.0% at end-diastolic stage and +87.8% at end-systolic stage (Fig.3A&3B). Besides, an even more drastic enlargement was measured in TG-Hypoxia group compared to WT-Hypoxia group: +27.6% at end-diastolic stage and +31.5% at end-systolic stage (Fig.3A&3B). No significant difference in ejection fraction was found between normoxia groups and hypoxia groups for LV and RV (Fig.3C&Fig.3F).In addition, RV wall was thicker in hypoxia groups compared to normoxia groups: +55.7% for WT-Hypoxia (vs WT-Normoxia=0.97±0.05mm) and +62.0% for TG-Hypoxia (vs TG-Normoxia=1.00±0.05mm) while there is no change in LV and septum (Fig.4).
Good quality localized 31P spectra were obtained on the ventricles (Fig.5A). The ratio of PCr/ATPβ did not show any difference between WT-Normoxia compared to TG-Normoxia and WT-Hypoxia (Fig.5B). Nevertheless, a significant increase in the ratio was measured for TG-Hypoxia group (+30.2% vs TG-Normoxia=2.35±0.11A.U.). This elevation of the ratio appears to be linked to the decrease of ATPβ in TG-Hypoxia group (-18.4% vs TG-Normoxia=1.41±0.06A.U.) (Fig.5B). Indeed, the three lowest values of ATPβ in TG-Hypoxia group contribute to the increased ratio (circled in yellow in Fig.5B).
Conclusion
Transgenic rat model of familial PAH exposed to chronic hypoxia showed an elevated end-diastolic and end-systolic volumes of RV compared to WT rats under the same condition. These results indicate a drastic dilatation of the RV along with an RV hypertrophy (an increased wall thickness) and no significant variation of ejection fraction, thus resembling right heart failure with preserved ejection fraction. Cardiac energy balance is disturbed in Bmpr2 rats under chronic hypoxia compared to Bmpr2 rats under normoxia indicating a metabolic insult. The comparison of normoxia and chronic hypoxia in Bmpr2 rats allowed to evaluate that Bmpr2 mutation associated with a risk factor can aggravate right heart failure and thereby accentuated the onsets of PAH.Acknowledgements
This study received financial support from the French Government as part of the “Investments of the Future” program managed by the National Research Agency (ANR), Grant reference ANR-10-IAHU-04. This project also received financial support from the French Federation of Cardiology.
References
1. Machado, R. D. et al. Genetics and Genomics of Pulmonary Arterial Hypertension. J. Am. Coll. Cardiol. 54, S32–S42 (2009).
2. Evans, J. D. W. et al. BMPR2 mutations and survival in pulmonary arterial hypertension: an individual participant data meta-analysis. Lancet Respir. Med. 4, 129–137 (2016).
3. van der Bruggen, C. E. et al. Bone Morphogenetic Protein Receptor Type 2 Mutation in Pulmonary Arterial Hypertension: A View on the Right Ventricle. Circulation 133, 1747–1760 (2016).
4. Pavelescu, A., Vanderpool, R., Vachiéry, J.-L., Grunig, E. & Naeije, R. Echocardiography of pulmonary vascular function in asymptomatic carriers of BMPR2 mutations. Eur. Respir. J. 40, 1287–1289 (2012).
5. Claessen, G. et al. Right ventricular and pulmonary vascular reserve in asymptomatic BMPR2 mutation carriers. J. Heart Lung Transplant. 36, 148–156 (2017).
6. Bull, T. M., Coldren, C. D., Geraci, M. W. & Voelkel, N. F. Gene Expression Profiling in Pulmonary Hypertension. Proc. Am. Thorac. Soc. 4, 117–120 (2007).
7. Hautefort, A. et al. Bmpr2 Mutant Rats Develop Pulmonary and Cardiac Characteristics of Pulmonary Arterial Hypertension. Circulation 139, 932–948 (2019).
8. Szychta, W., Werys, K., Barczuk-Falęcka, M., Postuła, M. & Małek, Ł. Validation of performance of free of charge plugin for the open-source platform to perform cardiac segmentation in magnetic resonance imaging. Heart Beat J. 3, 83–89 (2019).
9. Deschodt-Arsac, V. et al. Energy Deregulation Precedes Alteration in Heart Energy Balance in Young Spontaneously Hypertensive Rats: A Non Invasive In Vivo 31P-MR Spectroscopy Follow-Up Study. PLOS ONE 11, e0162677 (2016).
Figures

Figure 1: Schematic representation of experimental protocol
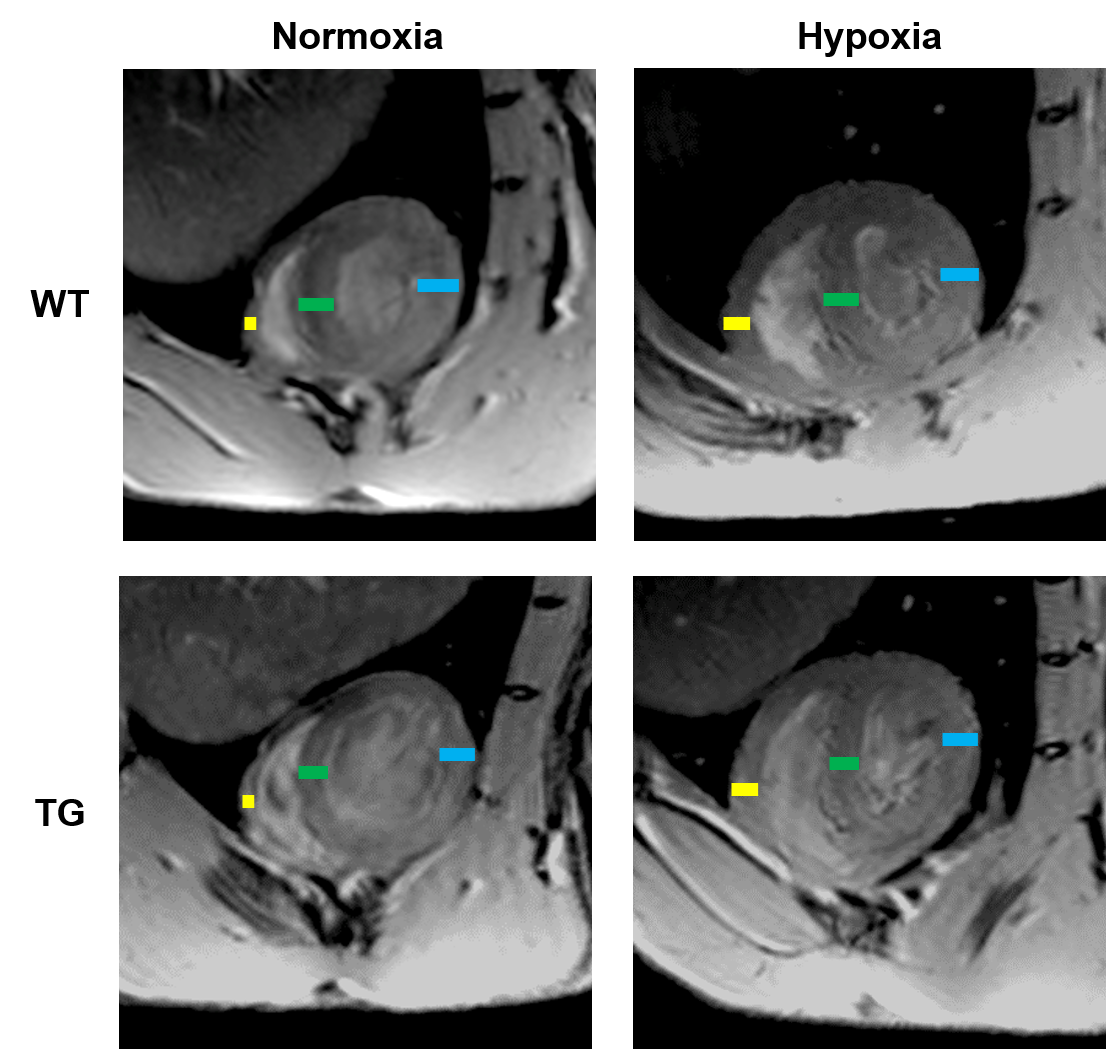
Figure 2: Representative short-axis cine FLAH images obtained at end-diastolic stage in wild-type (WT) and transgenic (TG) rats under normoxia or hypoxia (resolution 0.3x0.3x1mm3). Lines indicate where the measurements of wall thickness were performed in yellow for right ventricular free wall, green for septal wall and blue for left ventricular free wall.

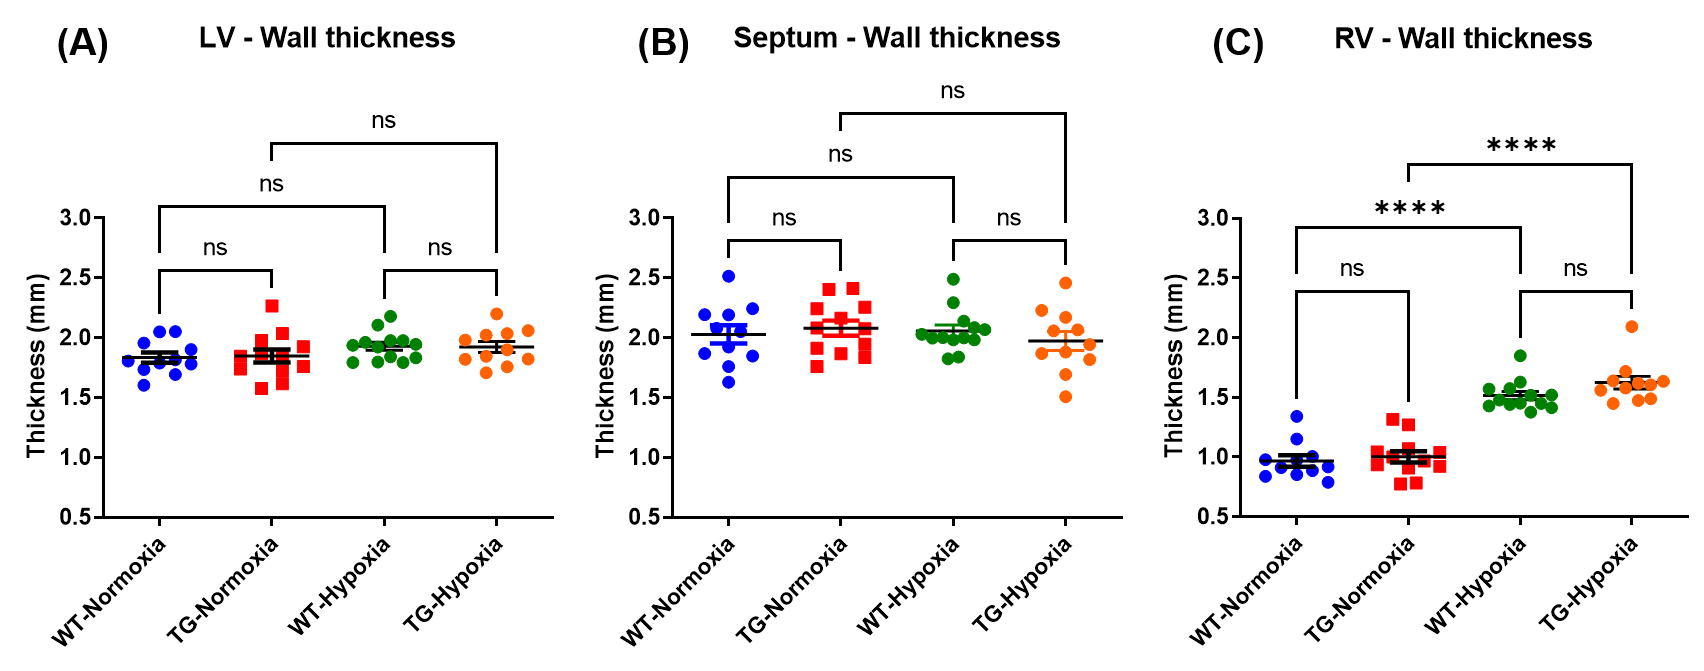
Figure 4: Cardiac wall thickness of wild type (WT) and transgenic (TG) rats under normoxia and hypoxia measured at end-diastolic stage (in mm) in: (A) left ventricle (LV); (B) septum and (C) right ventricle (RV). Mean±SEM and groups were compared by ANOVA followed by a post-hoc test of Tukey with ****p<0.0001 and ns=non-significant.
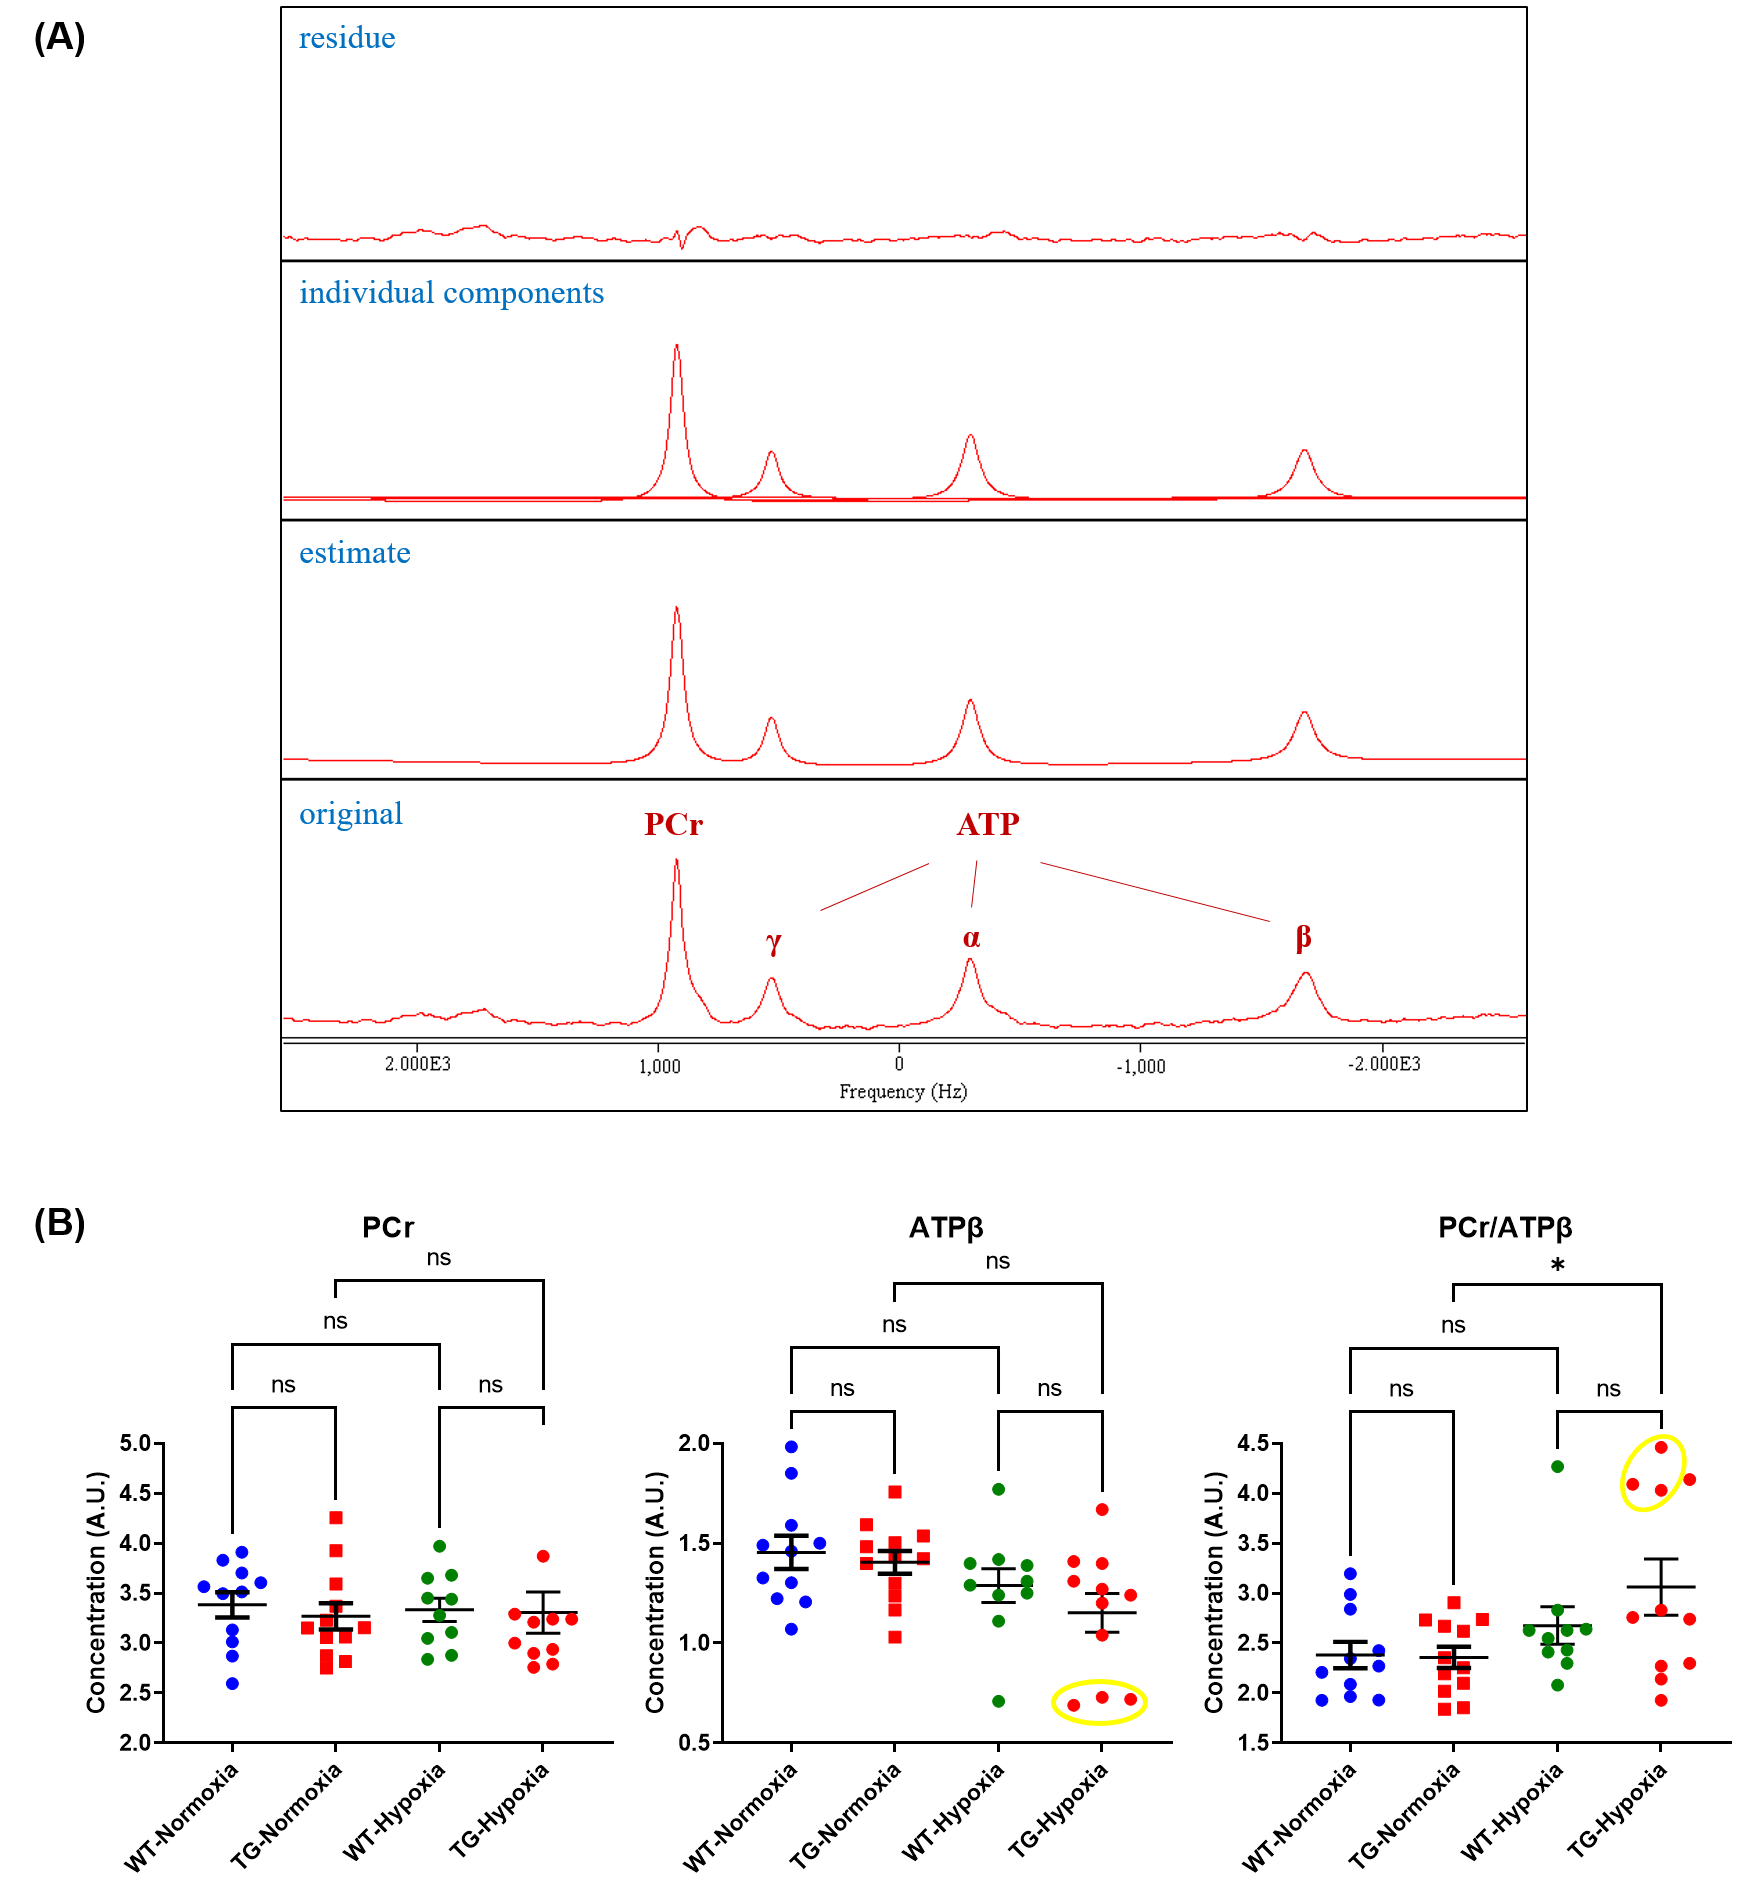
Figure 5: (A) AMARES analysis of typical localized 31P MRS spectrum obtained in control rat; (B) Concentration of phosphocreatine (PCr), ATPβ and ratio PCr/ATPβ of wild type (WT) and transgenic (TG) rats under normoxia and hypoxia. Mean±SEM and groups were compared by ANOVA followed by a post-hoc test of Tukey with *p<0.05 and ns=non-significant. Yellow circle indicates same animals in measured parameters.