1316
A multi-organ assessment of the acute effects of haemodialysis using intradialytic multiparametric magnetic resonance imaging1Sir Peter Mansfield Imaging Centre, University of Nottingham, Nottingham, United Kingdom, 2Centre for Kidney Research and Innovation, University of Nottingham, Derby, United Kingdom, 3Renal Unit, University Hospitals of Derby and Burton NHS Foundation Trust, Derby, United Kingdom, 4Center of Excellence Medical Europe, Middle East and Africa, Fresenius Medical Care, Bad Homburg, Germany
Synopsis
Twelve patients underwent serial cardiac, cerebral and renal multiparametric 3T MRI scans before, during and after haemodialysis. During dialysis, there was a significant decline in cardiac and stroke index and myocardial strain, with increased diastolic dysfunction. This was accompanied by a reduction in blood flow to both the heart and brain. White matter T1 increased during dialysis suggesting fluid shifts increasing water content resulting in local oedema. Total kidney volume, renal cortex T1 and T2* all reduced during dialysis likely reflecting reduced renal blood volume and change in renal tissue water. These results highlight the acute multi-organ effects of dialysis.
Introduction
Recurrent circulatory stress caused by haemodialysis (HD) plays a central role in the pathophysiology of multi-organ dysfunction in HD patients1,2. Single organ dysfunction has been studied in separate studies, typically following dialysis, but multi-organ dysfunction has not previously been assessed during the same dialysis treatment. Here, intradialytic MRI was performed to simultaneously characterise the effect on cardiac, cerebral and renal structure, function and perfusion.Methods
Twelve patients underwent four serial cardiac, brain and renal multiparametric MRI (Philips 3T Ingenia) scans before, during and following haemodialysis (Fig.1).Cardiac MRI included measures of cardiac and stroke volume index, ejection fraction, left ventricle (LV) wall mass index and diastolic dysfunction (LV short-axis cine); peak longitudinal and circumferential strain (short and long axis LV Tagging); myocardial T1 (LV short-axis native MOLLI), perfusion (Look-Locker ASL), and aortic and IVC blood flow (Phase Contrast (PC)-MRI). Continuous heart rate was assessed from scanner physiological monitoring, and blood pressure (BP) was recorded every 15 minutes using an integrated cuff.
Cerebral MRI included T1 mapping of grey (GM) and white matter (WM) (SE-EPI IR), GM perfusion (SE-EPI FAIR ASL), and carotid and basilar artery blood flow (PC-MRI).
Renal MRI included measures of cortex T1 (SE-EPI IR) and T2* (mFFE), and Total Kidney Volume (TKV) (bTFE) indexed to body surface area (BSA).
GraphPad Prism was used to assess effect of time with a Mixed Effects model and correlations between measures (significance level p<0.05).
Results
Systolic and diastolic BP fell significantly during dialysis (P<0.001). Heart rate significantly changed during dialysis and was elevated post-dialysis (Fig.2a), whilst heart rate variability significantly increased during dialysis (P<0.0001). Stroke volume index and cardiac index significantly decreased during dialysis with the largest reduction at Scan 3 (Fig.2a) before recovery post-dialysis. There was no change in ejection fraction and LV wall mass index during dialysis. Diastolic dysfunction increased during dialysis; the first peak, peak filling rate and filling volume significantly decreased whilst time-to-peak increased (Fig.2b). During dialysis, whole wall strain became less negative indicating reduced contractility (Fig.2c). There was no change in myocardial T1 during dialysis but there was a trend for decreased myocardial perfusion (P=0.075). IVC area reduced during dialysis (P=0.034) resulting in a significant decrease in IVC flux (P=0.042).A significant reduction in velocity in the carotid artery and basilar artery occurred during dialysis, with a resultant significant reduction in flux in the carotid artery but not basilar artery (Fig.3a). Between Scan 1 and Scan 3, the percentage change in carotid artery velocity significantly correlated with the change in aortic blood flow velocity (Fig.3b), with a trend for a correlation between the percentage change in carotid artery velocity and cardiac index (R2=0.5, P=0.059). Percentage change in carotid artery stroke volume correlated with ultrafiltration volume (Fig.3c). There was no significant change in GM perfusion (Fig.3d) during dialysis. Brain T1 maps showed GM regions predominantly showed a decrease in T1 during dialysis, conversely WM showed an increase in T1 with a significant difference in T1 between Scan 1 and Scan 3 (Fig.4).
TKV, renal cortex T1 and T2* all significantly decreased during dialysis (Fig.5). Renal cortex T1 and T2* returned to pre-dialysis level by Scan 4 whilst TKV remained reduced.
Discussion
This study demonstrates the multi-organ effects of dialysis by simultaneous intradialytic MRI measures. The observed decline in cardiac and stroke volume index together with a reduction in myocardial contractility, and a trend towards a fall in myocardial perfusion agree with our previous cardiac MRI study3. The fall in cardiac index is likely to be a contributing factor in the observed reduction in carotid and basilar artery blood flow velocity.Changes in cerebral haemodynamics during dialysis are reflective of the alterations in blood pressure and volume status which induces circulatory stress altering the cerebral macro-/micro-vascular. There was a significant correlation between the percentage change in carotid artery stroke volume between Scan 1 and Scan 3 with ultrafiltration volume (Fig.3d). Our results are in agreement with the small decline in mean flow velocity during dialysis shown using transcranial Doppler ultrasound4. During dialysis there was a highly significant increase in WM T1 and a trend for reduced GM T1. Fluid removal during haemodialysis is accompanied by an increase of blood viscosity, and rapid shifts in electrolytes, acid–base balance, and uremic solutes. Changes in WM T1 likely result from accumulation of excess fluid in WM during dialysis resulting in local swelling. The haemodynamic and T1 changes measured during dialysis likely underlie the progressive cerebrovascular disease that occurs in HD patients.
During dialysis, a significant reduction in TKV, renal T1 and T2* was seen, with the largest reduction seen in the end stage of dialysis (Scan 3). These changes likely reflect a reduction in water content of the kidneys and may indirectly represent an alteration in renal blood flow and volume during dialysis, or alternatively the effects of ultrafiltration itself. A recent CT study demonstrated an intra-dialytic drop in renal perfusion5.
Conclusion
In summary, we describe the acute multi-organ effects of haemodialysis. We confirm negative effects on myocardial contractility and cardiac output, show synchronous changes in carotid and basilar artery blood flow and evidence of hypoperfusion affecting the kidney.Acknowledgements
This study was funded by Fresenius Medical Care, Germany.References
1. CW McIntyre. Haemodialysis-induced myocardial stunning in chronic kidney disease - a new aspect of cardiovascular disease. Blood Purif. 2010;29(2):105-10.
2. CW McIntyre. Recurrent circulatory stress: the dark side of dialysis. Semin Dial. 2010;23(5):449-51.
3. C Buchanan, A Mohammed, E Cox, K Köhler, B Canaud, MW Taal, NM Selby, S Francis and CW McIntyre. Intradialytic Cardiac Magnetic Resonance Imaging to Assess Cardiovascular Responses in a Short-Term Trial of Hemodiafiltration and Hemodialysis. J Am Soc Nephrol. 2017 Apr;28(4):1269-1277.
4. MD Findlay, J Dawson, DA Dickie, KP Forbes, D McGlynn, T Quinn, PB Mark. Investigating the Relationship between Cerebral Blood Flow and Cognitive Function in Hemodialysis Patients. J Am Soc Nephrol. 2019 Jan;30(1):147-158.
5. R Marants, E Qirjazi, CJ Grant, T-Y Lee and CW McIntyre. Renal Perfusion during Hemodialysis: Intradialytic Blood Flow Decline and Effects of Dialysate Cooling. Journal of the American Society of Nephrology. 2019;30(6):1086.
Figures

Figure 1: Schematic of study day. Serial cardiac, brain and renal multiparametric 3T MRI was performed before (Scan 1), during (30 min and 180 min (Scan 2 and 3)) and 30 min following dialysis (Scan 4). The dialyser was situated in the control room adjacent to the magnet room, dialysis lines were extended by 0.6 m and run through waveguides into the magnet room to connect to the patient.
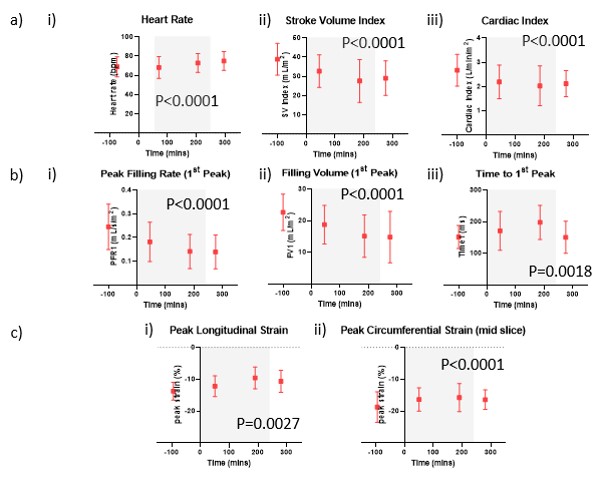
Figure 2: (a) Change in (i) heart rate and left ventricular function measured using short axis cine to assess (ii) stroke volume index and (iii) cardiac index, and (b) diastolic dysfunction parameters of (i) first peak filling rate index, (ii) first peak filling volume index and (iii) first peak filling time during dialysis; (c) Peak (i) longitudinal and (ii) circumferential strain measured using cardiac tagging. Grey box indicates period of dialysis.

Figure 3: (a) (i) Carotid artery and (ii) basilar artery velocity and blood flow during dialysis. Grey box indicates period of dialysis. Correlations between (b) percentage change in carotid artery velocity and aortic velocity between Scan 1 and Scan 3, and (c) Percentage change in carotid artery stroke volume and ultrafiltration volume (UFV). (d) Grey matter perfusion during dialysis. Grey box indicates period of dialysis.
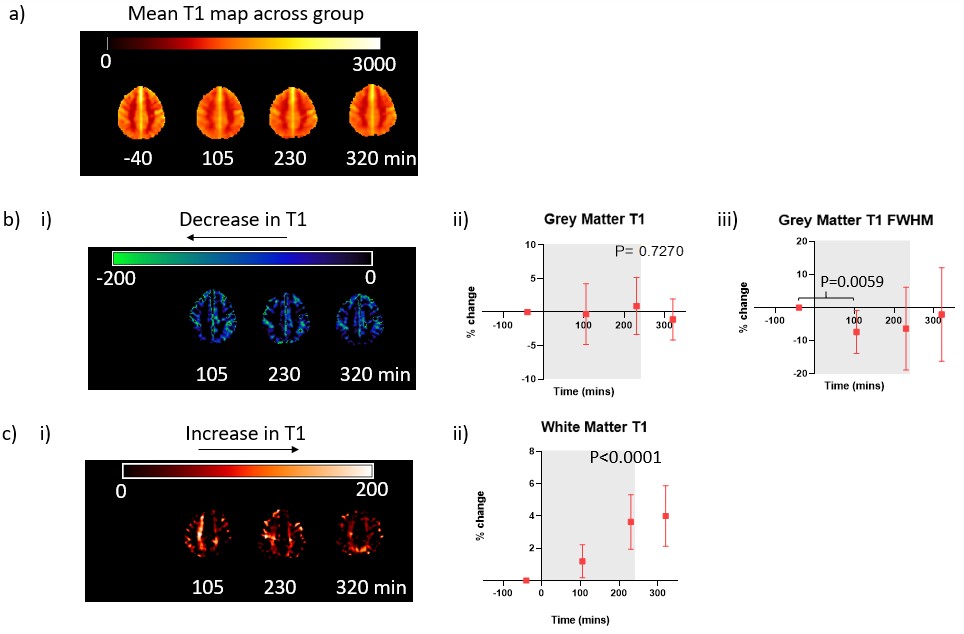
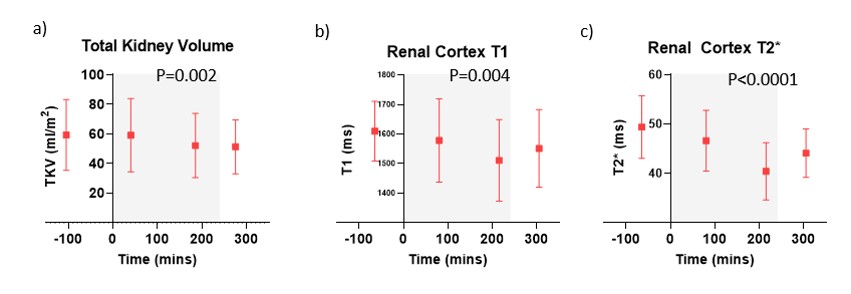
Figure 5: Change in (a) Total Kidney Volume, (b) renal cortex T1 and (c) renal cortex T2* during dialysis Grey box indicates period of dialysis.