1310
BOLD MRI Perfusion in Peripheral Skeletal Muscle: Revealing the cuffing duration dependency
Stefanie Eriksson1,2, Jonathan Arvidsson1,2, Suhela Abubakar Mohammad1, Edvin Johansson3, and Kerstin Lagerstrand1,2
1Department of Medical Radiation Sciences, Institute of Clinical Sciences, Sahlgrenska Academy, University of Gothenburg, Gothenburg, Sweden, 2Department of Medical Physics and Biomedical Engineering, Sahlgrenska University Hospital, Gothenburg, Sweden, 3Antaros Medical, Mölndal, Sweden
1Department of Medical Radiation Sciences, Institute of Clinical Sciences, Sahlgrenska Academy, University of Gothenburg, Gothenburg, Sweden, 2Department of Medical Physics and Biomedical Engineering, Sahlgrenska University Hospital, Gothenburg, Sweden, 3Antaros Medical, Mölndal, Sweden
Synopsis
This study demonstrates the cuffing duration dependence of BOLD T2*-time curve parameters in peripheral skeletal muscle in the calf. This was made possible by the repeated measurements of healthy individuals using two different cuffing paradigms. The cuffing paradigms consisted of an ischemic period induced by cuffing of the thigh for 1.5 or 5 minutes, as well a 5 minute period of reactive hyperaemia. Systematic comparison of derived parameters was done from a descriptive representation of the T2* time curve.
Introduction
Skeletal muscle BOLD MRI in calf muscle has been pointed out as a promising diagnostic tool due to its sensitivity to physiological and pathophysiological alterations in the peripheral limb perfusion1. In particular, the technique has been shown to differentiate between patients with peripheral artery disease (PAD) and age matched healthy controls2,3.BOLD MRI reflects the T2*-relaxation time and is sensitive to the ratio of oxygenated-/deoxygenated blood in tissue. Changes in T2* in calf muscles can be provoked by inflating a cuff around the thigh (fig. 1) to induce ischemia and a subsequent post-occlusion reactive hyperaemia as the cuff is deflated1.
The T2*-time curve from a calf muscle ROI of a young healthy individual subject to a cuffing paradigm (fig. 2) manifests a typical response pattern (fig. 3). During cuff induced ischemia, T2* will decrease from the resting state baseline level to an ischemic minimum level. As the cuff is deflated, T2* will rapidly increase toward the hyperaemic peak, followed by a slow return to baseline.
The reactive hyperaemic response seen in the T2* time curve after cuff deflation is caused by the stress induced on the muscle cell during lack of oxygen. We hypothesize that the response pattern might depend on the duration of the cuffing since a longer cuffing duration will cause the cells more stress. This study investigates how different cuffing duration times affect the cuffing induced BOLD response.
Materials and Methods
Fourteen healthy volunteers (age : 29 (22-39) years; 5 males) were included. The effect of two different cuffing paradigms (fig. 2) were evaluated for all participants using BOLD MRI. The cuffing paradigms started with a 60 second rest period, after which a cuff placed around the thigh (fig. 1) was inflated initiating a 1.5 or 5 minute ischemic period that followed. The cuff was then deflated and the paradigms continued with a five-minute post-occlusive hyperaemic period. The two different cuffing paradigms were conducted at two separate occasions, at least one week apart. The participants were instructed to avoid any strenuous exercise 24 hours before the experiments.MR images were acquired on a clinical 3T MRI scanner (MAGNETOM Skyra, Siemens Healthineers, Erlangen, Germany) using a large 4-channel receiver flex coil. Before the cuffing paradigms and the T2*-imaging started the participants rested inside the scanner for at least 10 minutes. T2*-maps were generated using multiecho gradient echo data with 11 equidistant echoes between 2 and 40 ms. The T2*-maps had; time resolution: 3.2 seconds, pixel size: 1.25x1.25 mm2, slice thickness: 10 mm.
A region-of-interest (ROI) was manually drawn in the first T2*-image to outline the lateral and medial head of the Gastrocnemius muscle (fig. 3). This ROI was then transferred to consecutive T2*-images through spatiotemporal registration, correcting for subject motion during scanning. ROI-mean T2*-time curves were extracted and plotted to display the level of tissue oxygenation throughout the cuffing paradigm. A parametric model, describing the curve shape was optimized with least-squares fitting to the baseline normalized T2*-time curves, and the parameters time-to-peak (TTP), minimum-ischemic-value (MIV), hyperaemic-peak-value (HPV) and end-value (EV) were derived automatically from the fitted curve (fig. 4). Non-parametric paired tests were performed using Wilcoxon Signed-Rank tests and a significance level = 0.05 for the different curve parameters grouped based on cuffing duration.
Results
Figure 4 shows box-plots of the four curve parameters together with individual datapoints from all the study participants and from both cuffing paradigms. For parameters HPV and TTP, a statistically significant increase was found as the cuffing duration was changed from 1.5 to 5 minutes. MIV and EV did not show any statistically significant differences. However, slight trends toward a decrease for both parameters as the cuffing duration is increased can be seen in the data.Discussion
The statistical analysis showed that the extracted parameters HPV and TTP were sensitive to differences in cuffing duration. This supports our hypothesis, that the duration of which the muscle cells experience ischemia influences response pattern found in the T2* time curve. Two of the parameters compared, MIV and EV, did not show statistically significant differences. For the parameter MIV, this result indicates that the shorter cuff duration was long enough to reach the ischemic T2* level found using the longer cuffing duration. Parameters from peripheral BOLD MRI time curves have previously shown to be of clinical relevance for patients with PAD. Recent studies within the field of peripheral BOLD MRI have presented different cuffing durations ranging from 3-7 minutes4,5. To enable comparison between sites and in the long run to establish clinical guidelines using this imaging tool, the cuffing paradigm needs to be standardised.Conclusion
In this study we have shown that the cuffing duration used to induce ischemia has an effect on T2*-time curve parameters HPV and TTP. This finding is of clinical relevance as the parameters included in this study have the potential to be used to grade severity in diseases affecting the blood supply to the lower limbs.Acknowledgements
No acknowledgement found.References
1. Jacobi B., et al., Skeletal muscle BOLD MRI: from underlying physiological concepts to its usefulness in clinical conditions. J Magn Reson Imaging 2012;35(6):1253-1265.2. Ledermann HP., et al., Blood oxygenation level-dependent magnetic resonance imaging of the skeletal muscle in patients with peripheral arterial occlusive disease. Circulation, 2006;113, 2929–2935.
3. Törngren, K., et al., A Reperfusion BOLD-MRI Tissue Perfusion Protocol Reliably Differentiate Patients with Peripheral Arterial Occlusive Disease from Healthy Controls. J Clin Med, 2021, 10(16), 3643 .
4. Partovi, S., et al., Impaired skeletal muscle microcirculation in systemic sclerosis. Arthritis Res Ther, 2012;(14),R209.
5. Duteil, S., et al., Influence of vascular filling and perfusion on BOLD contrast during reactive hyperemia in human skeletal muscle. Magn Reson Med, 2006. 55(2): p. 450-454.
Figures
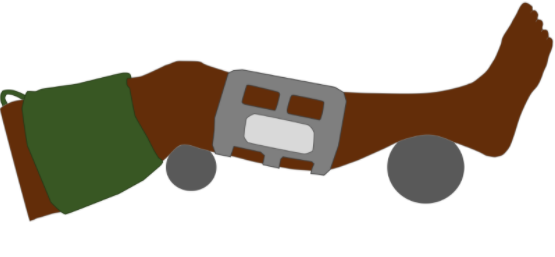
Figure 1. Positioning of the examined leg during MR-imaging. A blood pressure cuff is placed around the thigh to induce ischemia in the lower leg and a flex coil is positioned at the widest part of the calf.
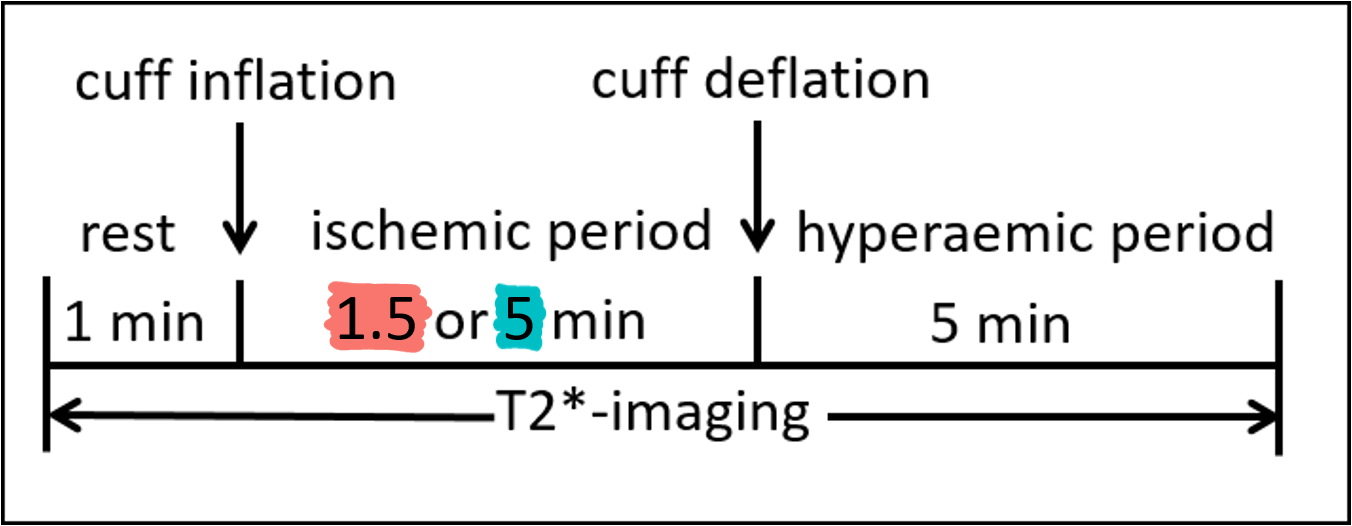
Figure 2. Compression paradigm during T2*-imaging. After 1 minute of baseline imaging the cuff was inflated followed by a 1.5 (red) or 5 (turquoise) minute ischemic period after which the cuff was deflated and followed by a 5 minute hyperaemic period.
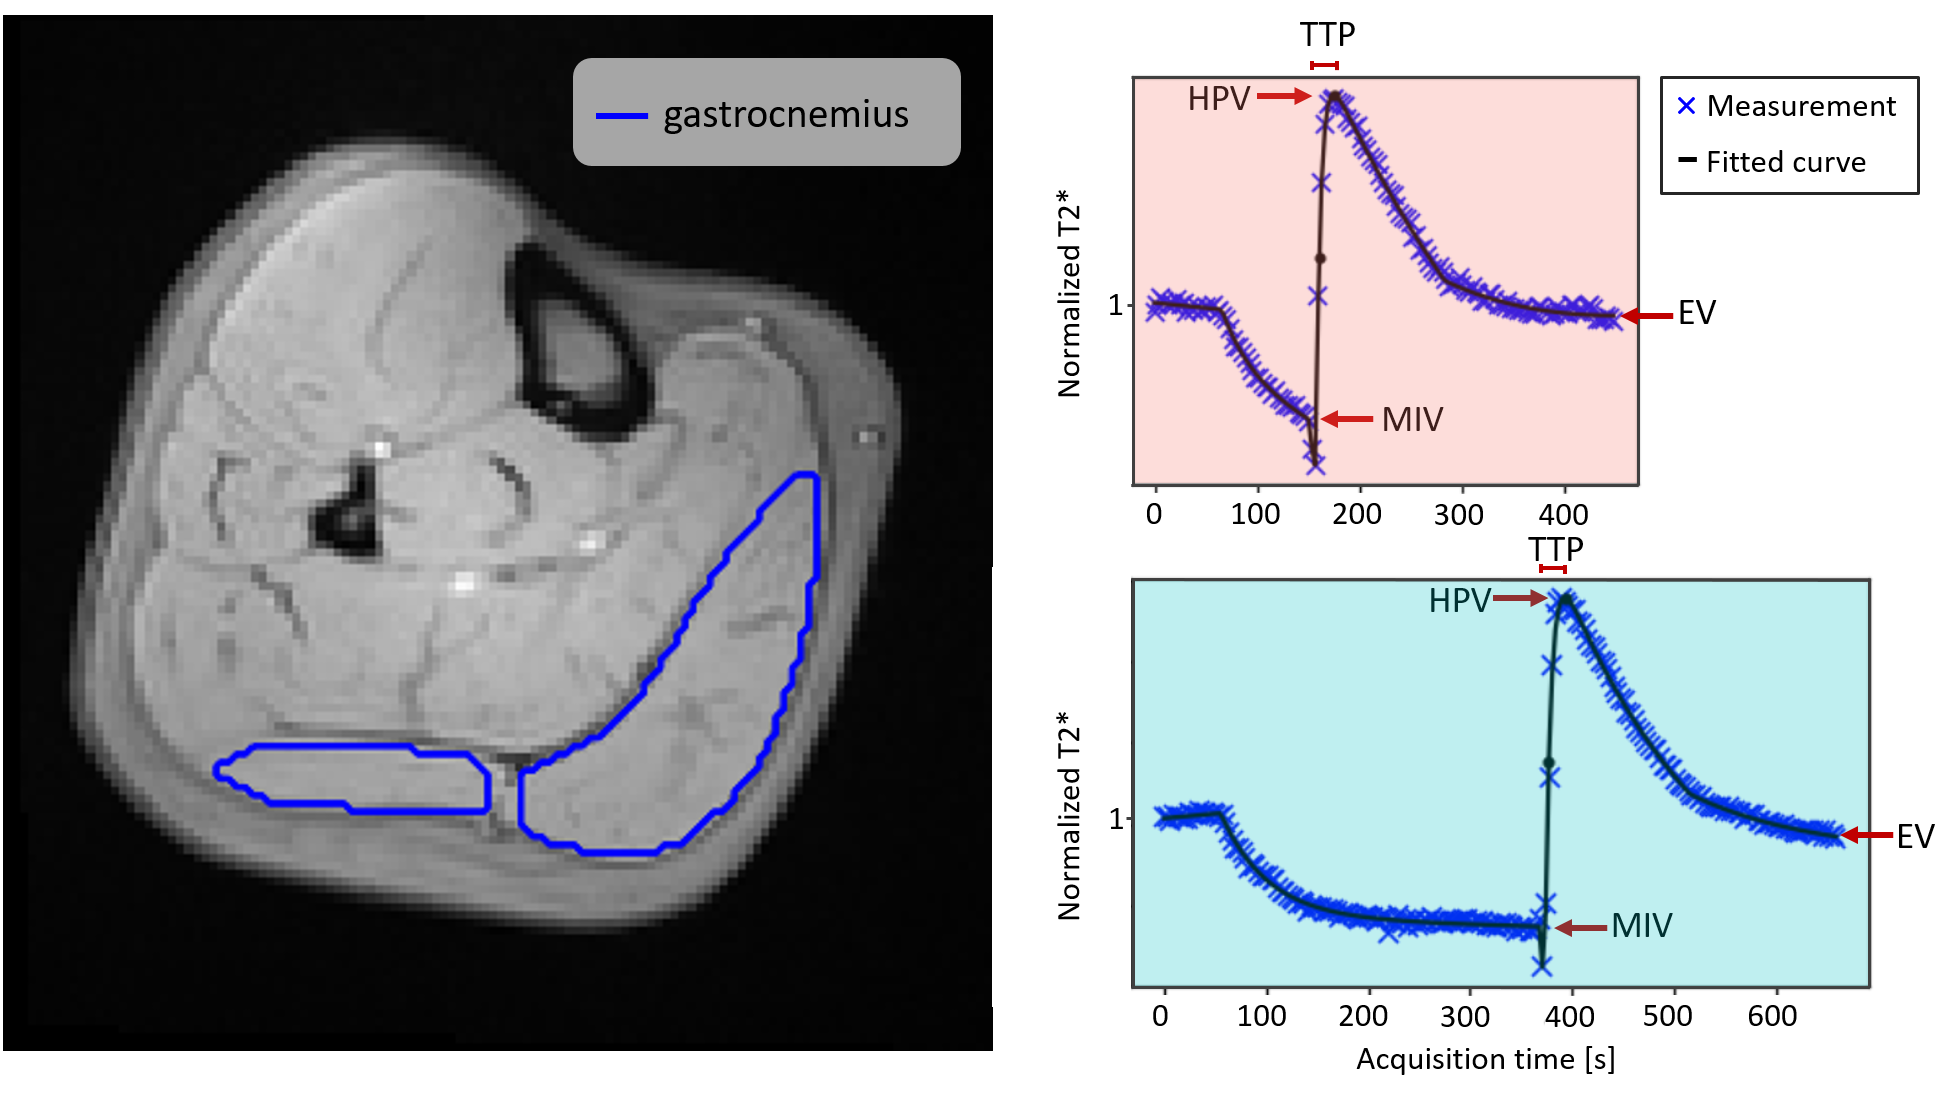
Figure 3. A region of interest (ROI) covering the gastrocnemius muscle (lateral and medial head) drawn on a T2* weighted image (Left). Typical T2*-time curve for the two compression paradigm schemes (Right), 1.5 min compression (red), 5 min compression (turquoise) along with descriptive parameters minimum-ischemic-value (MIV), hyperaemic- peak- value (HPV), time-to-peak (TTP) and end-value (EV).
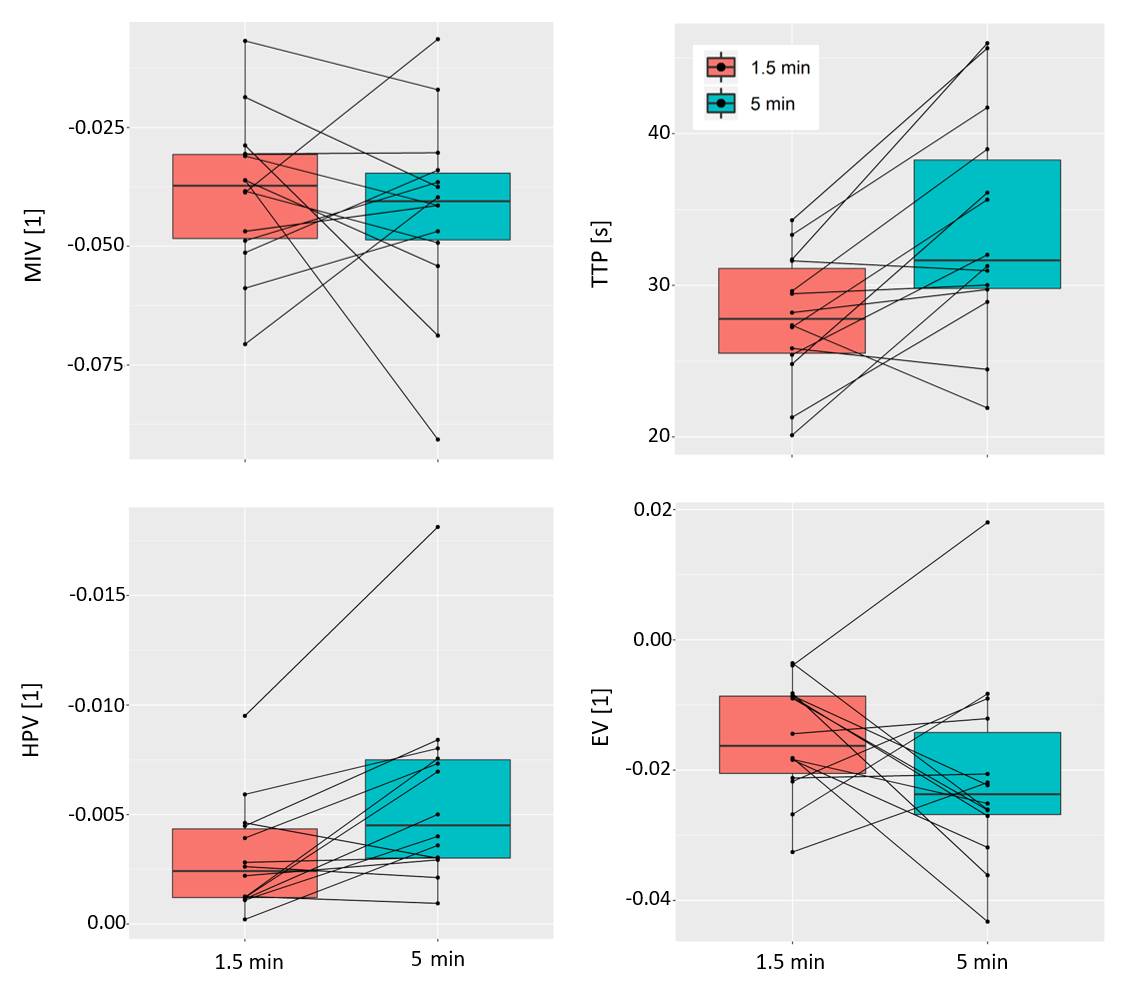
Figure 4. Boxplots and individual parameter estimates from the two paradigms with cuffing durations, 1.5 minutes (red) and 5 minutes (turquoise). The parameters time-to-peak (TTP), hyperaemic-peak-value (HPV) showed statistically significant differences at the significance level 0.05.
DOI: https://doi.org/10.58530/2022/1310