1309
Evaluation of Automatic Processing of Quantitative Perfusion Images in Patients with Suspected Coronary Artery Disease1University of Virginia, Charlottesville, VA, United States, 2Icahn School of Medicine at Mount Sinai, New York, NY, United States, 3Stanford University, Stanford, CA, United States
Synopsis
We developed high resolution quantitative perfusion sequence, along with DCNN network to automatically segment the image sets for motion correction. We deployed the acquisition and post-processing on patients with suspected coronary artery disease and compared the results to their coronary angiography findings. Our sequence and processing successfully match the angiography results.
Introduction
Quantitative first-pass myocardial perfusion imaging has great diagnostic and prognostic utility in coronary artery disease (CAD)1,2, which affects 15.5 million patients in the US and is responsible for 1 in 7 deaths3. While CMR is the advantageous imaging modality for cardiac exams due to high spatial and temporal resolution, CMR is sensitive to motion. Furthermore, manual processing of the imaging sets is time-intensive and produces intra-/inter-user variability. We previously developed a pulse sequence4 to overcome the acquisition limitations, as well as an automatic pipeline5 for the post processing. We deployed our acquisition and pipeline to evaluate their robustness in patients with suspected CAD.Methods
Figure 1 summarizes the pipeline. 27 patients underwent adenosine stress CMR exams for the evaluation of CAD on a 3T scanner (MAGNETOM Prisma or Skyra) with a Dotarem bolus (0.075 mmol/kg) after a three-minute adenosine infusion (140μg/kg/min). First pass quantitative perfusion imaging sets were acquired with our interleaved spiral, dual contrast, ultra-high resolution quantitative perfusion sequence6. We designed our spirals as 4 interleaves (4 ms each), with the center 20% of the trajectory fully-sampled before decreasing the end density to 0.05x Nyquist. The imaging parameters were: FOV 340mm, TE/TR 1.0/7.0 ms, and SRT 90 ms, with 6 slices (thickness=10mm) for whole-heart coverage. 4 PD images were acquired before the T1-weighted image sets. Tissue function (TF) images had flip angles of 5o/15o and the AIF had flip angles of 15o/45o for their PD/T1w images, respectively. Additionally, the AIF images were 2x accelerated single-shot spiral trajectories, with 6.95 mm2 in-plane resolution and with an SRT of 10 ms.We reconstructed the images using L1-SPIRiT4 by defining the sparsity transform as the finite temporal difference (Figure 2). Manual contours were drawn for all frames for both the training set and validation to train a 2D U-Net7 for myocardial segmentation8. The output contours were then used as a direct input for deformable ANTs9 registration of the image set. Signal intensity was converted to gadolinium concentration10, where the PD images were denoised by a Poisson NL means filter11. The arterial input function (AIF) ROI was chosen through classification of the LV and RV, where the blood pools were thresholded from the AIF image stack and ranked by their time curve characteristics12,13.
Dictionaries were made on a per-patient basis through defining a coarse grid of Fermi values, then convolving each with the chosen AIF5. The Fermi14 function is defined as: $$$R_F(t)=\frac{A}{k\cdot exp(t-t_0-\tau)+1}$$$, where t0 is the contrast arrival time, A is the amplitude scale factor, and k and tau are Fermi shape parameters. This dictionary was used as an initial guess for model-fitting through linear least squares between the dictionary and each voxel’s time curve. The previous contours from the motion correction were then used to segment the myocardium into the standard AHA format. The AHA segments were then analyzed for their lowest per-vessel stress MBF, patient stress MBF, and patient MPR by first taking the mean of 2 contiguous segments within each vessel15. These results were compared against each patient’s coronary angiography scores.
Results
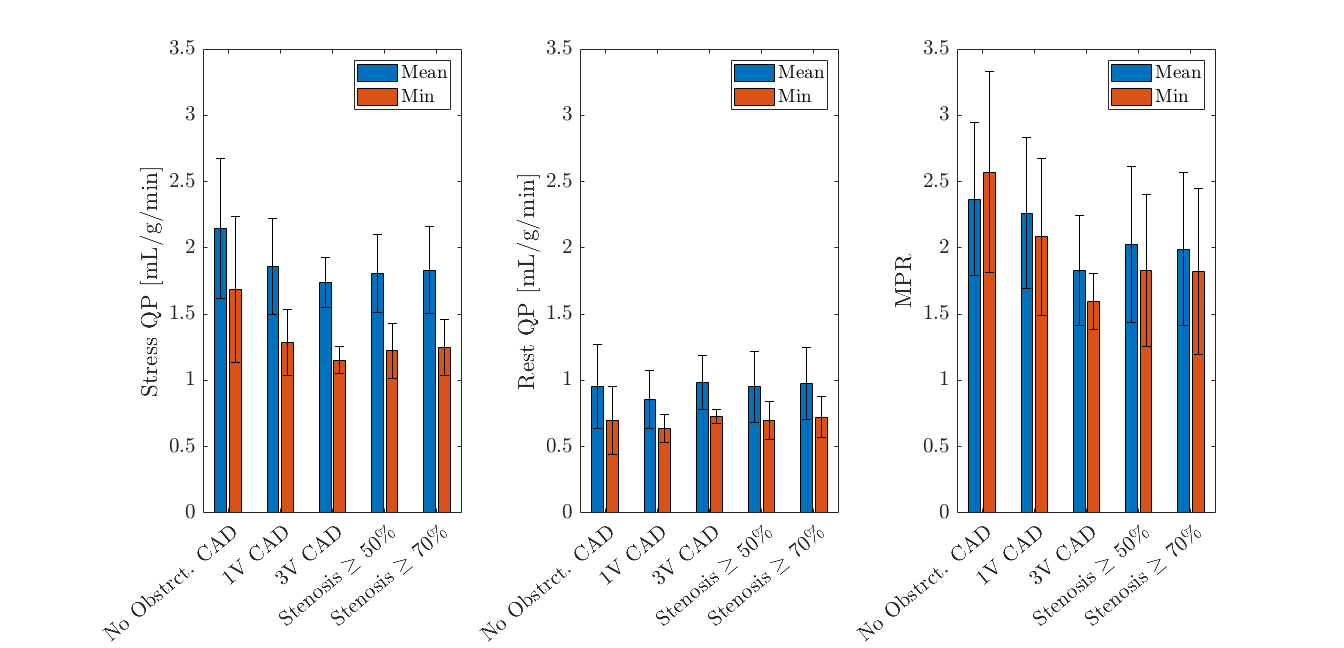
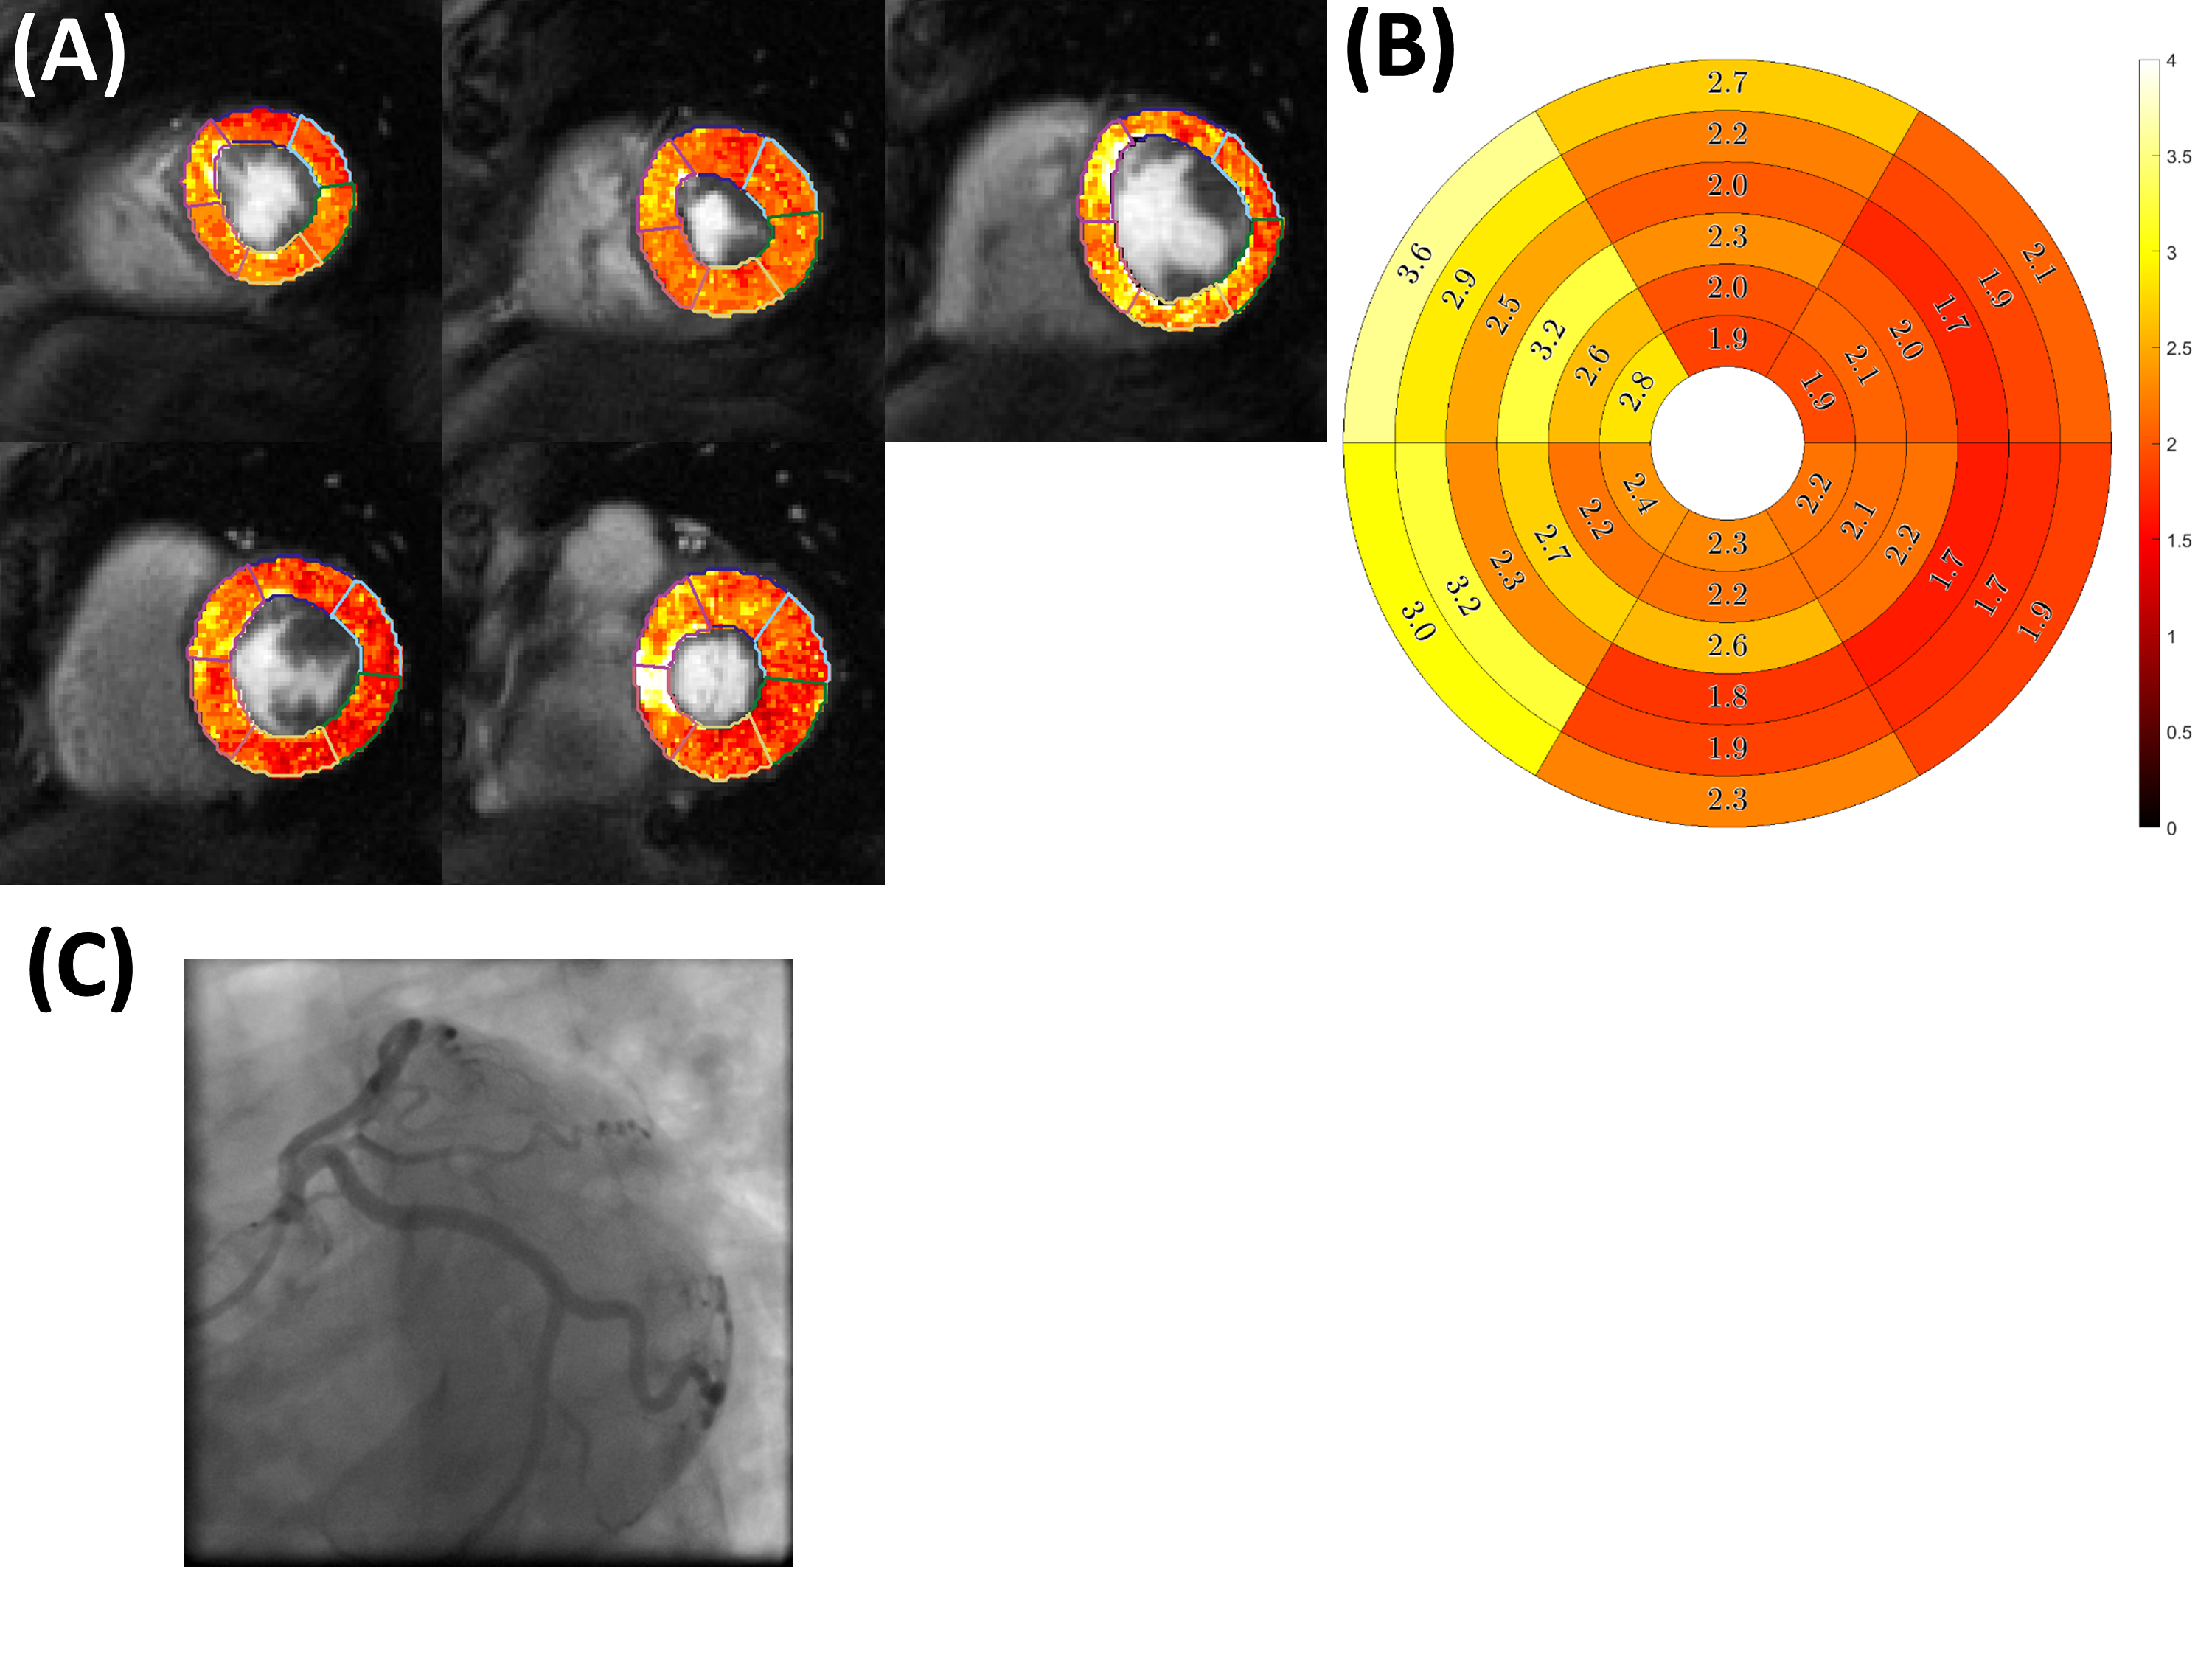
Figure 2 summarizes the preliminary patient data for their stress quantitative perfusion, rest quantitative perfusion, and MPR values on a per-patient basis. Figure 3 is an example of a patient with chronic total occlusion of the LAD, which is denoted by the white arrows on the quantitative perfusion imaging maps and the yellow arrows on the coronary angiography images. The defect is clearly seen in the LAD territory in the quantitative perfusion image, where the stress quantitative perfusion values are reduced in the anterior, anteroseptal, and apical regions. Figure 4 is an example of a patient who did not have coronary artery disease. The quantitative perfusion values are similar for the segments, while the coronary angiography had negative findings for stenosis in the LAD, LCX, and RCA.Discussion
The automatic pipeline successfully segments and corrects for motion in patients with suspected coronary artery disease. The segments associated with stenosis from their coronary angiographies had reduced quantitative perfusion values.Conclusion
We evaluated our automatic processing pipeline for first-pass myocardial perfusion, which employs DCNN-based automatic LV segmentation for ANTs registration. The high-resolution acquisition and processing pipeline successfully quantifies perfusion defects, as are validated by the coronary angiography findings.Acknowledgements
This work was supported by NIH R01 HL079110 and T32 EB003841.References
1. Salerno, M. Seeing the Unseen Fibrosis in Heart Failure with Preserved Ejection Fraction. JACC Cardiovasc. Imaging 7, 998–1000 (2014).
2. Nandalur, K. R., Dwamena, B. A., Choudhri, A. F., Nandalur, M. R. & Carlos, R. C. Diagnostic performance of stress cardiac magnetic resonance imaging in the detection of coronary artery disease: a meta-analysis. J. Am. Coll. Cardiol. 50, 1343–1353 (2007).
3. Mozaffarian, D. et al. Heart disease and stroke statistics--2015 update: a report from the American Heart Association. Circulation 131, e29-322 (2015).
4. Yang, Y., Kramer, C. M., Shaw, P. W., Meyer, C. H. & Salerno, M. First-pass myocardial perfusion imaging with whole-heart coverage using L1-SPIRiT accelerated variable density spiral trajectories. Magn. Reson. Med. 76, 1375–1387 (2016).
5. Van Houten, Matthew. Automatic quantification of ultra-high resolution quantitative first-pass perfusion imaging using deep-learning based segmentation and MOCO. (2020).
6. Yang Yang, Robinson, Austin, Mathew, Roshin, Kramer, Christopher, & Salerno, Michael. Initial Clinical Evaluation of Quantitative Ultra-high Resolution First-pass Spiral Perfusion Imaging with Whole Heart Coverage in Patients with Ischemic Heart Disease at 3T. (2019).
7. Çiçek, Ö., Abdulkadir, A., Lienkamp, S. S., Brox, T. & Ronneberger, O. 3D U-Net: Learning Dense Volumetric Segmentation from Sparse Annotation. ArXiv160606650 Cs (2016).
8. Feng, X., Tustison, N., Qing, K., Kramer, C. & Meyer, C. Robust tissue tracking from cardiac cine MRI with deep-learning-based fully automatic myocardium segmentation. in the Joint Annual Meeting ISMRM-ESMRBM (2018).
9. Tustison, N. J., Yang, Y. & Salerno, M. Advanced Normalization Tools for Cardiac Motion Correction. in Statistical Atlases and Computational Models of the Heart - Imaging and Modelling Challenges 3–12 (Springer, Cham, 2014). doi:10.1007/978-3-319-14678-2_1.
10. Cernicanu, A. & Axel, L. Theory-Based Signal Calibration with Single-Point T1 Measurements for First-Pass Quantitative Perfusion MRI Studies. Acad. Radiol. 13, 686–693 (2006).
11. Deledalle, C.-A., Tupin, F. & Denis, L. Poisson NL means: Unsupervised non local means for Poisson noise. in 2010 IEEE International Conference on Image Processing 801–804 (IEEE, 2010). doi:10.1109/ICIP.2010.5653394.
12. Jacobs, M., Benovoy, M., Chang, L.-C., Arai, A. E. & Hsu, L.-Y. Evaluation of an automated method for arterial input function detection for first-pass myocardial perfusion cardiovascular magnetic resonance. J. Cardiovasc. Magn. Reson. 18, (2016).
13. Yin, J., Sun, H., Yang, J. & Guo, Q. Automated detection of the arterial input function using normalized cut clustering to determine cerebral perfusion by dynamic susceptibility contrast-magnetic resonance imaging. J. Magn. Reson. Imaging 41, 1071–1078 (2015).
14. Jerosch-Herold, M., Wilke, N., Stillman, A. E. & Wilson, R. F. Magnetic resonance quantification of the myocardial perfusion reserve with a Fermi function model for constrained deconvolution. Med. Phys. 25, 73–84 (1998).
15. Pan, J. A. et al. Diagnostic Accuracy of Spiral Whole-Heart Quantitative Adenosine Stress Cardiovascular Magnetic Resonance With Motion Compensated L1-SPIRIT. J. Magn. Reson. Imaging 54, 1268–1279 (2021).
16. Broadbent, D. A. et al. Myocardial blood flow at rest and stress measured with dynamic contrast-enhanced MRI: Comparison of a distributed parameter model with a fermi function model. Magn. Reson. Med. 70, 1591–1597 (2013).
Figures