1306
Pulmonary transit time derived from routine perfusion cardiac magnetic resonance scans for non-invasive assessment of hemodynamics1Clinic for radiology and nuclear medicine, Universitätsspital Basel, Basel, Switzerland, 2Clinic for cardiology, Universitätsspital Basel, Basel, Switzerland
Synopsis
Pulmonary transit time (PTT) derived from routine cardiac magnetic resonance perfusion scans is a robust and easily obtainable noninvasive parameter of hemodynamics. PTT correlates with both LVEF, RVEF and NT-proBNP and could serve as a new global non-invasive parameter with a discriminative character for detecting cardiopulmonary dysfunction. We demonstrate that PTT has a high diagnostic accuracy in terms of exclusion and inclusion of heart failure as assessed by NT-proBNP, even in patients with preserved LVEF and RVEF.
Introduction
Chronic and acute heart failure (HF) are major cause of death and disability. For chronic HF mortality rates approach 20 % per year despite medical therapy1. Acute HF represents the major cause of hospitalization in the elderly population2. Natriuretic peptides such as N-terminal pro B-type natriuretic peptide (NT-proBNP) are well established, accurate quantitative blood biomarkers of haemodynamic cardiac stress and predominantly used in the early diagnosis and management of HF3. Currently, natriuretic peptides and echocardiography are mainly used to detect and quantify heart failure3.Often, patients with heart failure are referred for stress-perfusion cardiovascular magnetic resonance imaging (CMR) for evaluation of ischaemic vs. other non-ischaemic aetiologies. CMR perfusion sequences can be used to measure pulmonary transit time (PTT), i.e. the time it takes blood to pass from the right ventricle via lungs to the left ventricle. PTT is a parameter to estimate preload, blood volumes, and global ventricular function and might be suitable to quantify the severity of congestive heart failure4,5. In this study, we investigated the clinical feasibility, inter-rater variability (robustness) of PTT and agreement between PTT and NT-proBNP in routine CMR perfusion scans. We hypothesize that PTT has a high diagnostic accuracy in terms of exclusion and inclusion of HF as assessed by NT-proBNP, even in patients with preserved left and right ejection fraction – a currently challenging task in clinical routine3.Methods
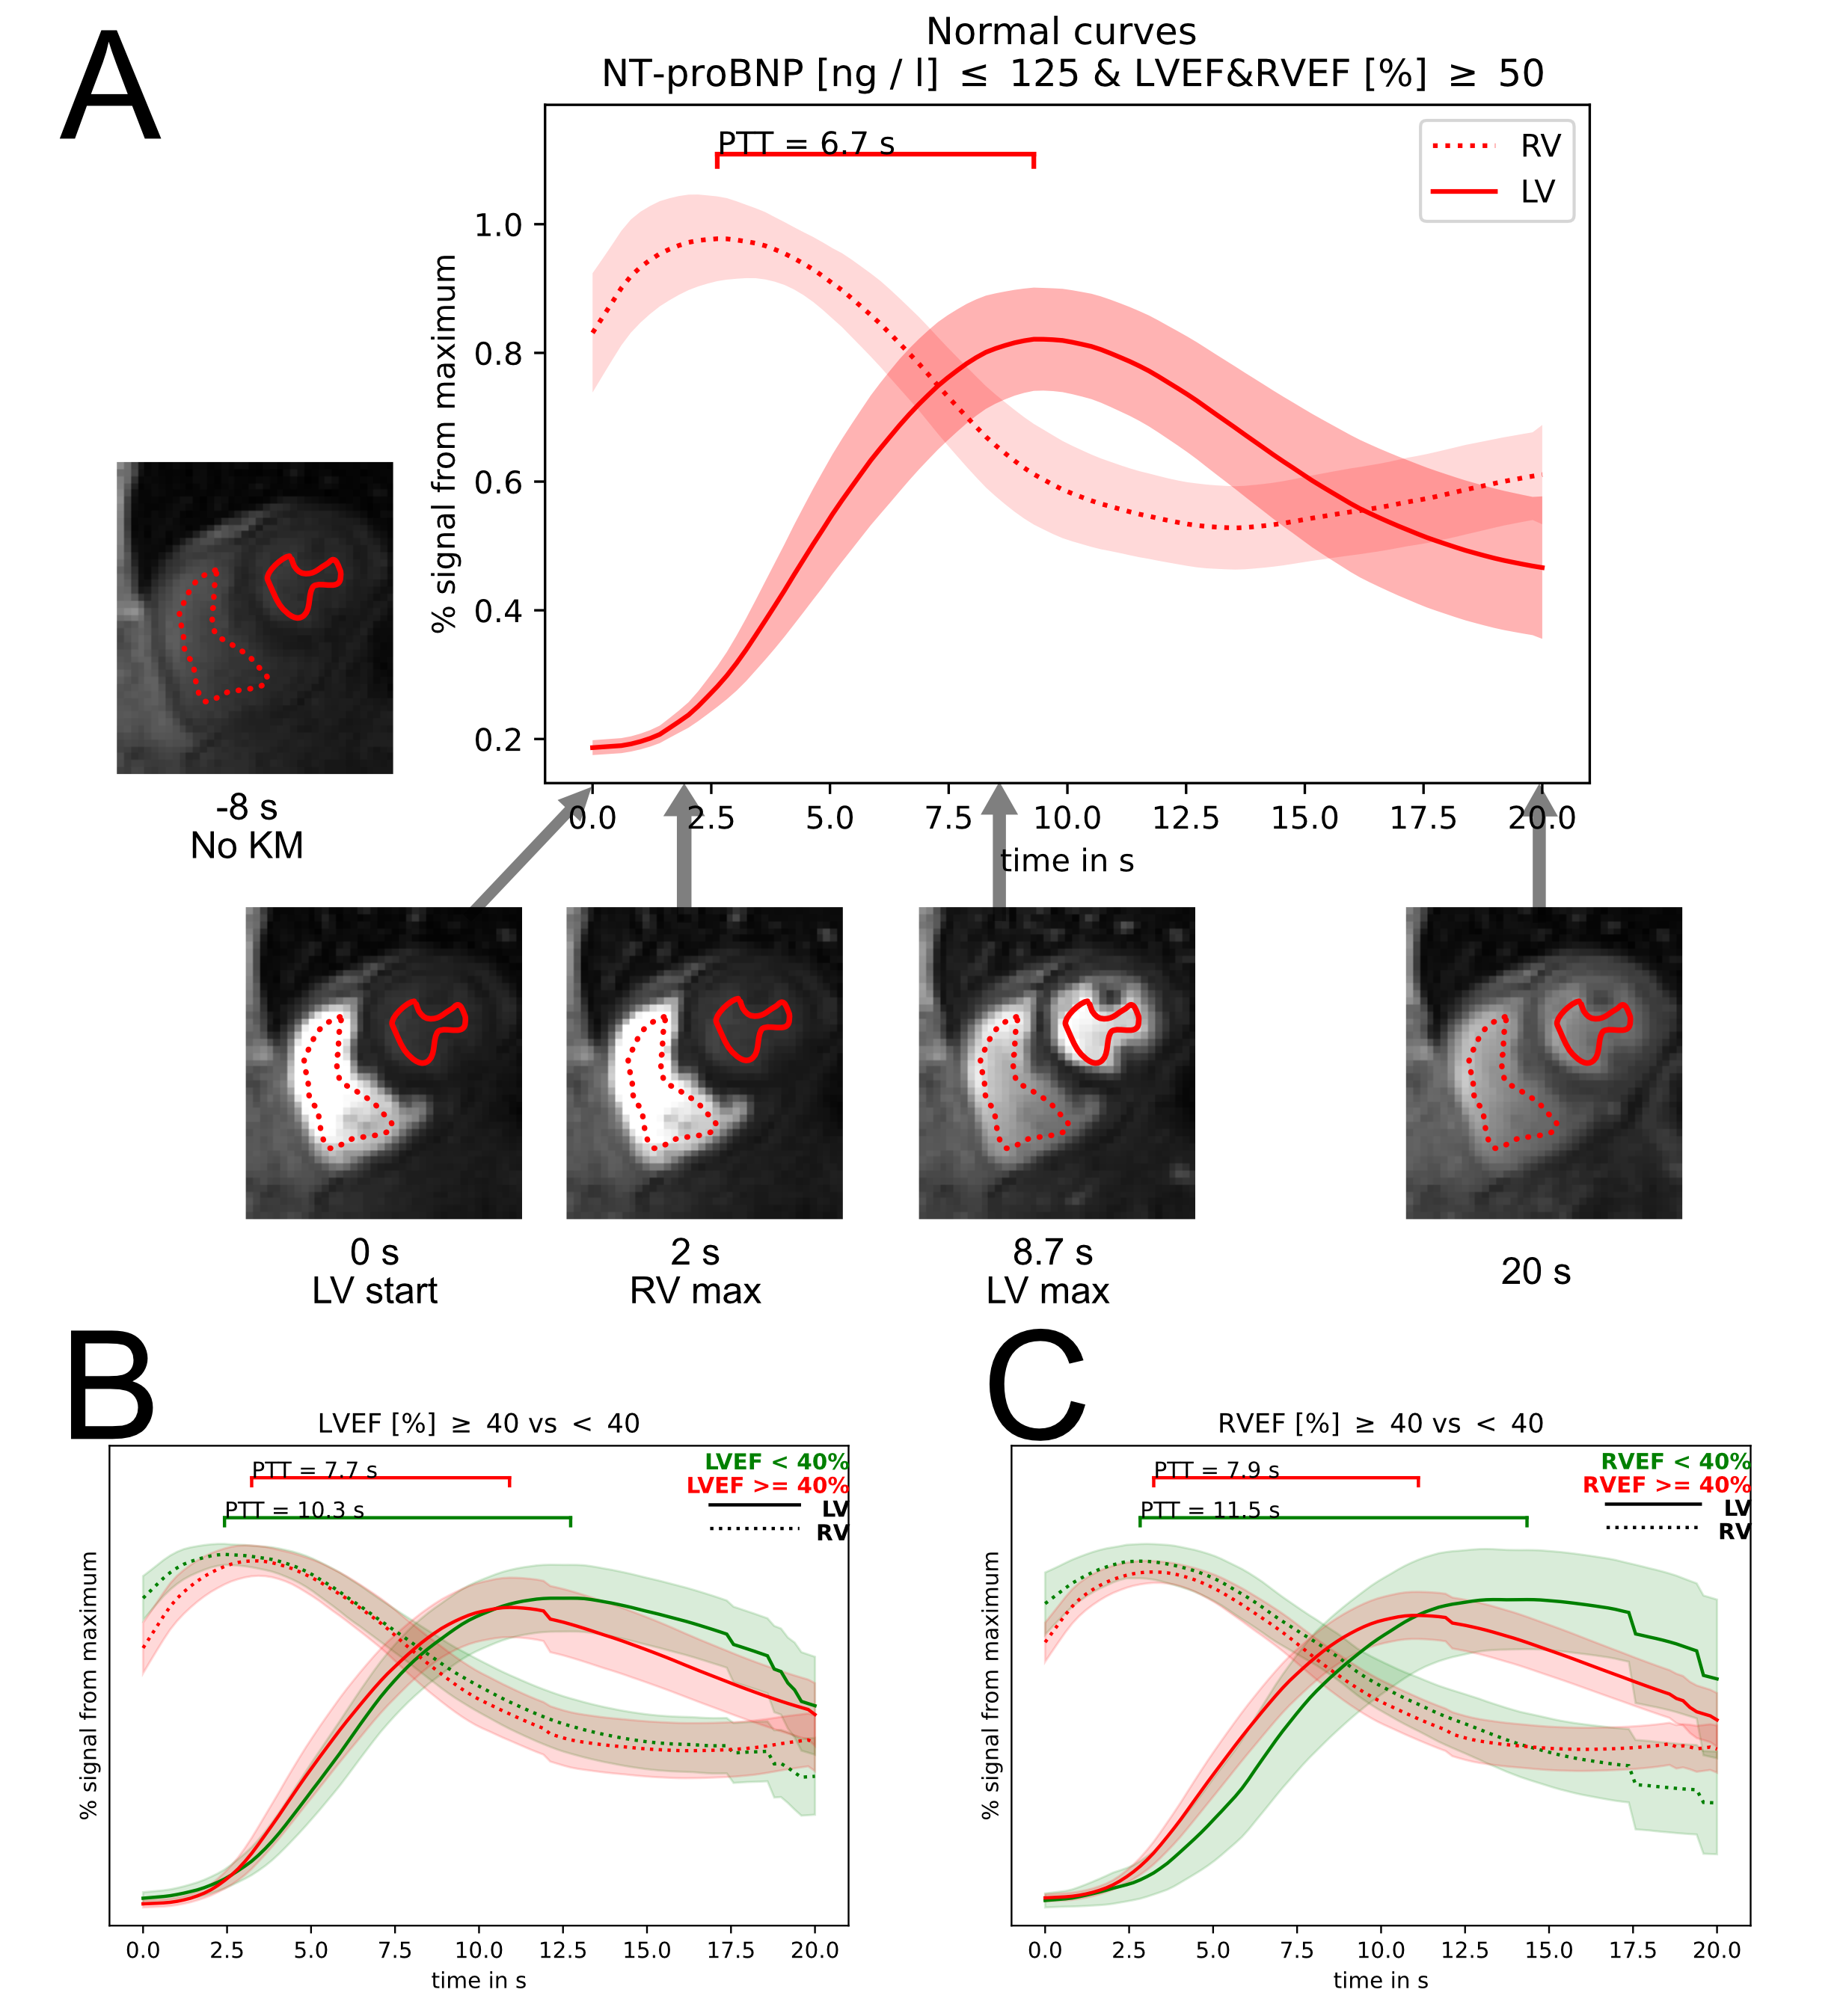
This was a retrospective, single-center study. Patients with dyspnea and/or suspicion of myocardial ischemia were referred for routine adenosine stress perfusion CMR. A bolus of 1 mmol/kg gadoterate meglumine at a 4 ml/s flow-rate was used. All patients had NT-proBNP analyses within 72 hours. CMR studies were performed on a 1.5 T or 3 T (Siemens Avanto and Skyra, Siemens Healthineers, Germany). Two physicians independently evaluated the rest routine cardiac MRI perfusion scans and placed regions of interest (ROIs) in the left (LV) and right (RV) ventricle. PTT was defined as the time in seconds between peak signal intensities of the time signal curves of the RV and LV (Figure 1A). PTT normalized for heart rate (nPTT) was defined as PTT x heart rate. Continuous variables were reported as means ± SD when normally distributed and as median (interquartile range [IQR]) if not. Comparisons were performed using a 2-tailed unpaired Student’s t-test or a rank sum test depending on the distribution. Correlations were assessed using Pearson’s or Spearman’s rank correlation. The diagnostic accuracy was assessed by receiver operating characteristics (ROC) curves.Results
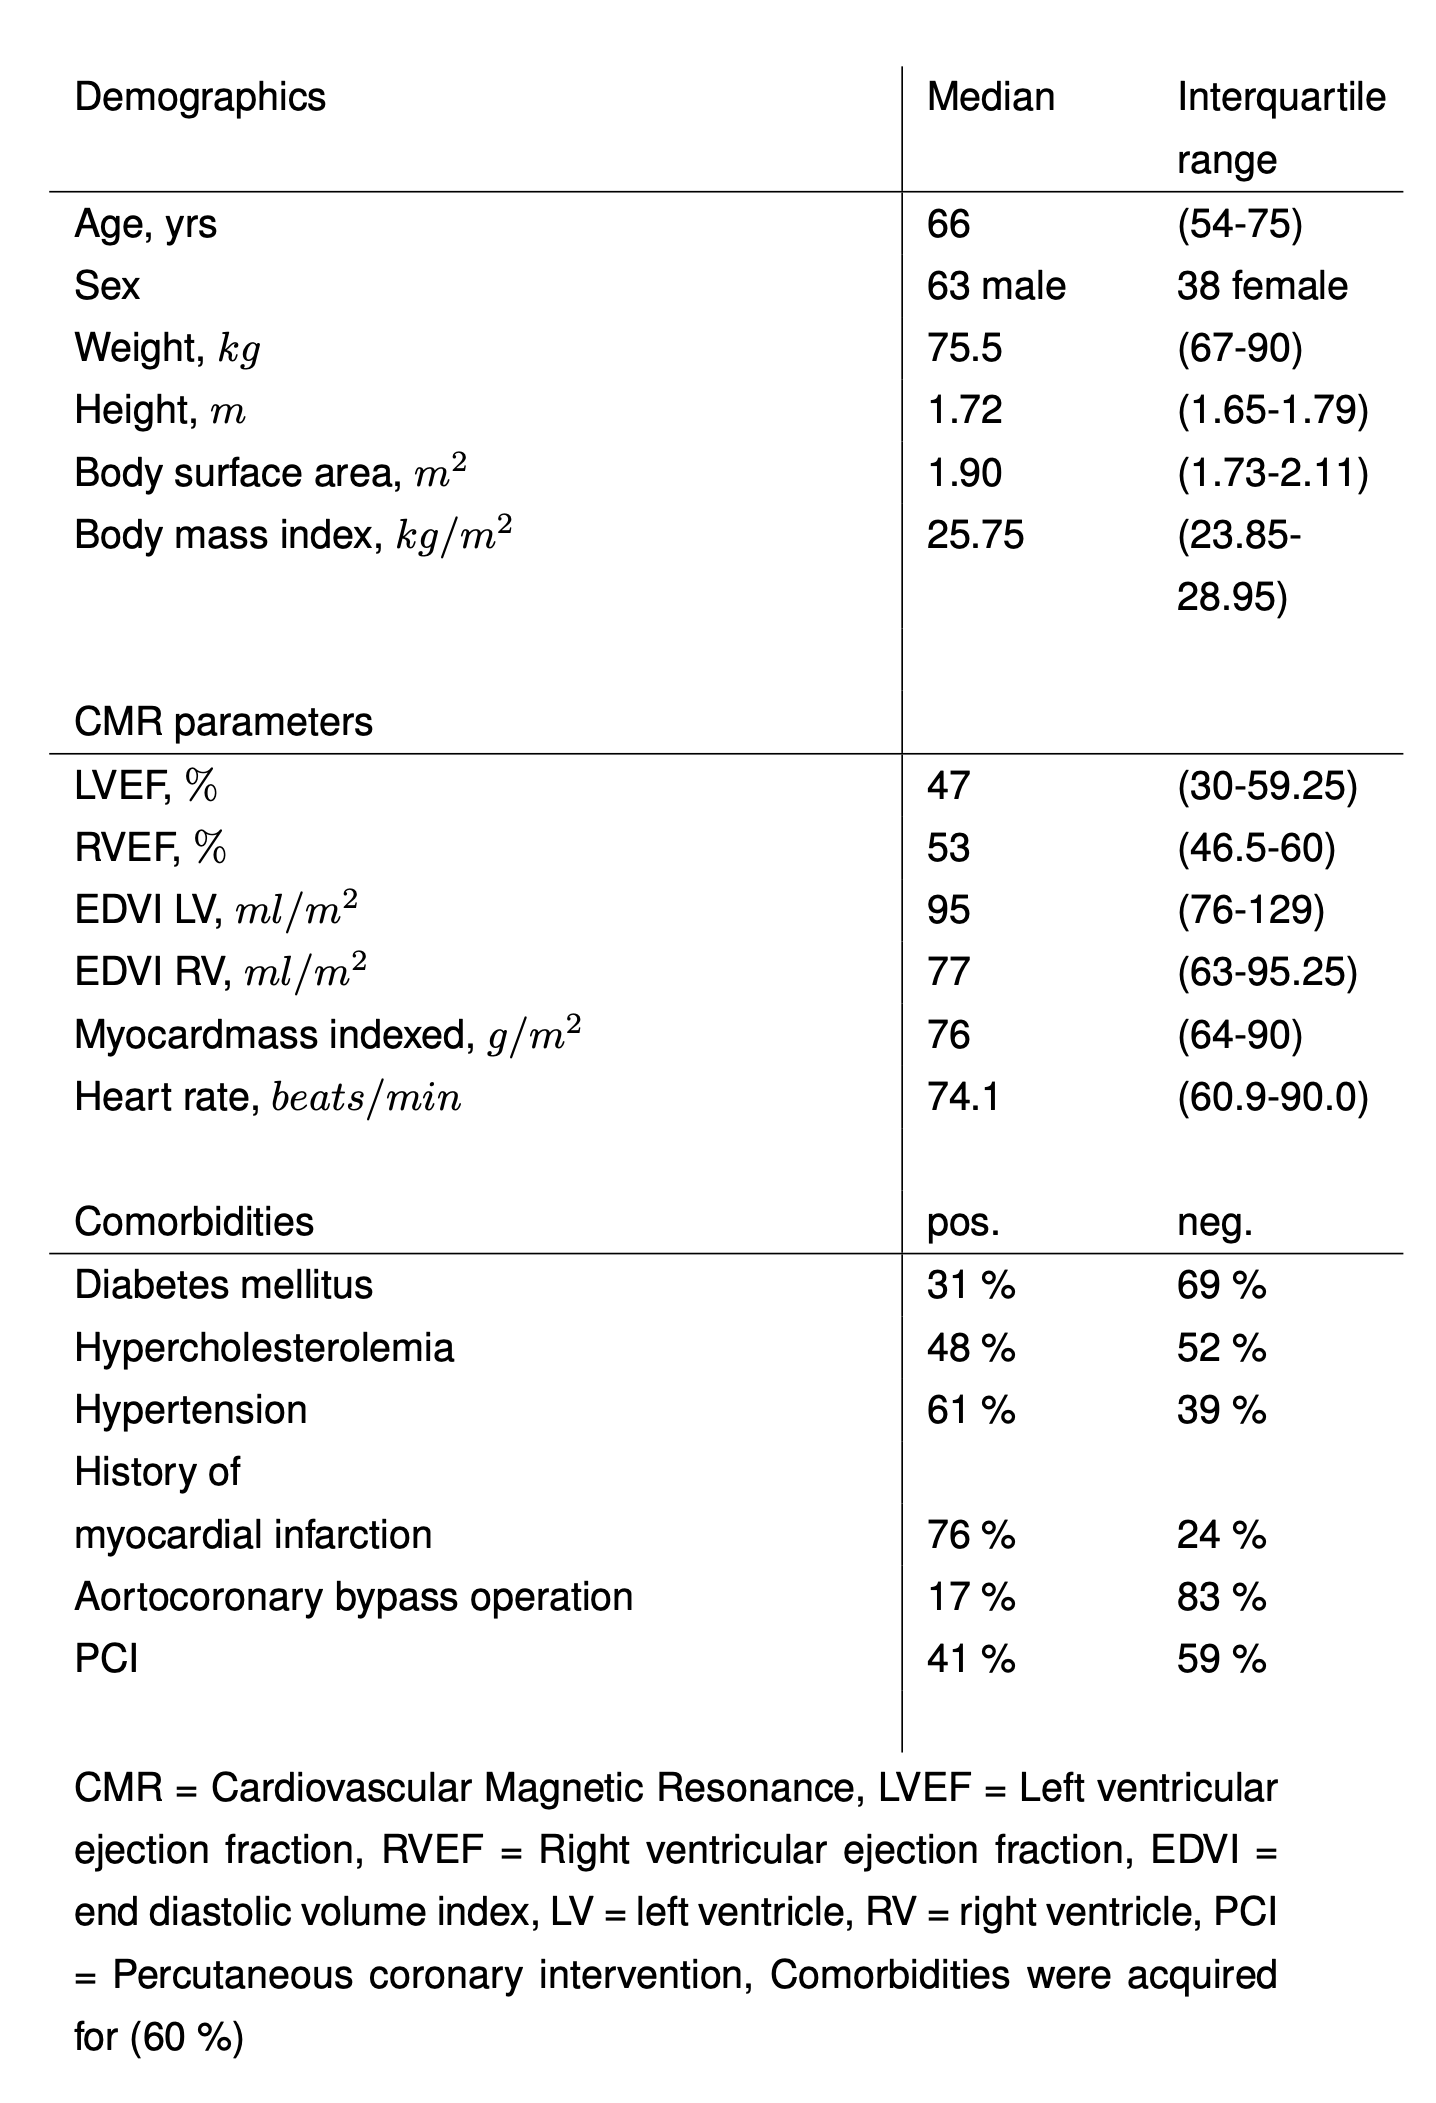
101 patients were enrolled in the study. Baseline characteristics are illustrated in (Figure 2). The median time between MRI acquisition and NT-proBNP acquisition was 30.2 h (IQR: 19 to 46.6 h).Inter-rater variability of PTT and correlation with cardiac parameters
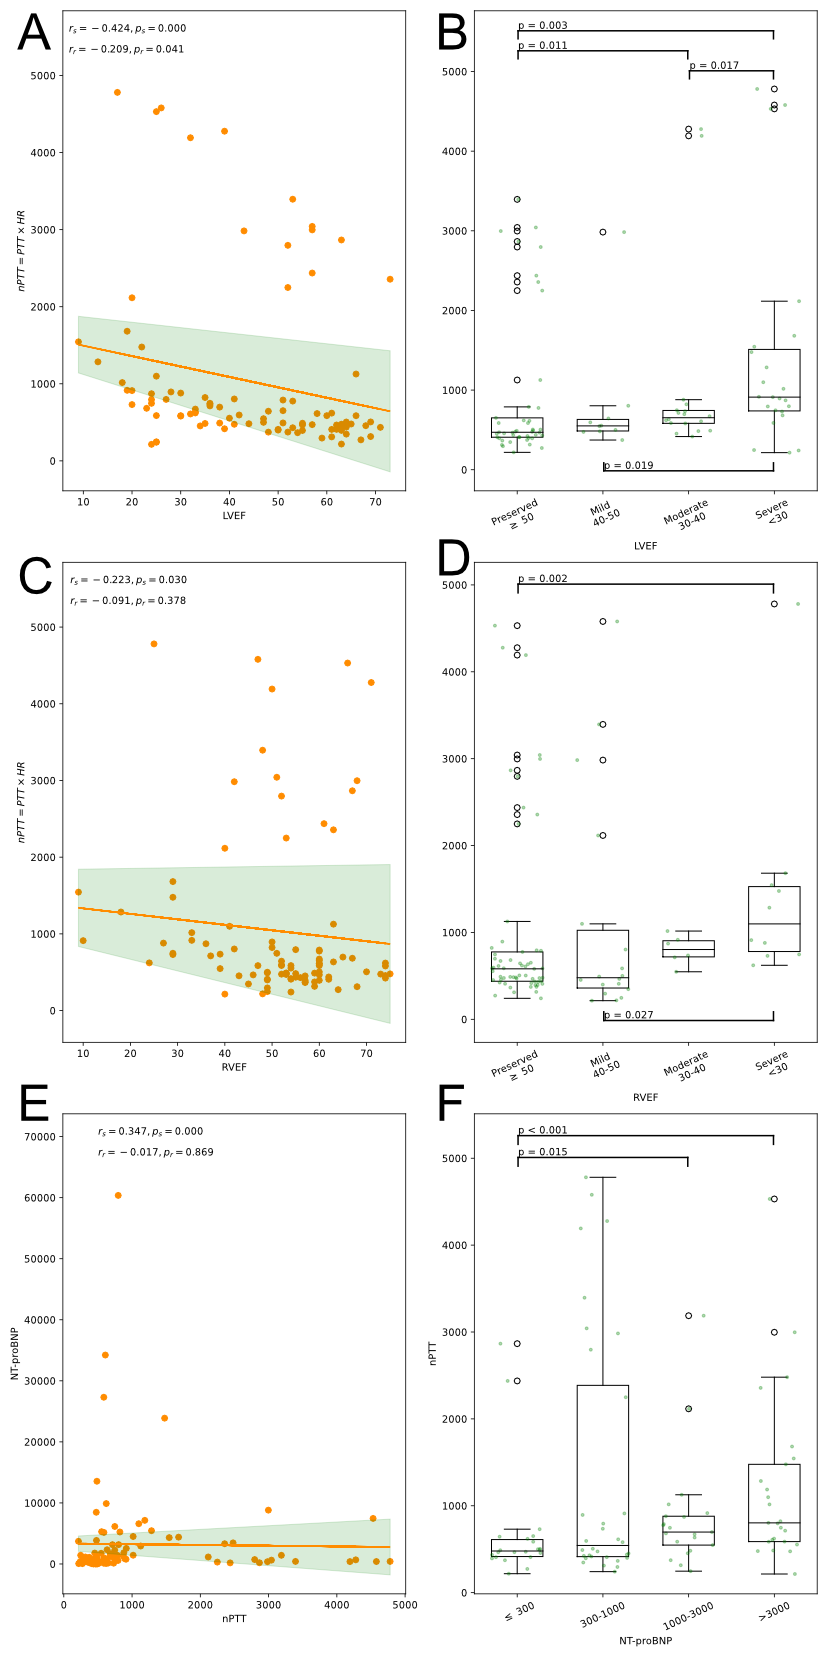
PTT has been obtained in less than one minute per patient. The median PTT was 7.9 s (IQR: 6.7 to 11.8 s) and the median nPTT was 614 (IQR: 456 to 1015). The inter-rater difference was 0.03 s (CI: -0.11 to 0.18 s) with a correlation of 0.99 (p < 0.0001). Similar results were found for the nPTT. The median NT-proBNP was 823.5 (IQR: 320.25 to 299.75). High NT-proBNP correlated significantly with prolonged nPTT (p < 0.001) (Figure 3E,F). The median LVEF and RVEF were 47 % (IQR: 30 to 59 %) and 53 % (IQR: 46.5 to 60 %). Lower LVEF and RVEF correlated with a prolonged nPTT (Figure 3A,B,C,D). The median PTT for patients with normal NT-proBNP and preserved LVEF and RVEF was 6.9 s (IQR: 6.1 to 7.5 s) (Figure 1A). Patients with a LVEF < 40 % and RVEF < 40 % had an PTT of 9.2 s (IQR 7.3 to 13.3 s) and 11.2 s (IQR 8.6 to 15.6 s) (Figure 1B,C).
PTT for evaluation of HF as assessed by NT-proBNP
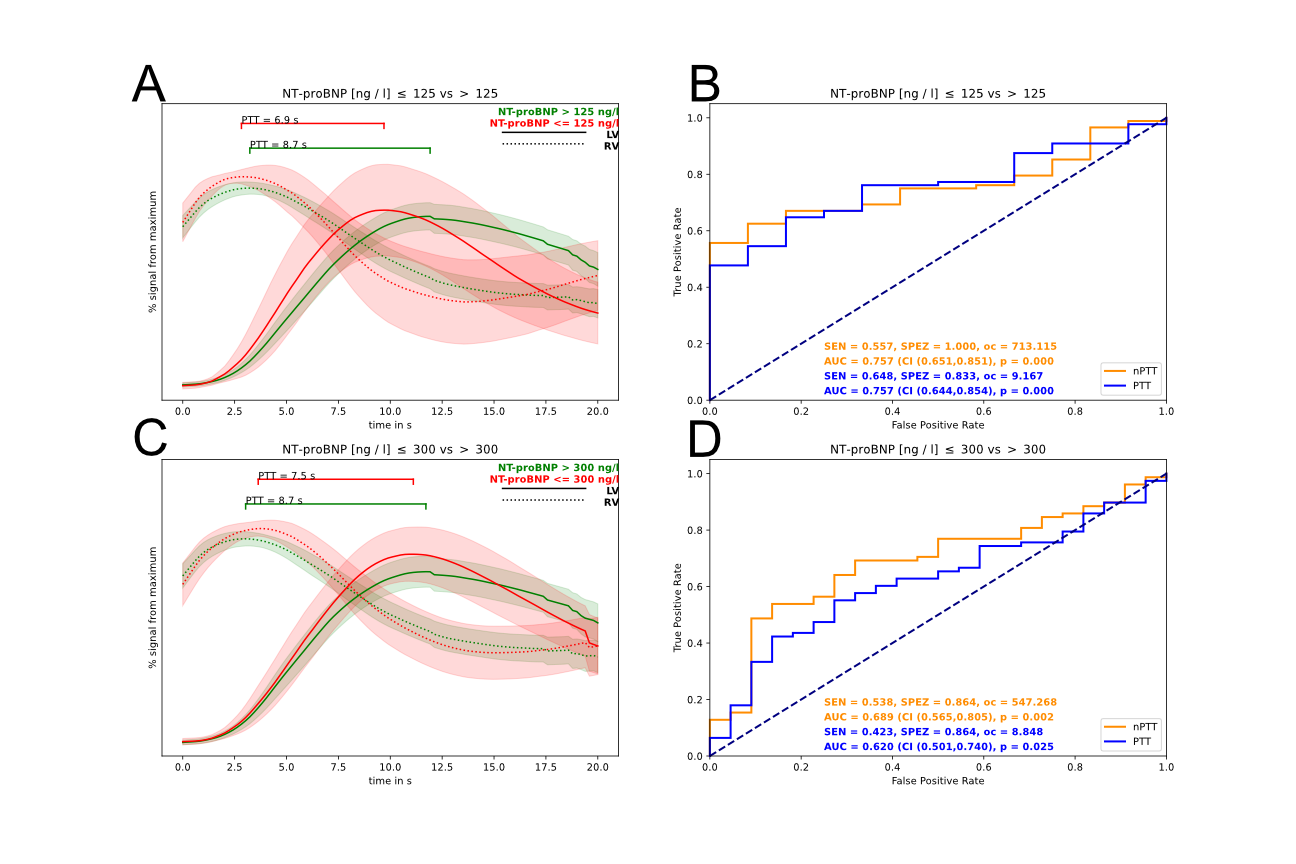
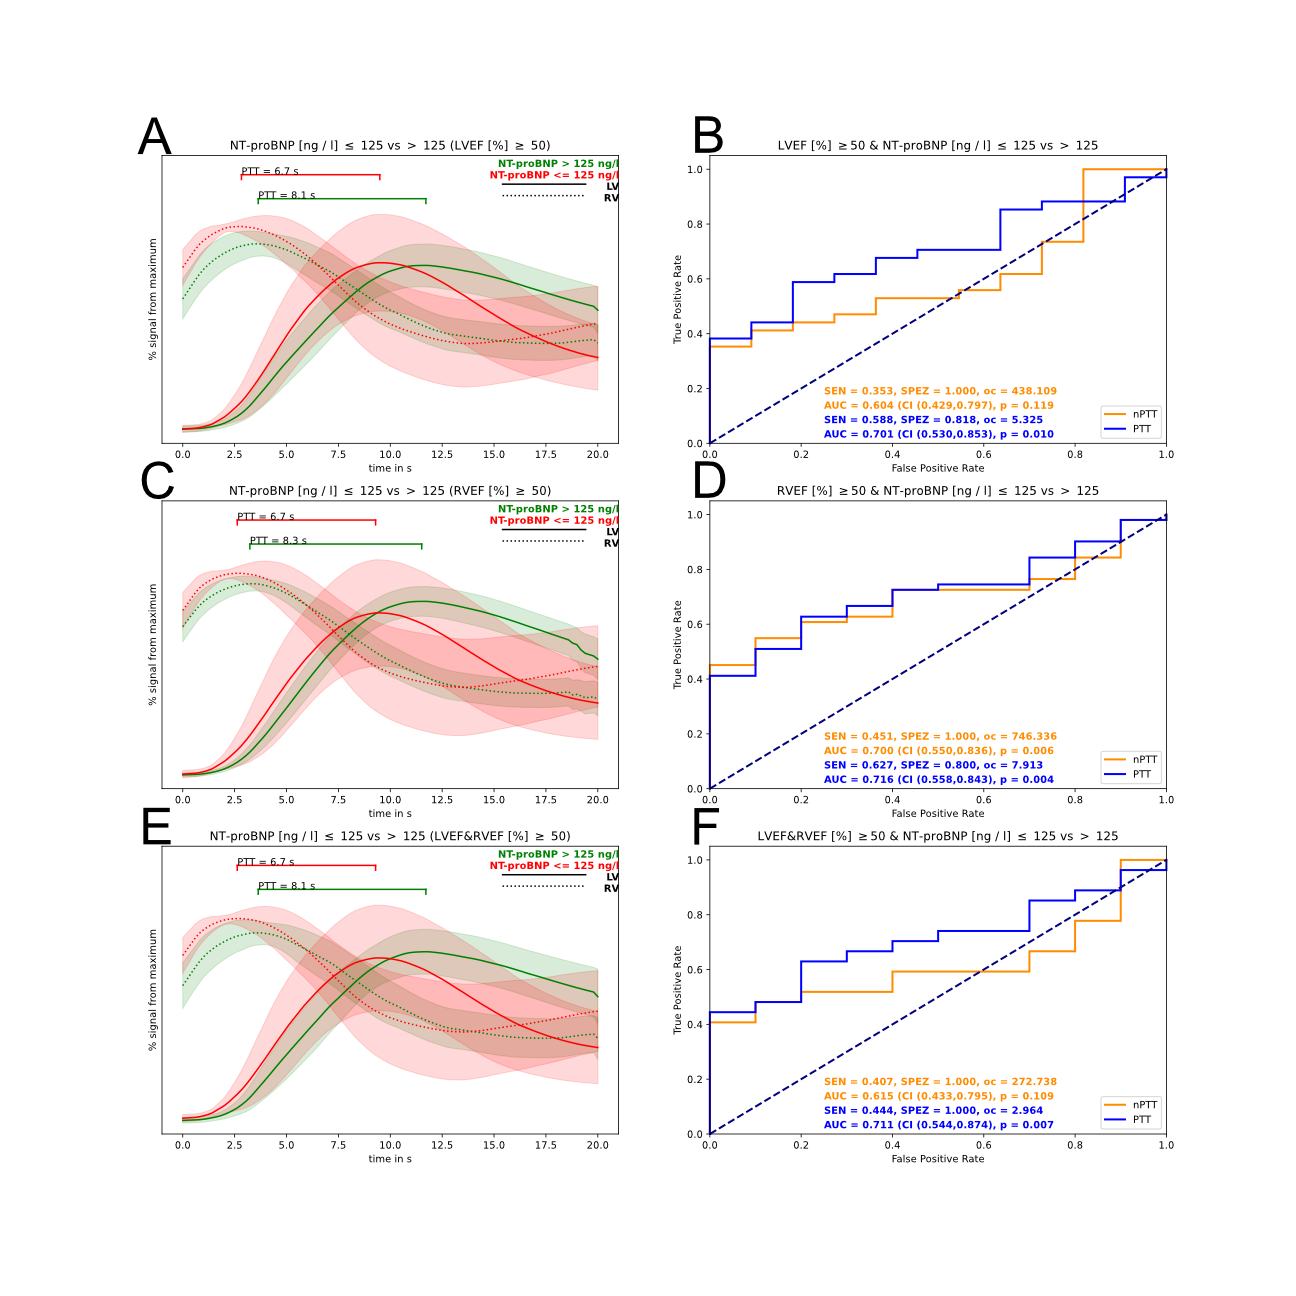
For exclusion of HF (NT-proBNP < 125 ng/L), the areas under the curve (AUC) of the ROC analyses of PTT and nPTT were 0.77 (CI 0.66 to 0.87; p < 0.001) and 0.76 (CI 0.65 to 0.85; p < 0.001) (Figure 4A,B). For inclusion of HF (NT-proBNP > 300 ng/L), the AUCs for PTT and nPTT were 0.632 (CI 0.511 to 0.750; p = 0.017) and 0.692 (CI 0.572 to 0.805; p = 0.001) (Figure 4C,D). For the subpopulation with a preserved LVEF and RVEF (≥ 50%), PTT showed a significantly high specificity and sensitivity for exclusion of HF (Figure 5).
Discussion
We demonstrated the clinical feasibility and robustness of measuring PTT in routine CMR perfusion scans. PTT correlated with both LVEF, RVEF and NT-proBNP and could serve as a new global non-invasive parameter with a discriminative character for detecting cardiopulmonary dysfunction. Furthermore, PTT had a high diagnostic accuracy in terms of exclusion and inclusion of HF as assessed by NT-proBNP, even in patients with preserved LVEF and RVEF.Conclusion
PTT is an easily obtainable and robust parameter of cardiac haemodynamic. It might help in the inclusion or exclusion of heart failure with high diagnostic accuracy.Acknowledgements
No acknowledgement.References
1. Pocock, S.J., et al., Predictors of mortality and morbidity in patients with chronic heart failure. Eur Heart J, 2006. 27(1): p. 65-75.
2. Farmakis, D., et al., Acute heart failure: Epidemiology, risk factors, and prevention. Rev Esp Cardiol (Engl Ed), 2015. 68(3): p. 245-8.
3. McDonagh, T.A., et al., 2021 ESC Guidelines for the diagnosis and treatment of acute and chronic heart failure. Eur Heart J, 2021. 42(36): p. 3599-3726.
4. Dock, D.S., et al., The pulmonary blood volume in man. J Clin Invest, 1961. 40: p. 317-28.
5. Herold, I.H., et al., Pulmonary transit time measurement by contrast-enhanced ultrasound in left ventricular dyssynchrony. Echo Res Pract, 2016. 3(2): p. 35-43.
Figures