1303
Investigating the influence of ECG-triggering and respiration strategy on renal perfusion quantification using arterial spin labelling
Irène Brumer1, Simon Jonscher1, Indre Gineitaite1, Rebeca Echeverria-Chasco2, Lothar R. Schad1, María Asunción Fernández-Seara2, and Frank G. Zöllner1
1Computer Assisted Clinical Medicine, Mannheim Institute for Intelligent Systems in Medicine, Medical Faculty Mannheim, Heidelberg University, Mannheim, Germany, 2Department of Radiology, Clínica Universidad de Navarra, Pamplona, Spain
1Computer Assisted Clinical Medicine, Mannheim Institute for Intelligent Systems in Medicine, Medical Faculty Mannheim, Heidelberg University, Mannheim, Germany, 2Department of Radiology, Clínica Universidad de Navarra, Pamplona, Spain
Synopsis
In this study, we investigated the influence of ECG-triggering and respiration strategy choice on renal perfusion. To this end, pCASL data of healthy volunteers was acquired at 3T. Acquisitions and processing followed the PARENCHIMA consensus. Processing consisted of groupwise registration, manual whole kidney segmentation and automated cortex/medulla segmentation. All calculated perfusion values were close to the expected range for healthy individuals. Preliminary results from four subjects suggest the influence of cardiac cycle is negligible and the choice of respiration strategy has little effect on renal perfusion values calculated from pCASL data, however additional data is necessary for more complete evaluation.
Introduction
Due to its non-invasive nature, arterial spin labelling (ASL) is a valuable technique for perfusion quantification especially in patients with poor kidney function or requiring multiple follow-ups. The consensus on ASL imaging in kidneys (PARENCHIMA)1 reached last year, offers helpful guidance on how to acquire and process ASL data and greatly supports ongoing research in the field. Nevertheless, several factors potentially influencing ASL-based renal perfusion quantification have not yet been evaluated in detail. Therefore, we set up a study in healthy volunteers to assess the influence of electrocardiogram (ECG) -triggering and respiration strategy and present preliminary results in the following sections.Methods
Data from four healthy volunteers (26±1.8 y/o, 2 female and 2 male) was acquired at 3T (MAGNETOM Skyra, Siemens Healthineers, Erlangen, Germany). The study was approved by the local ethics committee (UMM Ethik Komission II). For each subject, four ASL datasets (1 M0, 25 control-label pairs) were acquired using a pseudo-continuous ASL (pCASL) 2D SE-EPI sequence1,2: free breathing (FB), FB with ECG-triggering, synchronised breathing (SB), SB with ECG-triggering. The trigger was set on the peak of the R-wave and no trigger delay was used. Acquisition parameters are listed in Table 1. Data processing consisted of registration, perfusion quantification and segmentation following recommendations1. For each subject, rectangles were manually drawn around left and right kidney to define the area to be used for registration. Groupwise registration of all ASL images was performed for left and right kidney separately using a PCA-based metric3 and a 3 levels (2 2 0 2 2 0 1 1 0) multi-resolution approach within Elastix4,5. Mean perfusion-weighted (\Delta M) images were calculated by pairwise subtraction of control-label pairs followed by averaging and used in the perfusion quantification formula1:$$rbf [mL/100g/min] = \frac{6000 \cdot \lambda \cdot \Delta M \cdot e^{-PLD/T_1}}{2 \cdot \alpha \cdot M0 \cdot T_1 \cdot (1-e^{-\tau/T_1})}$$
With the blood-tissue partition coefficient $$$\lambda$$$=0.9mL/g, the post labelling delay $$$PLD$$$=1200ms, the blood relaxation time $$$T_1$$$=1650ms, the labelling efficiency $$$\alpha$$$=0.85*0.932 (accounting for the two background suppression pulses played out after labelling), the proton-density weighted baseline image M0, and the labelling duration $$$\tau$$$=1600ms. Manual segmentation of the whole kidneys was performed on the registered M0 image. The manual segmentation masks were then eroded using [0 0 0 1 1; 0 1 1 0 0; 0 0 1 0 0; 1 1 0 0 0] and [1 1 0 0 0; 0 0 1 0 0; 0 0 1 1 0; 0 0 0 1 1] as structuring elements for left and right kidney, respectively. Cortex and medulla segmentation was then performed for left and right kidney separately using a k-means clustering approach on the perfusion map masked by the eroded whole kidney masks. All processing steps were done in MATLAB 2020a (The MathWorks, Inc., Natick, Massachusetts, USA).
Results
Perfusion maps calculated for volunteer 1 are shown in Figure 1. Mean perfusion values for each ASL dataset of all volunteers are shown in Figure 2. In most cases, mean perfusion values from the four acquisition methods are within the range of standard deviation of one another, showing no clear difference between different breathing and triggering strategies. The evolution of perfusion-weighted signal for each acquisition method are shown in Figure 3 for volunteer 2. No distinct difference in signal evolution pattern can be recognised between the four acquisition methods. Temporal SNR values for all acquisitions and volunteers are listed in Table 2. The temporal SNR varies little between acquisition methods.Discussion
Perfusion values for all volunteers are close to the expected range of 151±37/mL/100g/min for the whole kidney6, and 278±55mL/100g/min and 55±25mL/100g/min for cortex and medulla, respectively7. Differences between range of perfusion values, perfusion-weighted signal evolution and temporal SNR are minor. These preliminary results suggest that the choice of respiration strategy and ECG triggering has little impact on renal perfusion quantification using pCASL but additional datasets are necessary for a more accurate evaluation. Though no published study has yet investigated the effect of cardiac cycle on renal perfusion quantification using ASL, a few studies have assessed the influence of the cardiac cycle on measured cerebral perfusion8-14. While some of these studies showed improved stability of perfusion values when using ECG-triggering, others found no significant difference between triggered and non-triggered acquisitions. The choice of using an ECG-triggered acquisition or not should be decided with respect to the scanning duration. In our study, we found the acquisition to be prolonged by up to 150 seconds when using ECG-triggering compared to non-triggered acquisitions lasting 270 seconds in total. Our analysis will be expanded to additional subjects to assess which of these four acquisition methods is best for use in the clinical routine, where a compromise between acquisition duration, patient compliance and results always has to be found.Conclusion
Preliminary results from four healthy subjects suggest that ECG-triggering and choice of respiration strategy have little impact on quantification of renal blood flow using arterial spin labelling, however additional data is necessary for a more complete evaluation.Acknowledgements
No acknowledgement found.References
1. Nery F, Buchanan CE, Harteveld AA, et al. Consensus-based technical recommendations for clinical translation of renal ASL MRI. Magn Reson Mater Phys. 2020;33(1):141-1612. Echeverria‐Chasco R, Vidorreta M, Aramendía‐Vidaurreta V, et al. Optimization of pseudo‐continuous arterial spin labeling for renal perfusion imaging. Magn Reson Med. 2021;85(3):1507-1521.
3. Huizinga W, Poot DH, Guyader JM, et al. PCA-based groupwise image registration for quantitative MRI. Med Image Anal. 2016;29:65-78.
4. Klein S, Staring M, Murphy K, et al. Elastix: a toolbox for intensity-based medical image registration. IEEE 2009; 29(1):196-205.
5. Shamonin DP, Bron EE, Lelieveldt BP, et al. Fast parallel image registration on CPU and GPU for diagnostic classification of Alzheimer's disease. Front Neuroinform 2014;7:50.
6. Conlin CC, Oesingmann N, Bolster Jr B, Het al. Renal plasma flow (RPF) measured with multiple-inversion-time arterial spin labeling (ASL) and tracer kinetic analysis: Validation against a dynamic contrast-enhancement method. Magn Reson Imaging 2017;37:51-55.
7. Roberts DA, Detre JA, Bolinger L, et al. Renal perfusion in humans: MR imaging with spin tagging of arterial water. Radiol 1995;196(1):281-286.
8. Wu W-C, Mazaheri Y, Wong EC. The effects of flow dispersion and cardiac pulsation in arterial spin labeling. IEEE 2006;26.1:84-92.
9. Wu W-C, Edlow BL, Elliot MA, et al. Physiological modulations in arterial spin labeling perfusion magnetic resonance imaging IEEE 2009;28.5:703-709.
10. Fushimi Y, Okada T, Yamamoto A, et al. Timing dependence of peripheral pulse‐wave‐triggered pulsed arterial spin labeling. NMR Biomed 2013;26.11:1527-1533.
11. Verbree J, van Osch MJP. Influence of the cardiac cycle on pCASL: cardiac triggering of the end-of-labeling. Magn Resone Mater Phys 2018;31.1:223-233.
12. Li Y, Mao D, Li Z, et al. Cardiac‐triggered pseudo‐continuous arterial‐spin‐labeling: a cost‐effective scheme to further enhance the reliability of arterial‐spin‐labeling MRI. Magn Reson Med 2018;80.3:969-975.
13. Franklin SL, Schmid S, Bos C, et al. Influence of the cardiac cycle on velocity selective and acceleration selective arterial spin labeling. Magn Reson Med 2020;83.3:872-882.
14. Schollenberger J, Figueroa CA, Nielsen JF, et al. Practical considerations for territorial perfusion mapping in the cerebral circulation using super‐selective pseudo‐continuous arterial spin labeling. Magn Reson Med 2020;83.2:492-504.
Figures
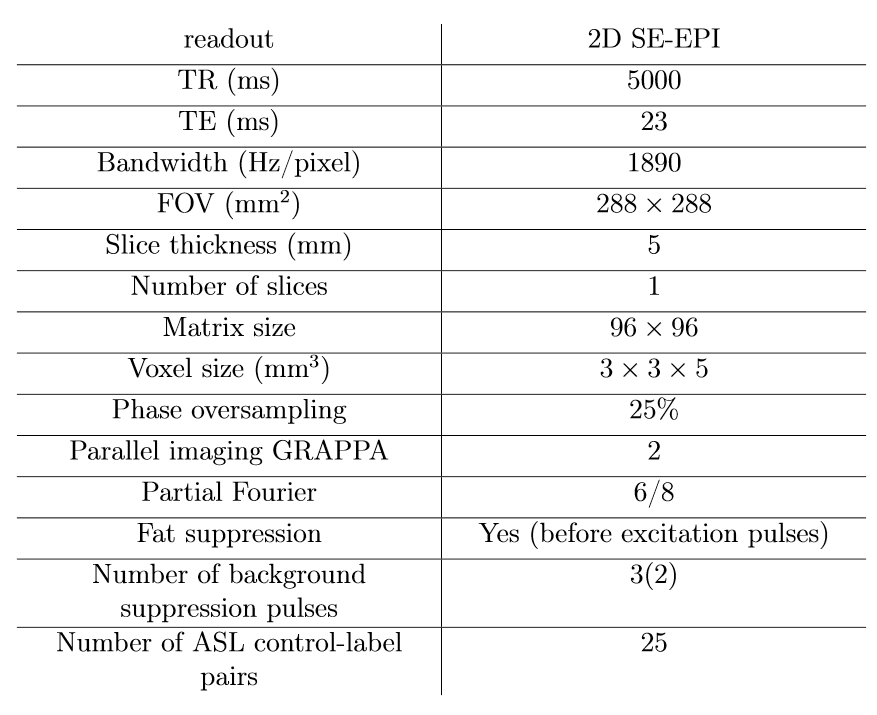
Table 1:
Acquisition parameters for the pCASL SE-EPI sequence. Three background
suppression pulses are included but only two of these are played out between
labelling and readout and have to be taken into account for perfusion
quantification.

Figure
1: Perfusion maps overlaid on registered M0 image for volunteer 1.

Figure
2: Mean perfusion values and standard deviations for left and right kidneys for
all volunteers.

Figure
3: Signal evolution of mean perfusion-weighted image across the different control-label
pairs for volunteer 2.
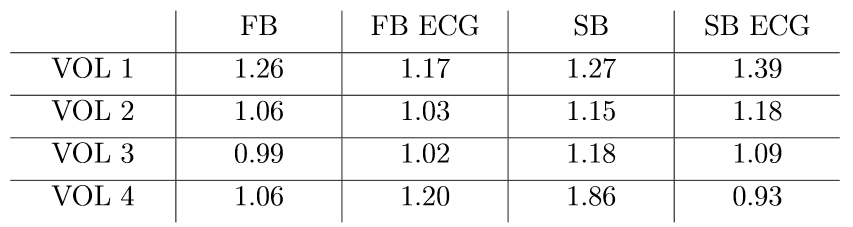
Table
2: Temporal SNR for all acquisitions and volunteers.
DOI: https://doi.org/10.58530/2022/1303