1300
Identifying the role of free water in human cortical macroscopic organization1Institute of Science and Technology for Brain-Inspired Intel, ShangHai City, China, 2Human Phenome Institute, Fudan University, Shanghai, China, ShangHai City, China
Synopsis
Free water imaging is a novel tool to study human brain. Recently, the free water has been used in aging disease researach. However, the role of free water in human cortex macroscopic is still unknown. This work shows the relationship between the cortical free water and the cortical thickness, and investigate the underlying molecular and genetic mechanism of the association. Neurons and astrocytes are strongly associated with the free water and the macroscopic organization.
Introduction
Free water imaging is a novel tool to study human brain biological properties for aging diseases [1, 2]. The free water imaging could also be used to demonstrate the characterization of healthy cortex. Diffusion of water molecules is varied by the surrounding cellular structures and types. The volume of the regional free water (FW) thus provided a new method to measure the regional microstructure. By using the multi-compartment model, we could fit the free water fraction from a diffusion weighted image [3, 4]. To understand how the regional free water influence macroscopic structure in the cortex, we then investigated the relationship between the regional free water volume and cortical thickness (CT). Furthermore, we also investigated the potential association between the FW-CT relationship and gene expression by using the gene-imaging mapping method [5, 6].Data acquisition and processing
All of the imaging data are from the Human Connectome Project (HCP) [7].. Totally 350 healthy participants are included in our analysis. Cortical thickness is estimated by Freesurfer v5.3. Cortical free water is estimated from a bi-tensor model. Once the free water images are computed, they are then projected to the cortical surface. The relationship between CT and FW is estimated from the linear regression model in each region, and the regression t-value is used to associate with gene expression. The brain atlas in our present study was parceled from the DKT 40 atlas, and each cortex region area was approximately 500 mm2 [8, 9]. Gene expression data is from the Allen Brain Institution and assigned to each brain region by using abagen [34]. We used the multivariate, dimension-reducing technique of partial least squares (PLS) to combine MRI data and gene data. This analysis defined a few PLS components, which were the linear combinations of the weighted gene expression scores. Significance of each gene is determined by using permutation test. PLS1+ (Z>5) and PLS1- (Z<-5) genes are extracted for the enrichment and cell type analysis. A permutation test is then used to determine the relationship between genes and specific cell types. The spin test is used to account for spatial autocorrelation.Results and discussion
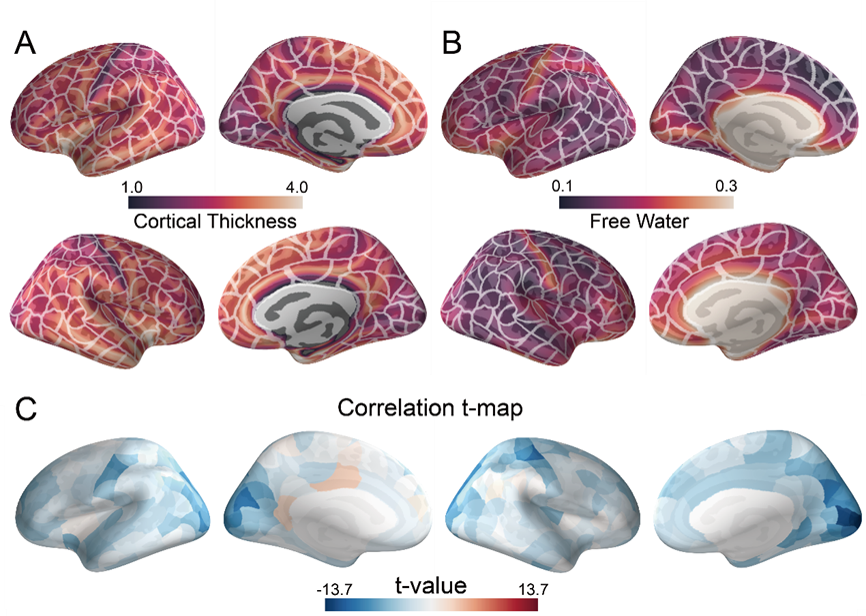
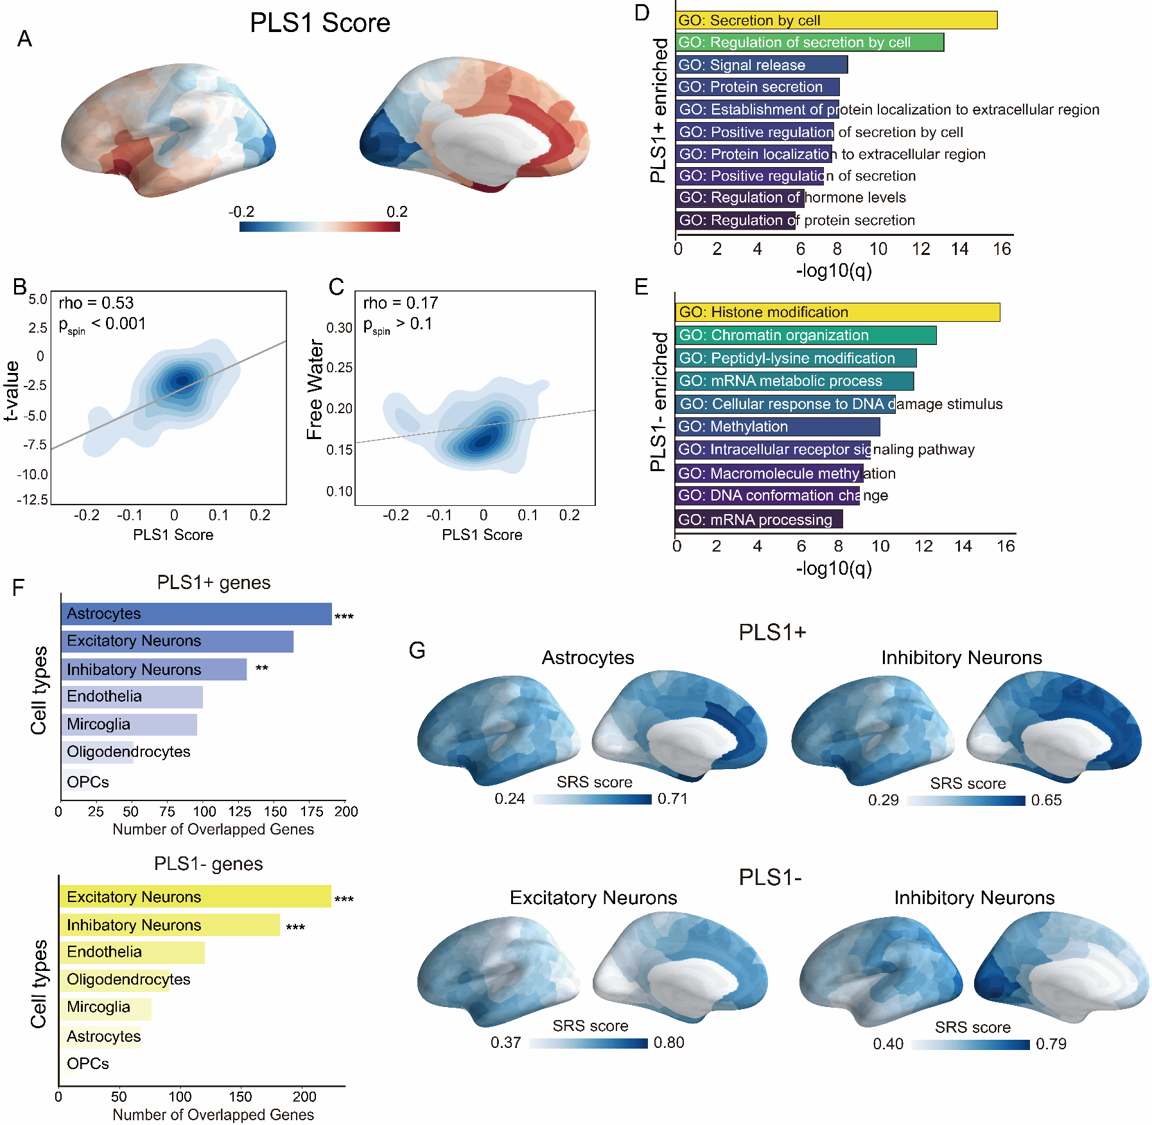
Figure.1 shows the distribution of CT and FW in the whole brain. The CT is higher in the frontal cortex and the temporal cortex. The FW is higher in the motor cortex, the insula cortex, and the limbic cortex. In most of the brain regions, we found the FW is negatively correlated with the CT. Figure.2 shows the results of the gene-imaging mapping. The distribution of the PLS1 score followed a posterior-anterior pattern. The PLS1+ genes are significantly enriched in the biological processes that are related to cellular secretion and associated with astrocytes and inhibitory neurons. The PLS1- genes are significantly enriched in the biological processes that related to protein modification and transcription and are associated with inhibitory and excitatory neurons. The expression of the PLS1+/- genes were highly expressed in the posterior and anterior brain respectively.Conclusion
This work aims to investigate the relationship between CT and FW. We found the CT is negatively correlated with the FW across the whole brain. This relationship followed a posterior-anterior pattern that aligned with the weighted gene score. These relationships suggest that the intrinsic association between macroscopic cortical organizations and microstructures. Moreover, our study has bridged the gap between the MR imaging and molecular functions.Acknowledgements
This work was supported by the National Natural Science Foundation of China (No. 81971583), National Key R&D Program of China (No. 2018YFC1312900), Shanghai Natural Science Foundation (No. 20ZR1406400), Shanghai Municipal Science and Technology Major Project (No.2017SHZDZX01, No.2018SHZDZX01) and ZJLab.References
1. Burciu, R.G., et al., Progression marker of Parkinson's disease: a 4-year multi-site imaging study. Brain, 2017. 140(8): p. 2183-2192.
2. Ofori, E., et al., Longitudinal changes in free-water within the substantia nigra of Parkinson's disease. Brain, 2015. 138(Pt 8): p. 2322-31.
3. Pierpaoli, C. and P.J. Basser, Toward a quantitative assessment of diffusion anisotropy. Magn Reson Med, 1996. 36(6): p. 893-906.
4. Hoy, A.R., et al., Optimization of a free water elimination two-compartment model for diffusion tensor imaging. Neuroimage, 2014. 103: p. 323-333.
5. Li, J., et al., Cortical structural differences in major depressive disorder correlate with cell type-specific transcriptional signatures. Nat Commun, 2021. 12(1): p. 1647.
6. Hansen, J.Y., et al., Mapping gene transcription and neurocognition across human neocortex. Nat Hum Behav, 2021. 5(9): p. 1240-1250.
7. Van Essen, D.C., et al., The WU-Minn Human Connectome Project: an overview. Neuroimage, 2013. 80: p. 62-79.
8. Whitaker, K.J., et al., Adolescence is associated with genomically patterned consolidation of the hubs of the human brain connectome. Proc Natl Acad Sci U S A, 2016. 113(32): p. 9105-10.
9. Romero-Garcia, R., et al., Effects of network resolution on topological properties of human neocortex. Neuroimage, 2012. 59(4): p. 3522-32.
Figures