1299
Early post gadolinium T2-W FLAIR signal intensity change in normal brain tissues and CSF: significance for clinical neuroimaging and neurofluids
Nivedita Agarwal1,2,3, Denis Peruzzo1, John Dewitt Port4, Roxana Octavia Carare5, and Graeme Bydder6
1Neuroradiology, I.R.C.C.S. Eugenio Medea, Bosisio Parini, Italy, 2Radiology, Azienda Provinciale per i Servizi Sanitari, Rovereto, Italy, 3Neurosciences, University of Southampton, Southampton, United Kingdom, 4Neuroradiology, Mayo Clinic, Rochester, MN, United States, 5University of Southampton, Southampton, United Kingdom, 6University of San Diego, California, CA, United States
1Neuroradiology, I.R.C.C.S. Eugenio Medea, Bosisio Parini, Italy, 2Radiology, Azienda Provinciale per i Servizi Sanitari, Rovereto, Italy, 3Neurosciences, University of Southampton, Southampton, United Kingdom, 4Neuroradiology, Mayo Clinic, Rochester, MN, United States, 5University of Southampton, Southampton, United Kingdom, 6University of San Diego, California, CA, United States
Synopsis
Apart from the study of meningeal diseases, cortical metastases and multiple sclerosis, T2-W FLAIR is used for analyzing the CSF drainage of fluids. However, little is known regarding gadolinium induced signal intensity (SI) changes in the normal gray (GM) and white matter (WM). The SI ratios GM/WM and CSF/WM increase by 2.5% and 7% respectively whereas the SI in WM does not change. These findings are important for the interpretation of clinical findings and will provide better understanding of the movement of neurofluids in the human brain at early time points (e.g.4-5 minutes after GBCA injection).
Introduction
Post gadolinium T2-Fluid-Attenuated Inversion Recovery sequence (GadT2-FLAIR) imaging is used to detect enhancing lesions in the brain and its associated neurofluids1,2,3,4. The signal intensity (SI) seen with T2-FLAIR depends on the T1s and T2s of gray matter (GM), white matter (WM) and cerebrospinal fluid (CSF). Gadolinium based agents (GBCA) reduce both the T1 and T2 of tissues which increases the SI seen on post contrast T2-FLAIR sequence1,5–7. Human postmortem neuropathological studies and experimental studies in rodents have defined the basement membranes of capillaries and arteries as the conduits for drainage of interstitial fluid from the brain in the form of Intramural Periarterial Drainage (IPAD). Failure of IPAD is a key factor in the pathogenesis of cerebral amyloid angiopathy (CAA) and appears to be less efficient in WM compared to GM8. Here we aim to test the hypothesis that there is a significant change in SI in GM and WM in GadT2 FLAIR acquired after 4-5 minutes i.v. injection of gadolinium in healthy human subjects.Methods
The study was approved by the local ethical committee. Patients 26 - 57 yrs (n=6) were identified (4F, 2M; average age 41.6yrs), with chronic headache or vertigo but without clinical or imaging evidence of vascular disease who had both a pre and a post GBCA T2-FLAIR sequence (PrePost) acquired 4-5 minutes after i.v. GBCA were included. All patients received i.v. Gadobutrol, in a standard dose of 0.1mmol/kg. All data was collected using a Siemens 1.5T scanner. 2D T2-FLAIR FSE sequence parameters: TR=8500ms, IR=2440ms, TE=86ms, flip angle 150°, ETL 23, slice thickness 4mm, acquisition matrix 320x210, FOV 250x220 mm, acquisition time = 3.50minutes. To test scanner stability over a period of weeks, two Back to Back (BtoB) T2-FLAIR sequences were acquired, as described above but, without i.v. GBCA in 12 healthy age-matched subjects during single MR sessions. A T2-FLAIR template was first built using the two T2-FLAIR sequences obtained from each subject. Analyses were performed using ANTs (Advanced Normalization Tools). Each subject’s T2-FLAIR template was subsequently skull stripped, corrected for intensity field inhomogeneities and segmented using Atropos and N4 algorithms. Segmented probability maps for WM, GM and CSF were visually identified, thresholded at 95% probability and binarised to derive tissue masks. In each subject, average SI and its standard deviation (SD) were computed using each tissue mask. Finally, SI average ratios (SIR) were computed for GM and CSF with respect to WM. Statistics: differences between the two populations (i.e. BtoB and PrePost) at the two time points (TP0 and TP1) and differences between TP0 and TP1 were investigated by computing the subject percentage variation. A two-tailed T-test was performed with the assumption of equal variance.Results
No significant variations were seen in the average SI derived from total GM and total WM on images acquired BtoB. Moreover, no significance difference were seen in the SI from WM, GM, CSF when comparing the BtoB and the PrePost population at T0, thus confirming the stability of the acquired signal. Significant increase in average SI at T1 was seen in GM and CSF, but not in WM (table) (Fig. 1). In addition, the variability of SI (measured as the SD) within total GM and total CSF increased on GadT2-FLAIR images by 8.13±6.02% and 5.4±2.4% respectively. The SIRs of GM/WM and CSF/WM showed significant increases of 2.55±0.89% and 7.22±1.29% respectively (Figs. 2 and 3)Discussion
The increase in SI in CSF is consistent with rapid transition of GBCAs through the blood-choroid plexus-barrier. SI variability of approximately 5% suggests that enhancement is not homogenous within the CSF space. GBCA induced increase of SI in the GM 4-5 minutes after i.v. injection needs to be understood. GM is highly perfused and has a higher capillary density than WM 8. Perfusion weighted imaging show that both the coefficient of pemeability (Ki) and cerebral blood volume are significantly higher in the GM than in the WM 9. The increased SIR in GM may be related to intravascular enhancement. Since CSF from the subarachnoid space enters the brain parenchyma along the basement membranes of penetrating arteries, an increase in SI in GM could also be due to T1 shortening from GBCA penetration with recirculated CSF 10. Variability of 8% in SI suggests that there may be clusters of GM with different degrees of enhancement.Conclusion
The results are novel and important for clinical interpretation of GadT2-W FLAIR findings. GBCA enters the CSF within minutes of intravenous gadolinium injection and GBCA induced enhancement of the normal brain cortex with an intact blood brain barrier also occurs very early. The SI variations in enhancement within CSF and GM however suggest heterogeneity of normal GBCA distribution not variation due to disease.Acknowledgements
No acknowledgement found.References
1. Freeze, W. M. et al. CSF enhancement on post-contrast fluid-attenuated inversion recovery images; a systematic review. NeuroImage Clin. 28, 102456 (2020). 2. Absinta, M. et al. Leptomeningeal gadolinium enhancement across the spectrum of chronic neuroinflammatory diseases. Neurology 88, 1439–1444 (2017). 3. Ahn, J. H. et al. Meningeal lymphatic vessels at the skull base drain cerebrospinal fluid. Nature 572, 1–29 (2019). 4. Absinta, M. et al. Human and nonhuman primate meninges harbor lymphatic vessels that can be visualized noninvasively by MRI. Elife 6, 780 (2017). 5. Mathews, V. P. et al. Brain: Gadolinium-enhanced Fast Fluid-attenuated Inversion-Recovery MR Imaging. Radiology 211, 257–263 (1999). 6. Dickinson, P. J., Jones-Woods, S. & Cissell, D. D. Abrogation of fluid suppression in intracranial postcontrast fluid-attenuated inversion recovery magnetic resonance imaging: A clinical and phantom study. Vet. Radiol. Ultrasound 59, 432–443 (2018). 7. Jeevanandham, B., Kalyanpur, T., Gupta, P. & Cherian, M. Comparison of post-contrast 3D-T1-MPRAGE, 3D-T1-SPACE and 3D-T2-FLAIR MR images in evaluation of meningeal abnormalities at 3-T MRI. Br. J. Radiol. 90, 1–10 (2017). 8. MacGregor Sharp, M. et al. Demonstrating a reduced capacity for removal of fluid from cerebral white matter and hypoxia in areas of white matter hyperintensity associated with age and dementia. Acta Neuropathol. Commun. 8, 131 (2020). 9. Varatharaj, A. et al. Blood–brain barrier permeability measured using dynamic contrast-enhanced magnetic resonance imaging: a validation study. J. Physiol. 597, 699–709 (2019). 10. Albargothy, N. J. et al. Convective influx/glymphatic system: tracers injected into the CSF enter and leave the brain along separate periarterial basement membrane pathways. Acta Neuropathol. 135, 1–14 (2018).Figures
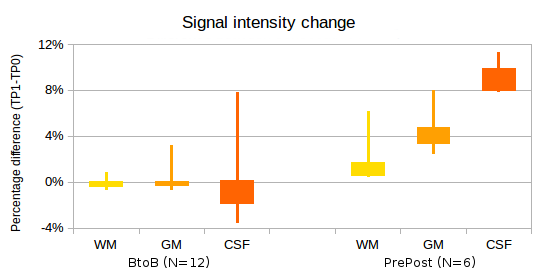
Fig.
1. Percentage SI change in T2-FLAIR
sequences acquired in BtoB subjects (without GBCA injection) and PrePost
subjects (acquired 4- 5 minutes after GBCA injection). The widths of the box
plots shows the 25th and the 75th percentiles and the
lines show the minimum and the maximum values.
No significant change was seen in the BtoB subjects but significant
increases were seen in GM and CSF in the PrePost subjects.
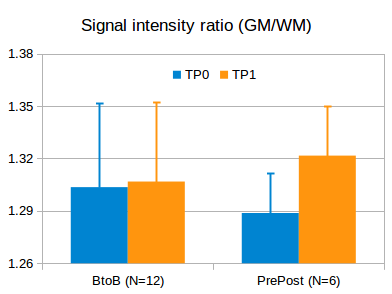
Fig. 2. SIRs
of GM to WM in BtoB and PrePost subjects at two time points (TP 0 and TP1). There is no significant difference in the
BtoB subjects (no GBCA injection), but a significant increase in the PrePost
subjects (pre and post GBCA injection).
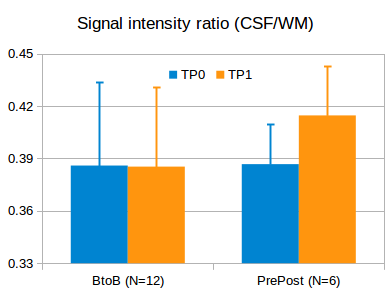
Fig. 3. SIRs
of CSF to WM in BtoB and PrePost subjects at two time points (TP 0 and TP1).
There is no significant difference in the BtoB subjects (no GBCA injection),
but a significant increase in the PrePost subjects (pre and post GBCA
injection).
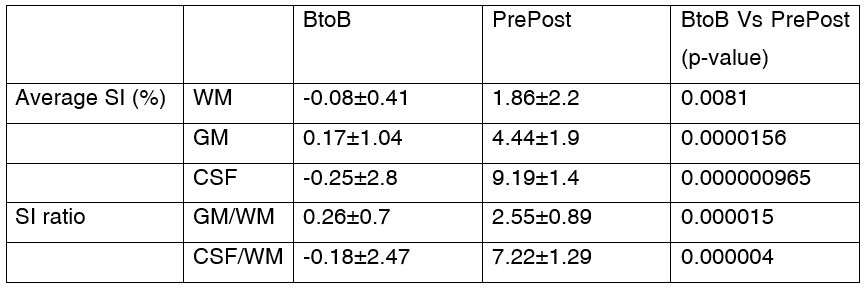
Table 1. Average SI and SIR is in BtoB subjects (without GBCA injection) and PrePost subjects (before and 4-5 minutes after GBCA injection). There are significant increases in average SI and SIR in GM and CSF. WM = white matter; GM= gray matter; CSF= cerebrospinal fluid
DOI: https://doi.org/10.58530/2022/1299