1297
Measurement of CSF pulsation from EPI-based human fMRI1Department of Bio and Brain Engineering, Korea Advanced Institute of Science and Technology, Daejeon, Korea, Republic of
Synopsis
To study CSF dynamics and brain functional activity simultaneously with quantitative aspect, we proposed a new method for quantifying CSF pulsatility information based on an interslice CSF pulsation model in 4th ventricle of EPI-based fMRI (CSFpulse). The proposed CSFpulse successfully detected the higher CSF flow during the resting state than the typical task states, both in quantitative and time course aspects. Also, CSFpulse was significantly correlated with stroke volume measured using phase contrast MRI during functional states. Based on these results, CSFpulse can be used for investigating functional changes in BOLD and CSF pulsation simultaneously based on conventional EPI-based fMRI.
INTRODUCTION
Conventionally, phase contrast (PC) MRI has been used for studying CSF pulsation functionality1,2. Recently, new CSF studies using echo-planar imaging (EPI) based functional magnetic resonance imaging (fMRI) received much attention3,4. PC MRI enables quantification of CSF pulsation in an absolute unit which is useful as a biomarker5. EPI-based fMRI can demonstrate both CSF signals and hemodynamic functional activations simultaneously and dynamically. However, unlike PC MRI, the previous fMRI-based methods for studying CSF pulsation, which is based on measurement in the edge slices(CSFedge), lack quantitative metric of CSF flow itself. Therefore, we aimed to develop a novel method for quantifying CSF pulsation based on inter-slice saturation effects of CSF directly from EPI-based fMRI data(CSFpulse).METHODS
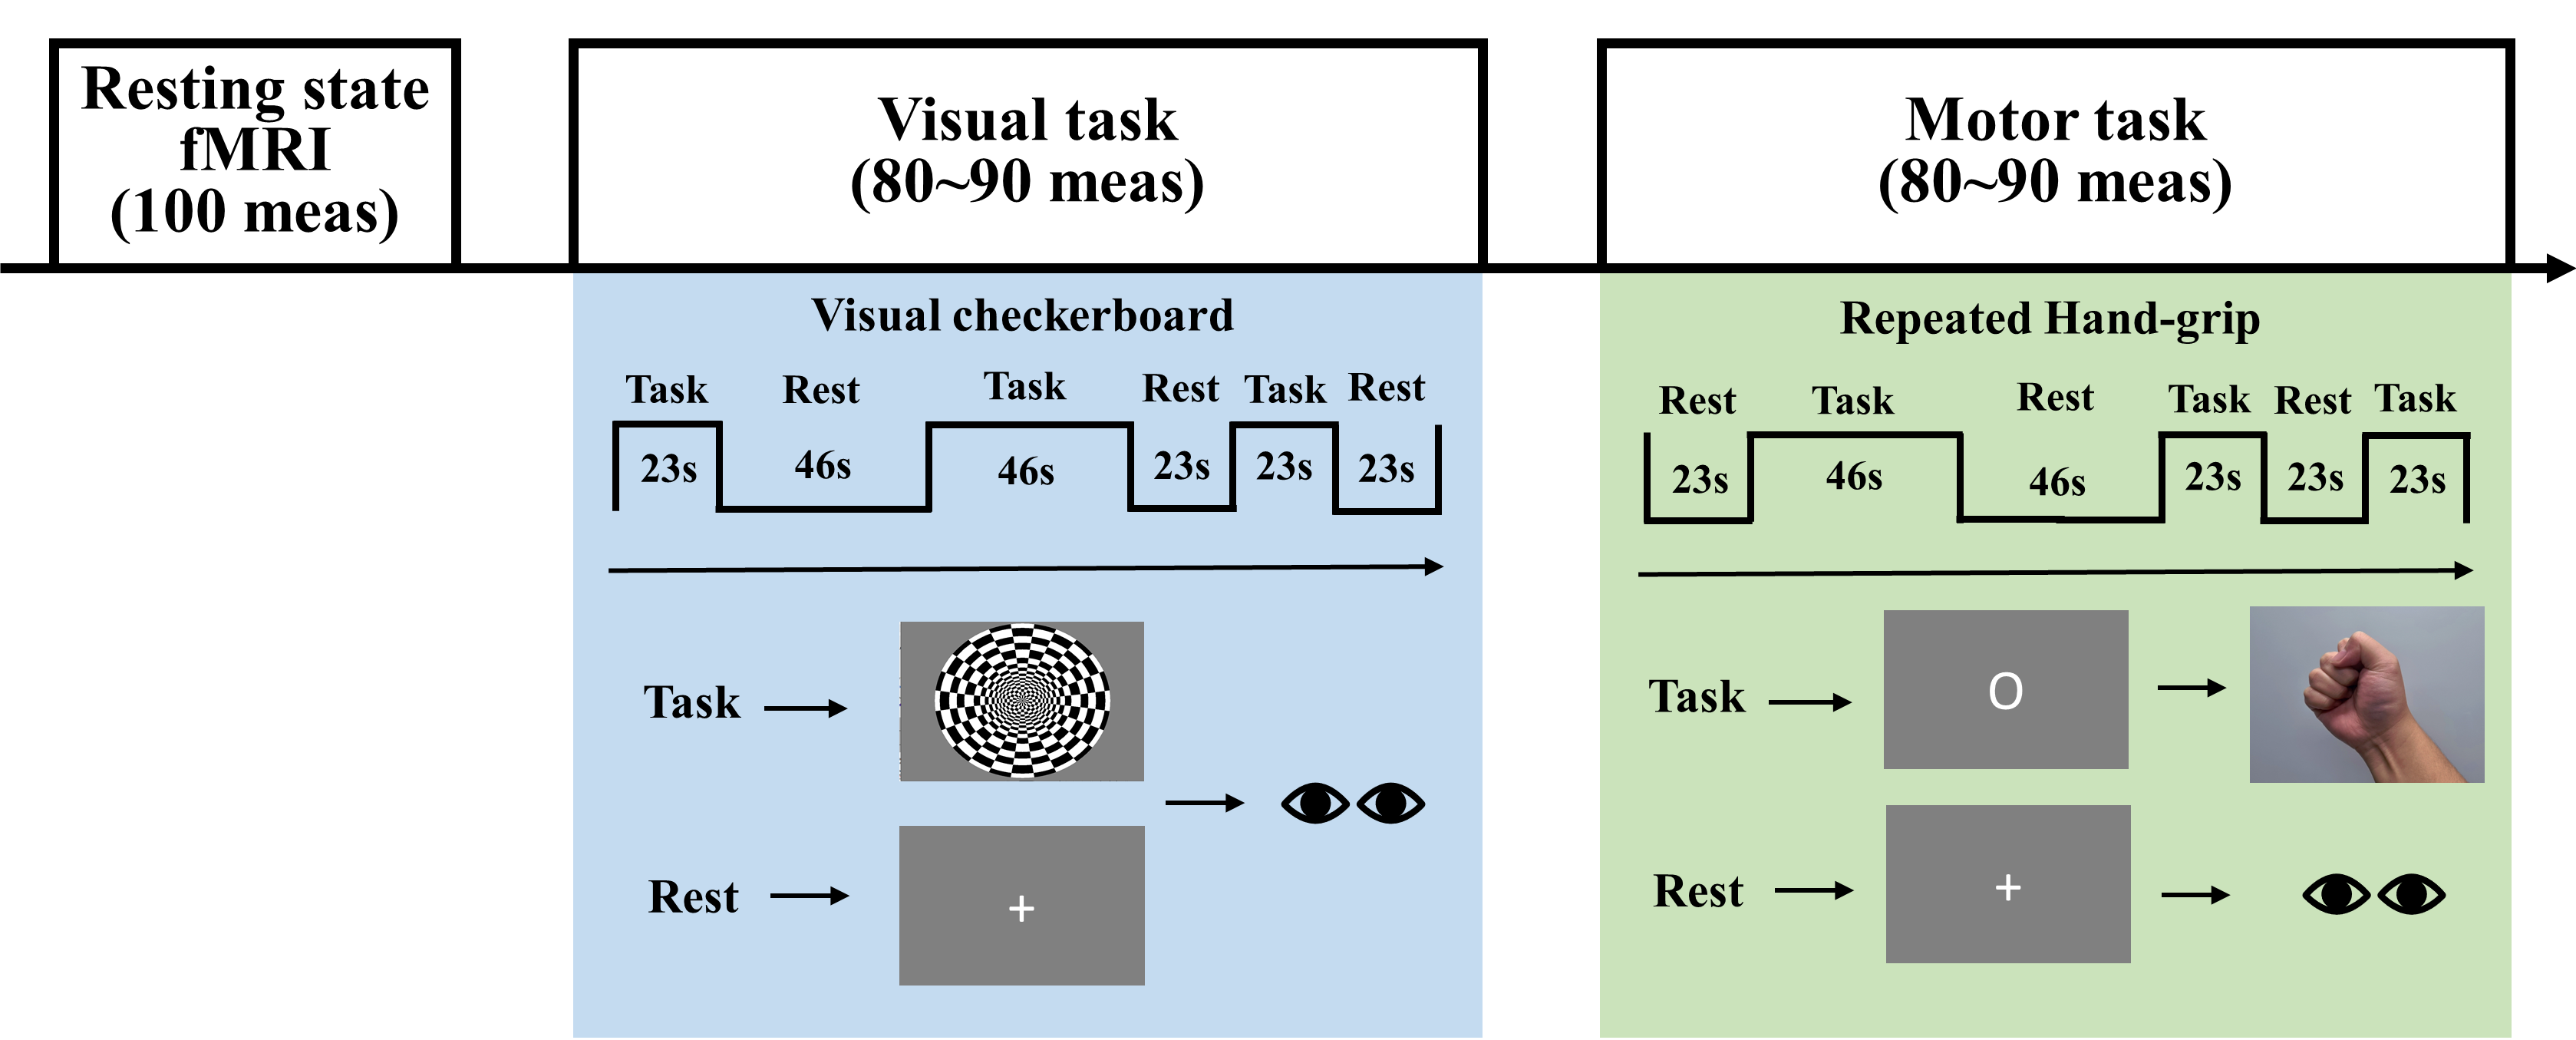
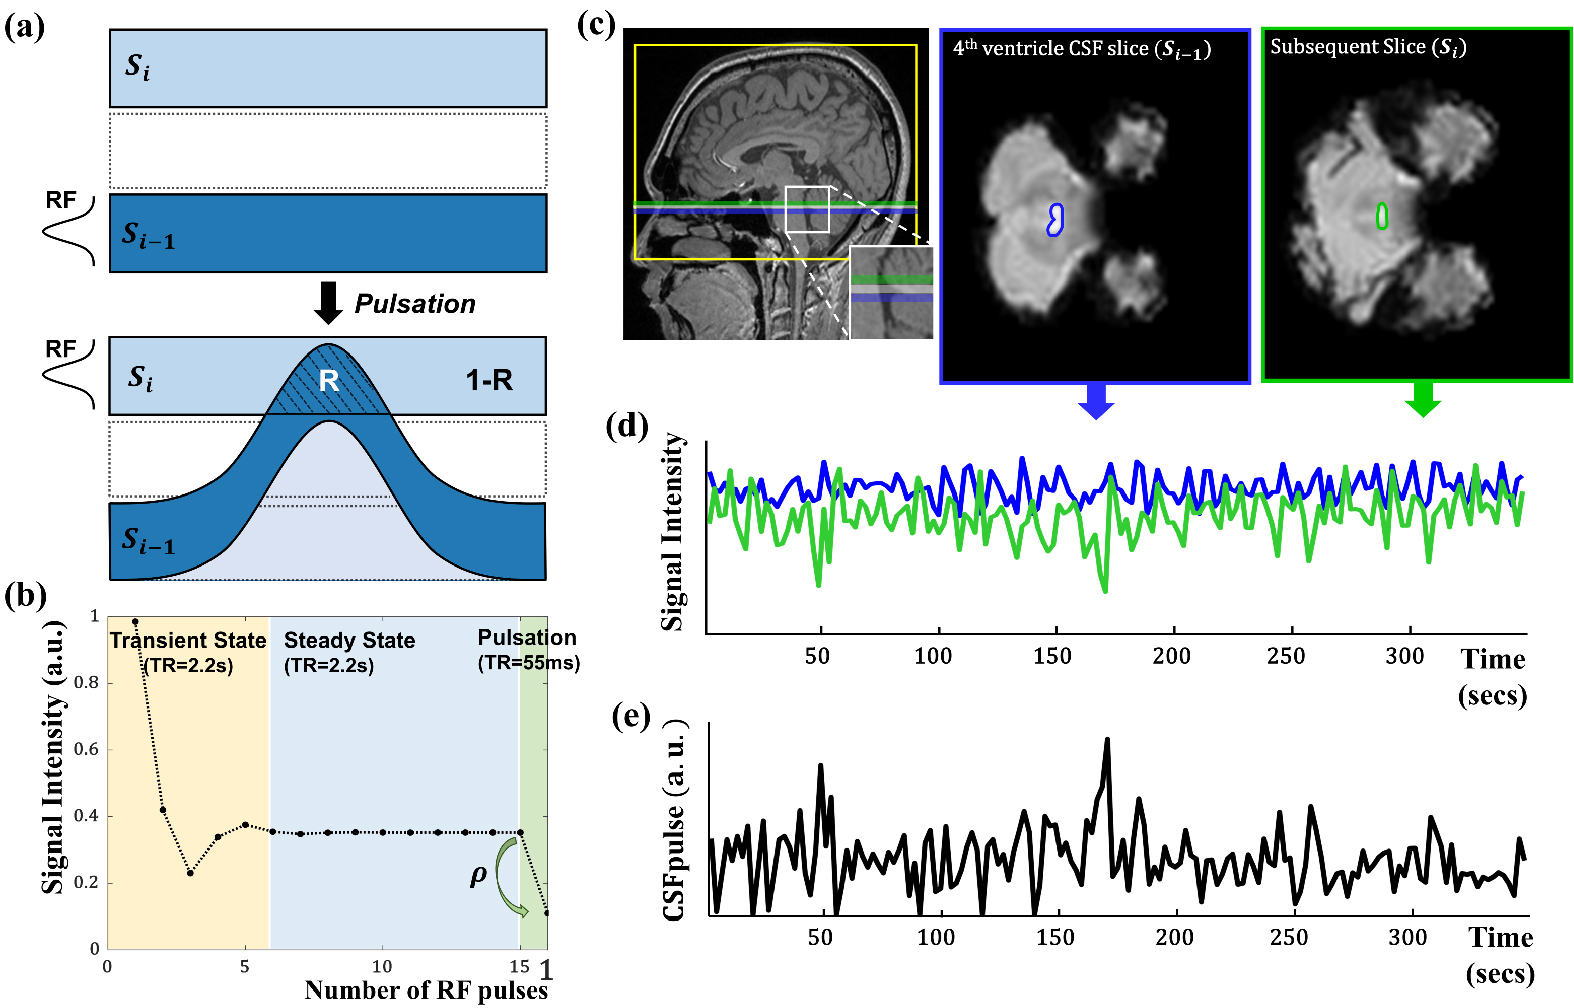
All the experiments were conducted on a 3T whole-body scanner(Verio, Siemens Medical Solutions, Erlangen, Germany). The total number of subjects was 17(aged 26±3.2 years). To get fMRI data, multi-slice 2D EPI images were acquired. Default imaging parameters were repetition time(TR)/echo time(TE) = 2200/30 ms, flip angle = 90°, matrix size = 64×64, slice thickness = 3mm, interleaved slice order, voxel size = 3mm isotropic, number of slices = 40. Experimental procedure of fMRI study is demonstrated in Fig.1. The PC MRI data were collected with pulse-oximetry gating. The imaging slice was set to be perpendicular to aqueduct of sylvius. Default imaging parameters were FOV = 150mm, matrix size = 256×256, slice thickness = 5mm, flip-angle =10°, velocity encoding(VENC) = 10cm/s (through-plane), and scan time =~4 min. The steady-state CSF signals in the prior slice contribute to the signals in the imaging slice due to pulsation(Fig.2.a). We simulated the CSF signal evolution in dynamic EPI imaging without pulsation first. Additional simulation was performed after steady-state with a new RF pulse and a short TR to calculate the CSF signal evolution under the condition of pulsation between adjacent slices during EPI image acquisition(Fig.2.b). Si(n): signal intensity of nth measurement of ith slice. $$ Si(n)=Si-1(n)×(1-R(n))+Si-1(n)×ρ×R(n) $$where ρ indicates the ratio between the pulsating CSF signal after application of a single RF pulse on the steady-state condition and the CSF signal under the steady-state condition(Fig.2.b), and R refers to the ratio between the CSF signal in the ith slice originated from i-1th slice through CSF pulsation and that of the preexisting CSF in the ith slice before pulsation(Fig.2.a). Finally, the quantitative metric of CSF pulsation(CSFpulse) was calculated as below to represent the interslice pulsed CSF volume.
$$ CSFpulse(n)=R(n)×ROIvolume $$ where ROIvolume represents the volume of the CSF ROI in the imaging slice. CSF ROIs were set in the 4th ventricle slice and the subsequent slice of the EPI data for CSFpulse, and edge slice(s) in the CSF space of the EPI data for CSFedge. From PC MRI, aqueductal CSF stroke volume was calculated as an absolute summation of the cranial/caudal volume.
RESULTS
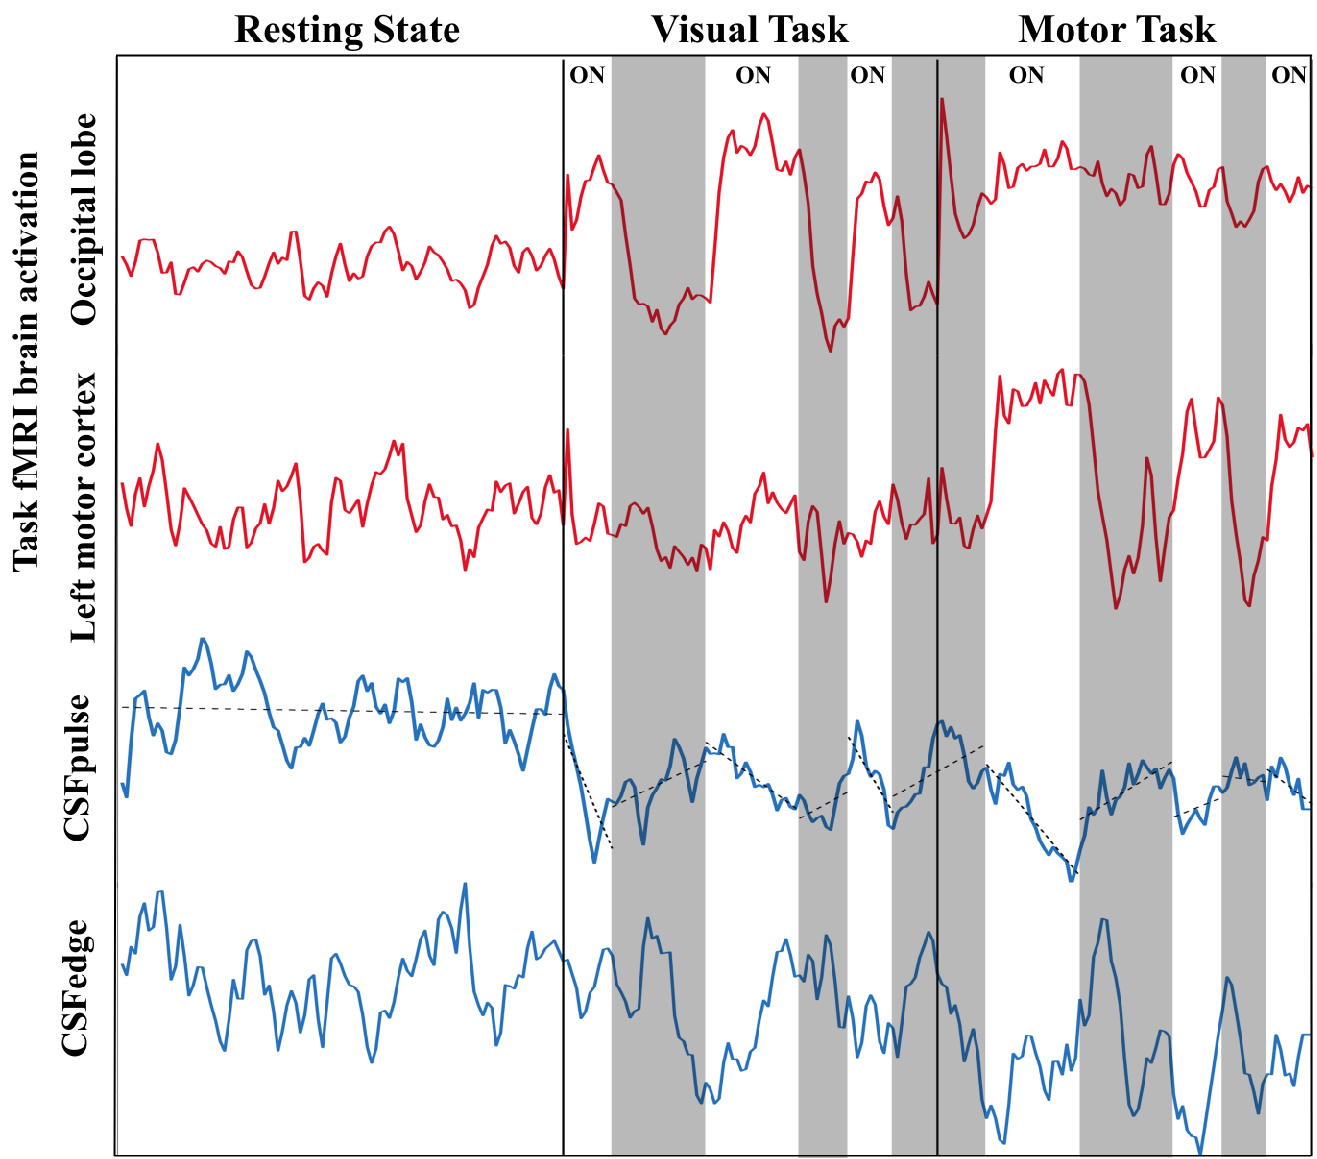
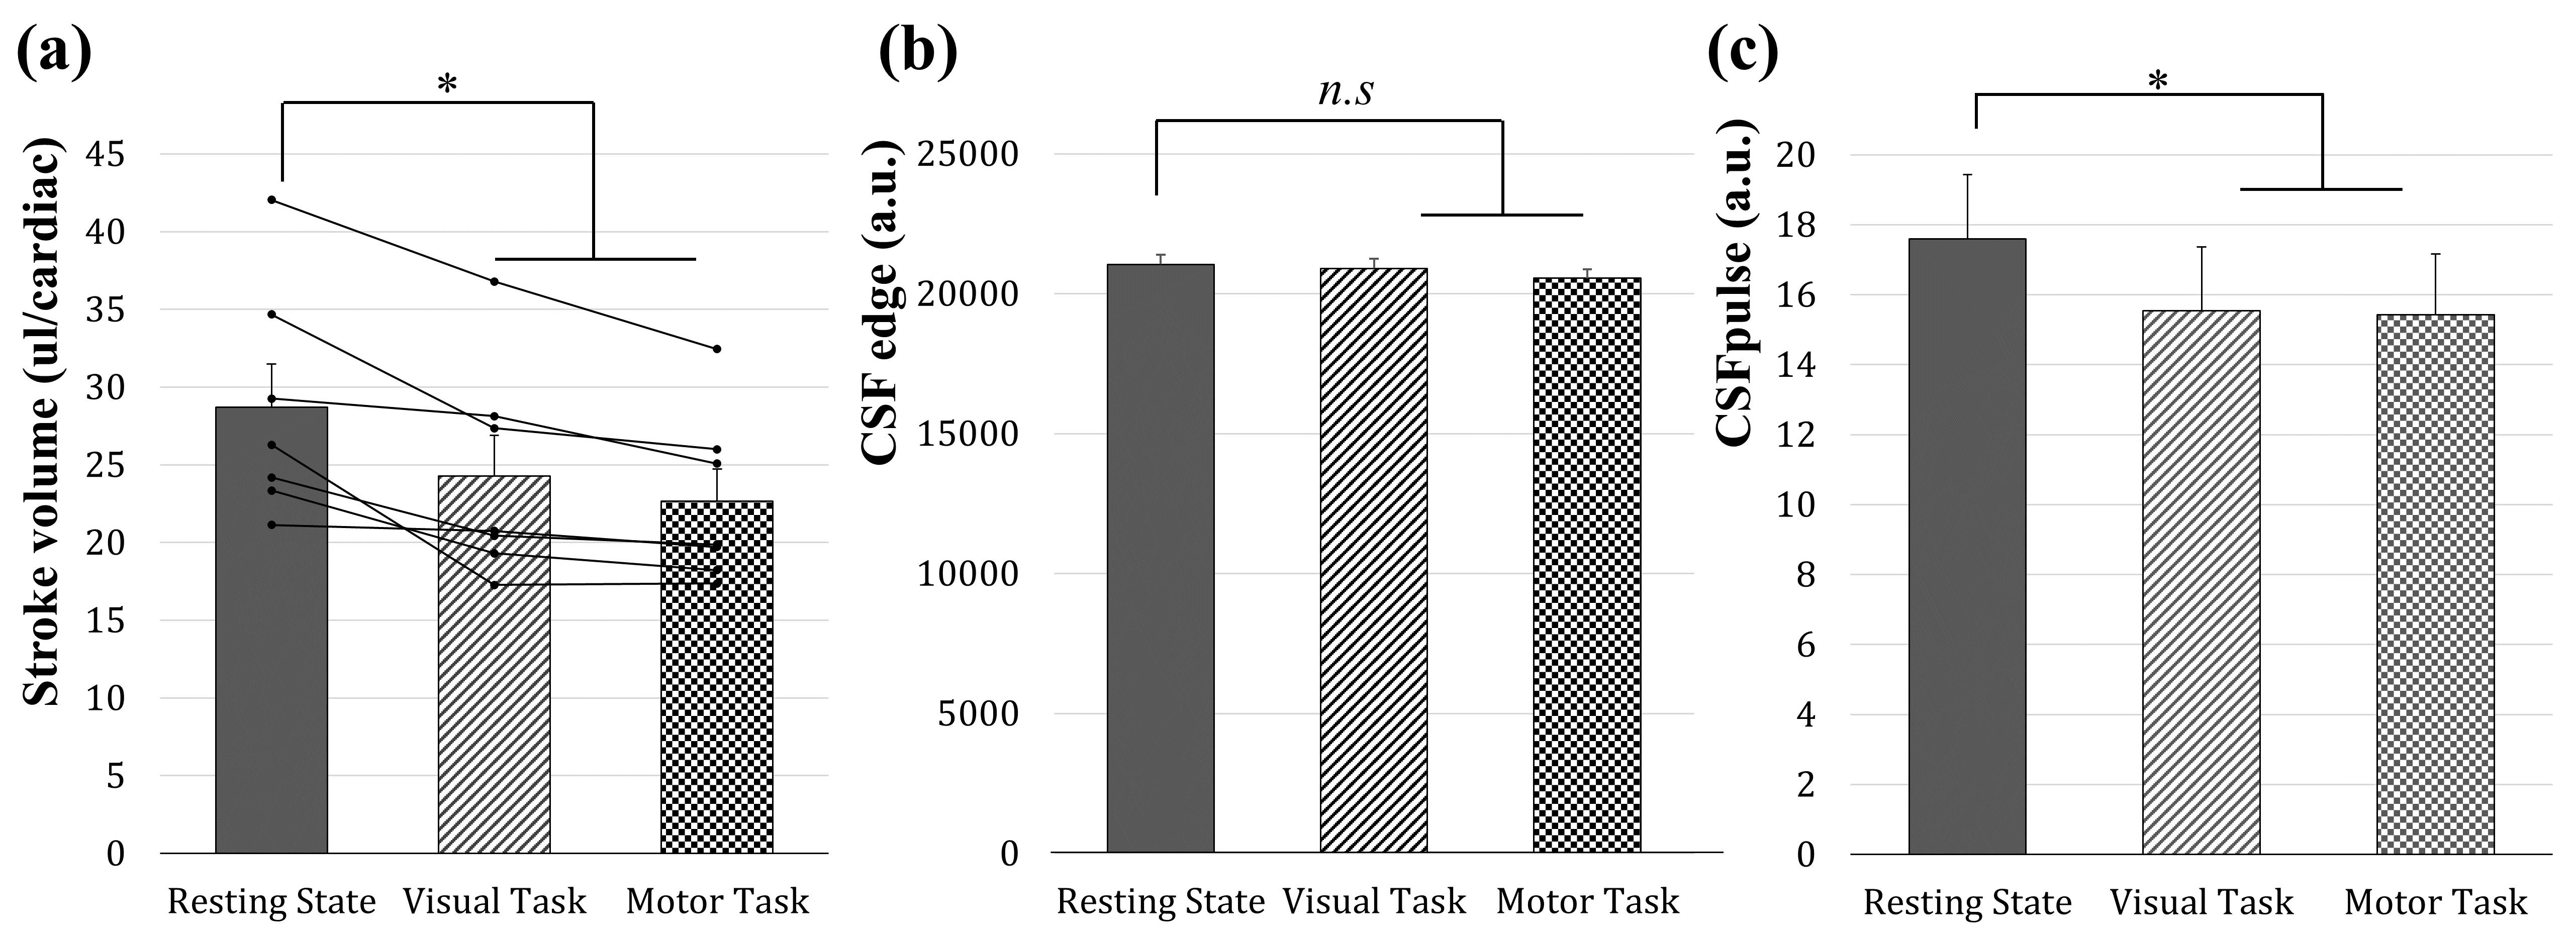
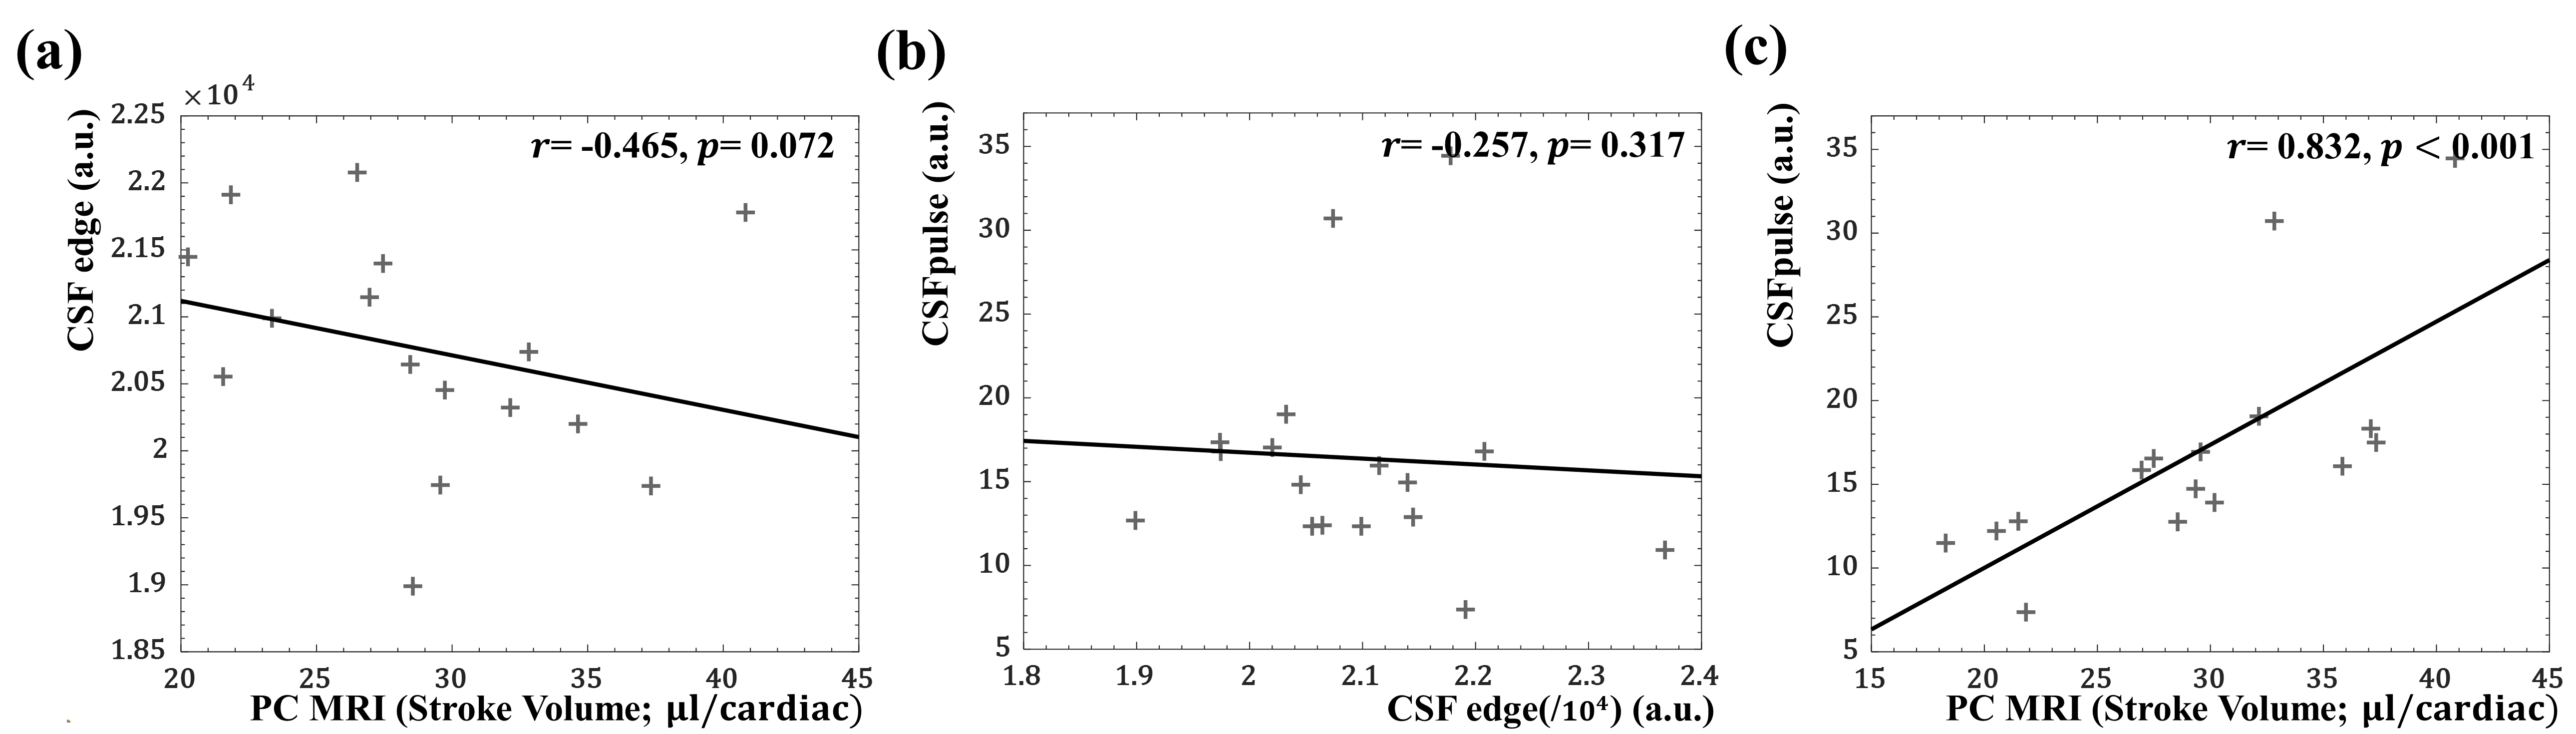
The time courses of functional activations in the visual and motor cortices were demonstrated as expected(Fig.3). Also, CSFpulse increased during the stimulation-off periods and decreased during the stimulation-on periods for both visual and motor tasks(Fig.3). Quantitatively, CSFpulse during the resting state was significantly higher than CSFpulse during the visual and motor tasks(Fig.4), consistent with the visual inspection(Fig.3). There was no statistical difference between CSFedge values during the resting state, visual task, and motor task(Fig.4). The CSF pulsation was also measured in terms of stroke volume using PC MRI (Fig.4). The stroke volume (l/cardiac) during the resting state was significantly higher than that during the visual and motor tasks, but there was no significant difference between stroke volumes of visual task and motor task, consistent with the results from the CSFpulse(Fig.4). Significant correlation was observed between the PC MRI stroke volume and CSFpulse across subjects(Spearman correlation; ), confirming that the proposed CSFpulse can be used for inter-subject comparison as a quantified metric(Fig.5). However, there was no significant correlation between PC MRI stroke volume and the CSFedge signals and between CSFpulse and CSFedge(Fig.5).DISCUSSION & CONCLUSION
The current study presented a new technique for quantification of CSF pulsation from conventional EPI fMRI data. The proposed CSFpulse demonstrated how brain activations affect CSF pulsation in the 4th ventricle in the semi-real time fMRI(Fig.3). The difference in CSFpulse values between resting state and task states was consistent with the previously reported tendency6,7 as well as those of PC MRI CSF stroke volume from this study(Fig.4). Furthermore, CSFpulse showed a statistically reliable correlation with CSF stroke volume from the PC MRI(Fig.5). The results support that the CSFpulse reflects the CSF pulsation as was intended, better than CSFedge. Also, it can be used for comparison of inter/intra-subject functional CSF pulsation using the conventional EPI-based fMRI with no additional scan. Also, the technique can be applied to quantify functional CSF flow changes in EPI-based fMRI data already acquired for other purposes in the past, as long as they were scanned with whole-brain coverage while including the regions of 4th ventricle for interslice saturation. The proposed CSFpulse may be applied as an imaging marker for comparing CSF pulsation between different human functional states, or for further studies, based on conventional EPI-based fMRI for simultaneous assessment of functional CSF pulsation changes and BOLD-based functional brain activities.Acknowledgements
No acknowledgement found.References
[1] Battal, B., et al. "Cerebrospinal fluid flow imaging by using phase-contrast MR technique." The British journal of radiology 84.1004 (2011): 758-765.
[2] Tuura, Ruth O'Gorman, et al. "Sleep-related and diurnal effects on brain diffusivity and cerebrospinal fluid flow." NeuroImage 241 (2021): 118420.
[3] Fultz, Nina E., et al. "Coupled electrophysiological, hemodynamic, and cerebrospinal fluid oscillations in human sleep." Science 366.6465 (2019): 628-631.
[4] Han, Feng, et al. "Reduced coupling between cerebrospinal fluid flow and global brain activity is linked to Alzheimer disease–related pathology." PLoS biology 19.6 (2021): e3001233.
[5] Bradley, William G. "Cerebrospinal fluid dynamics and shunt responsiveness in patients with normal-pressure hydrocephalus." Mayo Clinic Proceedings. Vol. 77. No. 6. Elsevier, 2002.
[6] Tarumi, Takashi, et al. "Brain blood and cerebrospinal fluid flow dynamics during rhythmic handgrip exercise in young healthy men and women." The Journal of Physiology 599.6 (2021): 1799-1813.
[7] Jin, Tao, and Seong-Gi Kim. "Change of the cerebrospinal fluid volume during brain activation investigated by T1ρ-weighted fMRI." Neuroimage 51.4 (2010): 1378-1383.
Figures