1296
Assessment of gadolinium contrast in the brain using a compressed sense 3D Look Locker sequence after intrathecal contrast administration1Radiology and Nuclear Medicine, Oslo University Hospital, Oslo, Norway, 2The Intervention Centre, Oslo University Hospital, Oslo, Norway, 3Faculty of Health and Social Sciences, University of South-Eastern Norway, Drammen, Norway, 4Department of Radiology, Oslo University Hospital, Oslo, Norway, 5Department of Radiology and Nuclear Medicine, Oslo University Hospital, Oslo, Norway, 6Institute of Clinical Medicine, Faculty of Medicine, University of Oslo, Oslo, Norway, 7Department of Neurosurgery, Oslo University Hospital – Rikshospitale, Oslo, Norway
Synopsis
Quantitative assessment of T1 enhancement after intrathecal administration of Gd-contrast may remove present challenges due to image scaling varying between acquisitions. The compressed SENSE technique allow 3D-Look-Locker-TFE acquisitions with isotropic 1 mm resolution and full brain coverage to be run in clinically feasible times. A clinical example is demonstrated and a small phantom study exploring further improvements based on trade-offs between undersampling and reduced saturation effects is presented.
Introduction
The Glymphatic system is suggested to clear waste metabolites from the brain1. Cerebrospinal fluid (CSF) propagates through perivascular spaces and enter the brain parenchyma through aquaporine-4 channels. CSF, interstitial fluid and waste metabolites exit the brain through the perivenous spaces which drain into the meningeal lymphatic vessels.Several neurological disorders are linked to dysfunction of the Glymphatic system. Interventions to restore its function may become new therapeutic methods, hence tools to assess the function of the system are mandated.
Intrathecal administration of Gadolinium based contrast agents (GBCA) followed by a sequence of T1-weighted MRI examinations have been used to investigate the dynamics of the Glymphatic system. As conventional MR-images are scaled freely to span the available grey-scale, the analysis of time series from such data relies on normalization of images to some tissue not affected by the administered contrast. Such normalization is prone to errors due to image noise and artifacts.
Quantitative T1 mapping has been demonstrated to assess clearance of intrathecally administered GBCA without normalization 2.
With compressed SENSE, isotropic 1mm resolution 3D-T1- mapping using an inversion prepared 3D Look-Locker (LL) acquisition has become clinically feasible. The LL technique underestimates T1 due to saturation effects if delay between inversion pulses is short or rf-saturation is large. Such underestimation lead to systematic errors in the estimation of contrast concentration.
In this work implemented 1mm isotropic T1-mapping. We test its use in a clinical setting, and by a phantom study, we investigate further improvements based on trade-offs between compressed SENSE acceleration, and signal saturation.
Materials and Methods
Patient studyAfter informed consent, patients are included in a running clinical study assessing glymphatic function. The study is approved by the regional ethics committee. Only the first patient is reported on in this preliminary work.
Imaging was performed on a Philips 3T Ingenia system using a 32 channel head coil. A 3D-LL Turbo Field Echo (3D-LL-TFE) sequence was run with the following parameters: Field of view:256 x 256 x 368, isotropic 1 mm acquired voxels, TR/TE 7.47/3.39 ms, flip angle 5 degrees, bandwidth 217 Hz/pixel, number of cardiac phases: 25, shortest inversion time: 75 ms, frame interval 119 ms, time between inversions: 3000 ms.
Analysis was performed using NordicICE; NordicNeuroLab. ROI’s were placed in putamen, splenium of corpus callosum and orbital fat. Measurements from T1W images were normalized to the corresponding mean signal of orbital fat before time-series were extracted.
Phantom study
Eleven solutions of Gadobutrol in distilled water were prepared with concentrations ranging from 0.01mM to 0.5mM. A vendor supplied mixed spin-echo- inversion recovery sequence provided a gold standard relaxation map. Three compressed SENSE accelerated 3D-LL-TFE-acquistions were performed with parameters given in the table and otherwise identical to that in the patient study.
| | TFE-factor | Interval between inversions (ms) | Compressed SENSE-factor |
| Scan 1 | 15 | 3000 | 14.9 |
| Scan 2 | 9 | 3000 | 25 |
| Scan 3 | 15 | 5455 | 25 |
Estimation of change in contrast Ci relative to the most dilute solution was done according to the relation:
Ci = (R1i-R10)/r
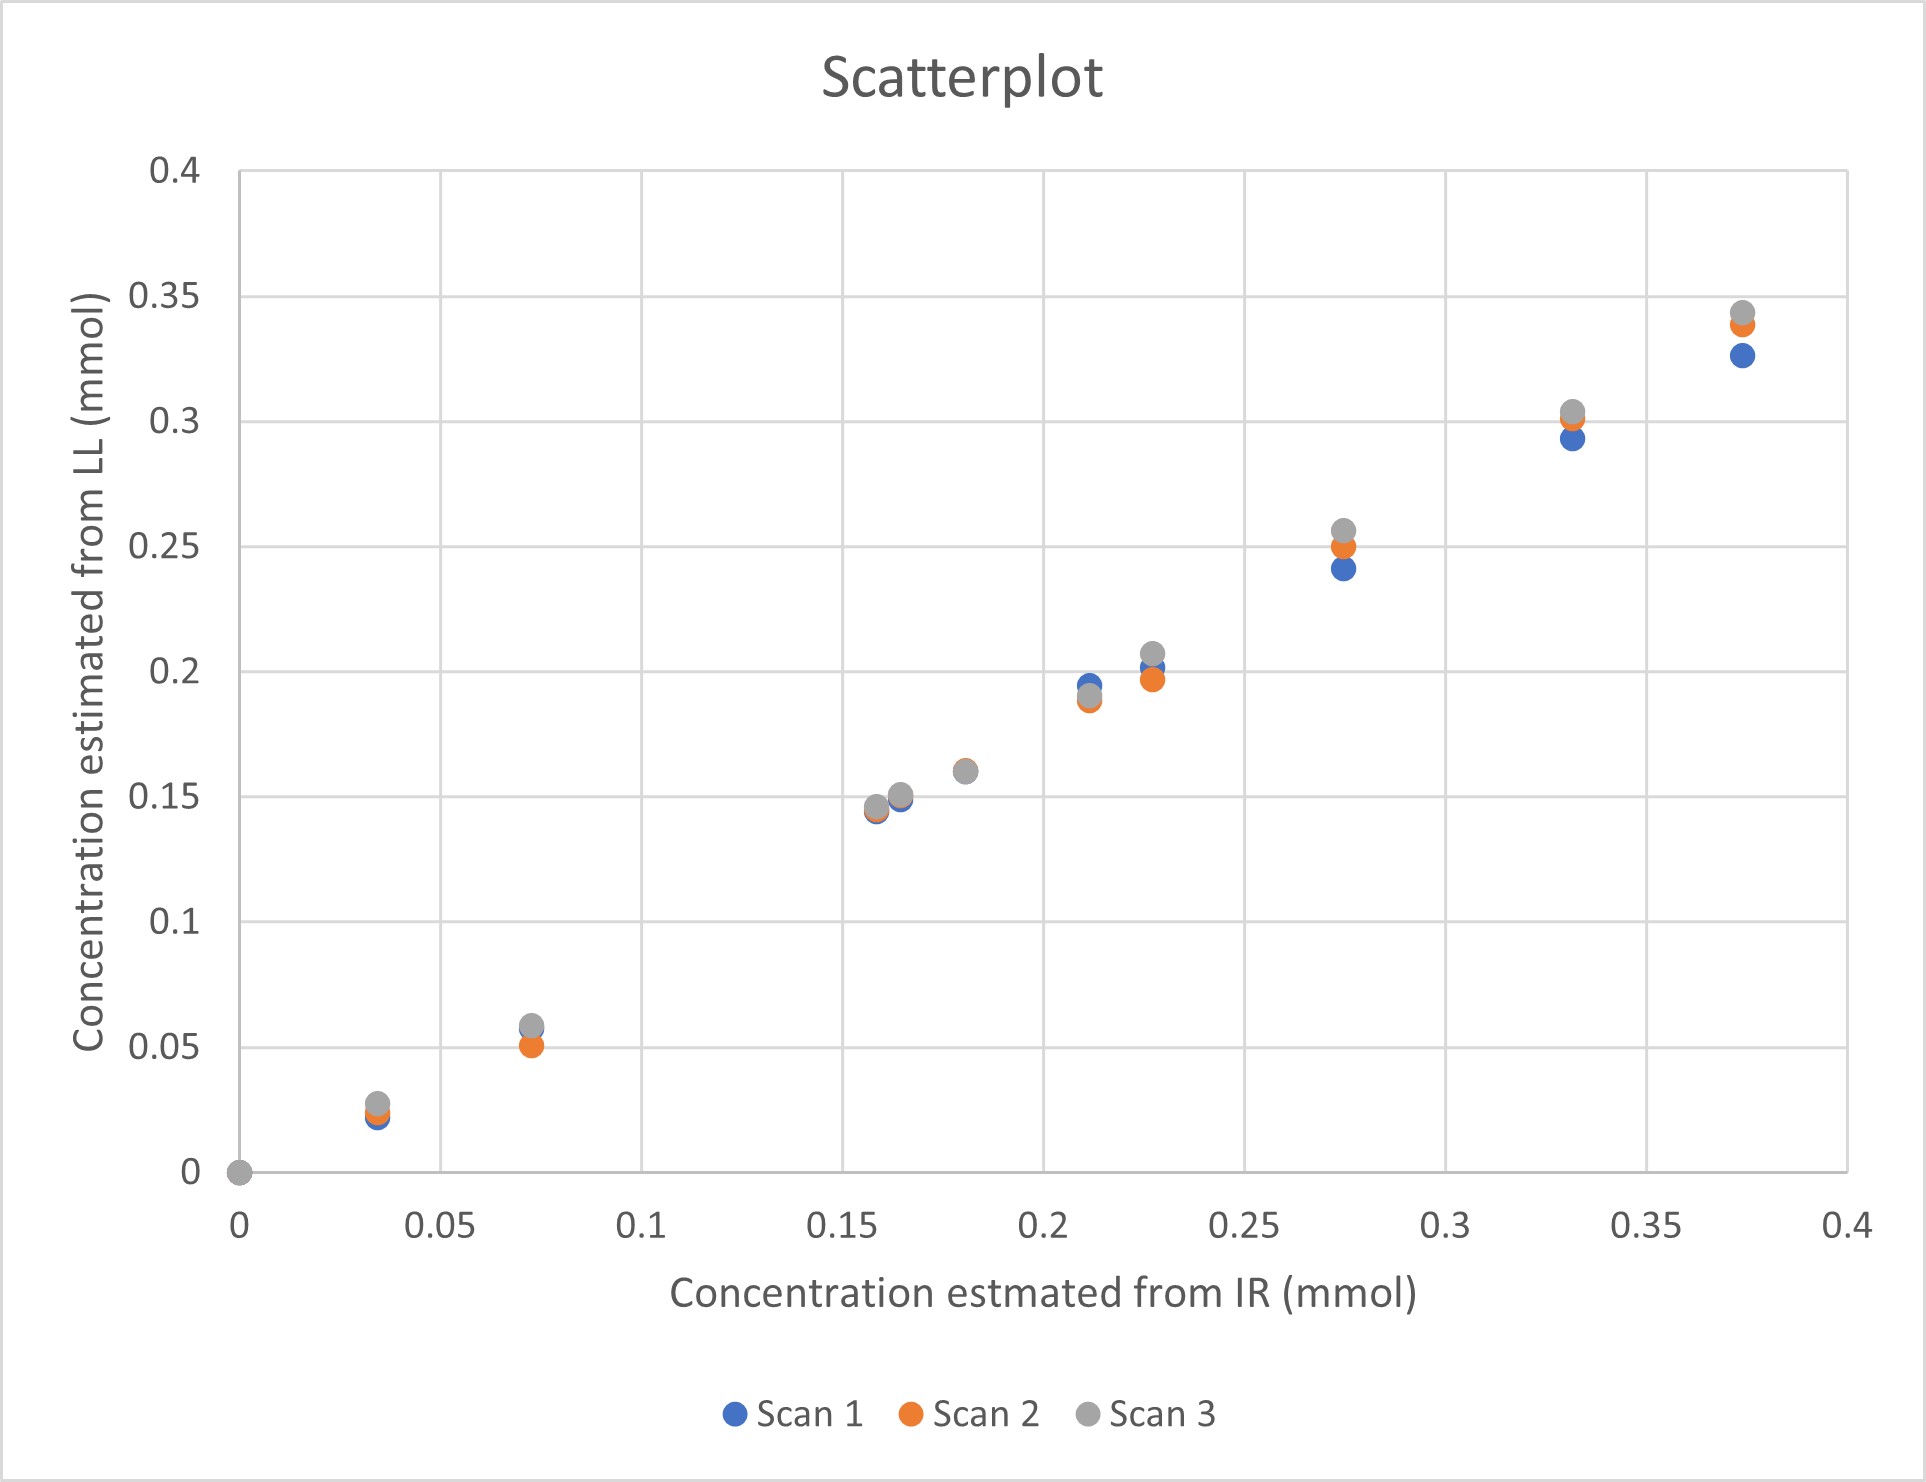
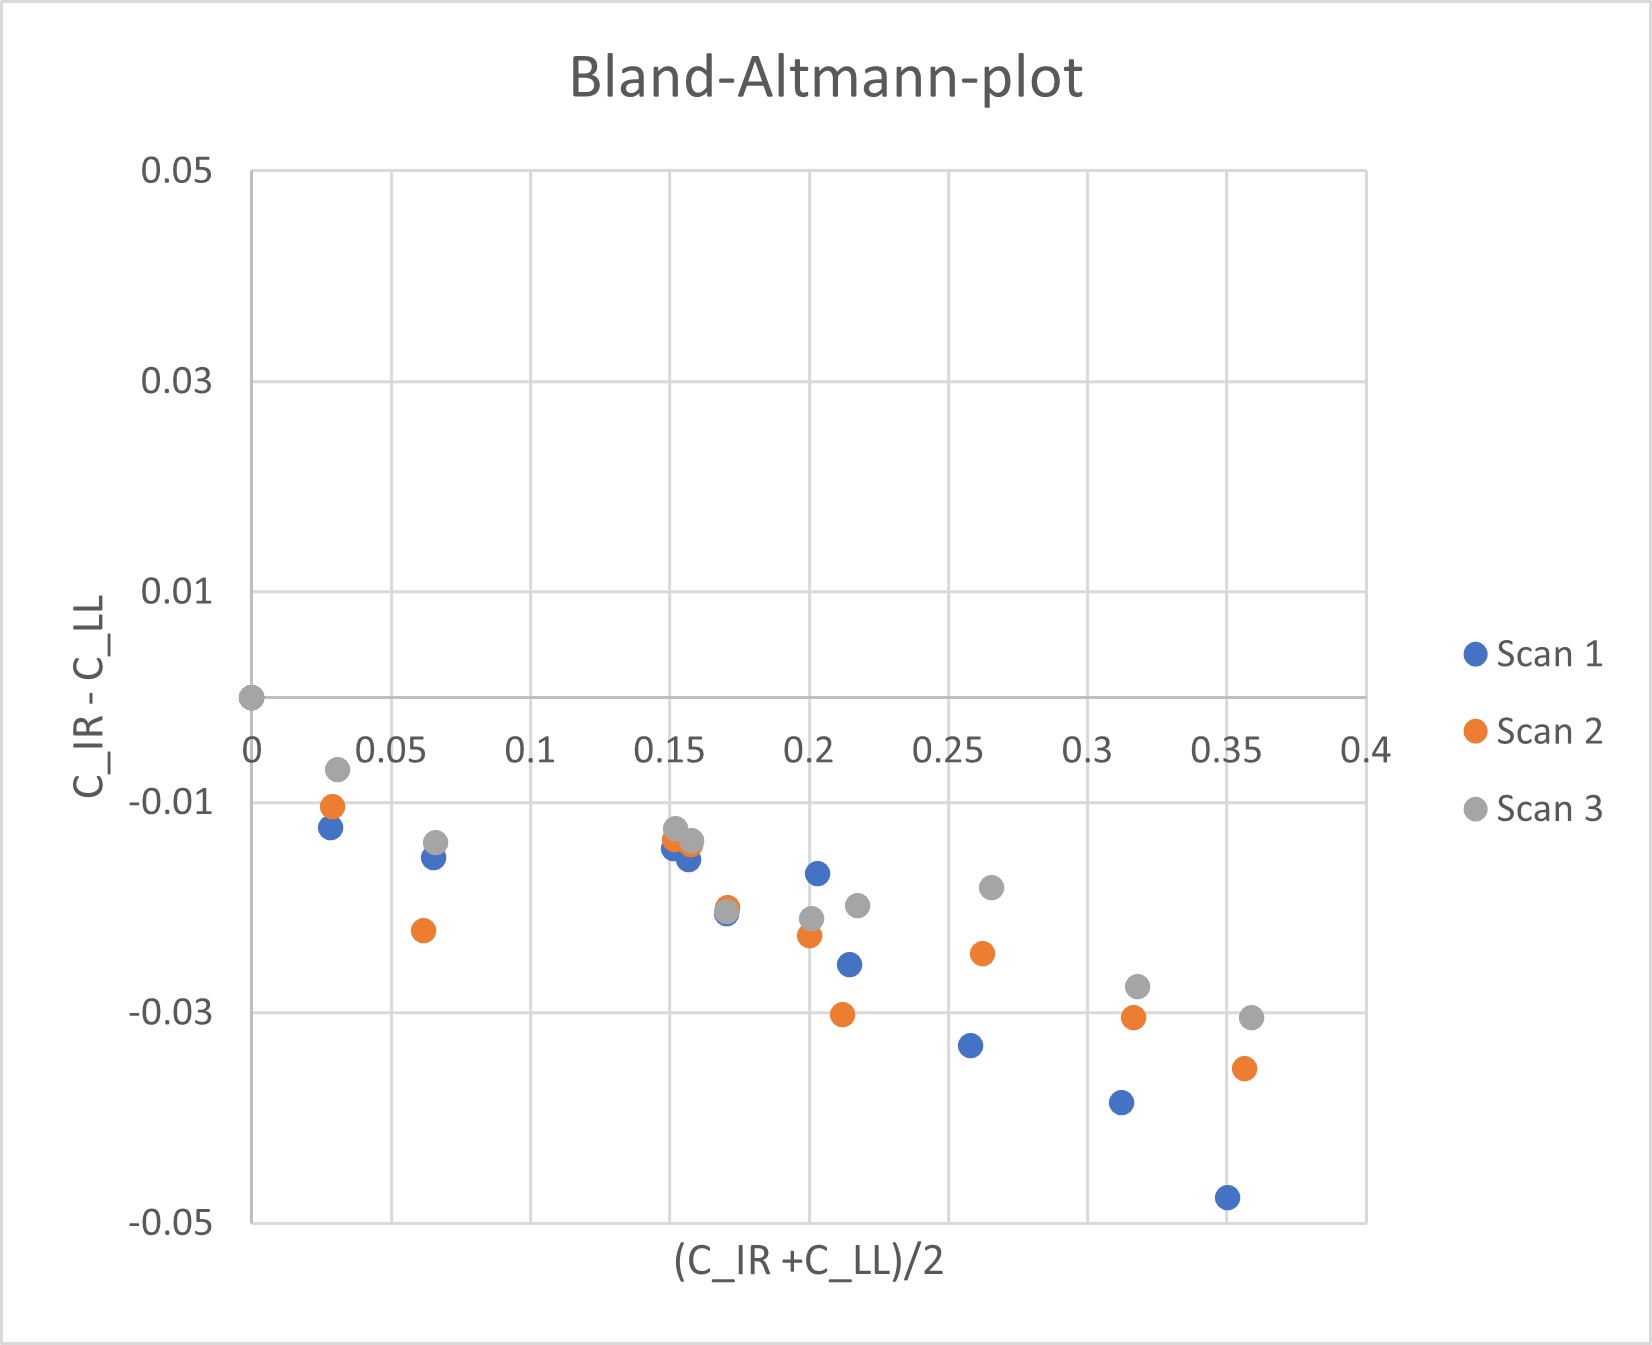
Where R10 is the relaxation rate before (i.e. in the most dilute solution) and R1i is the relaxation rate in solution i. Changes in Gadubutrol concentrations were assessed with the mixed sequence and all the 3D-LL-TFE-acquistions. Results were plotted in a scatterplot and Bland-Altman-plot to show bias.
Results
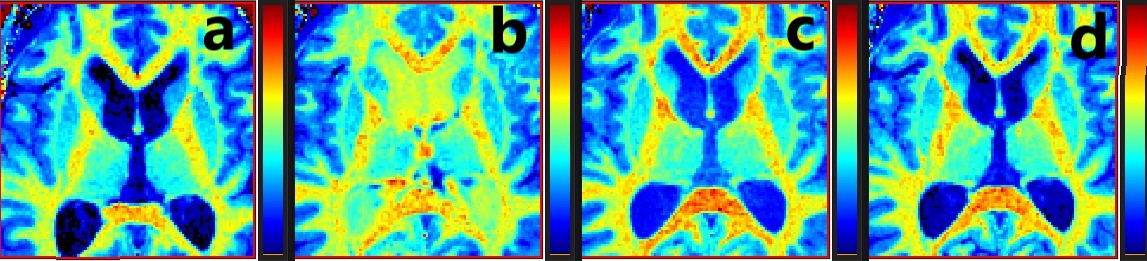
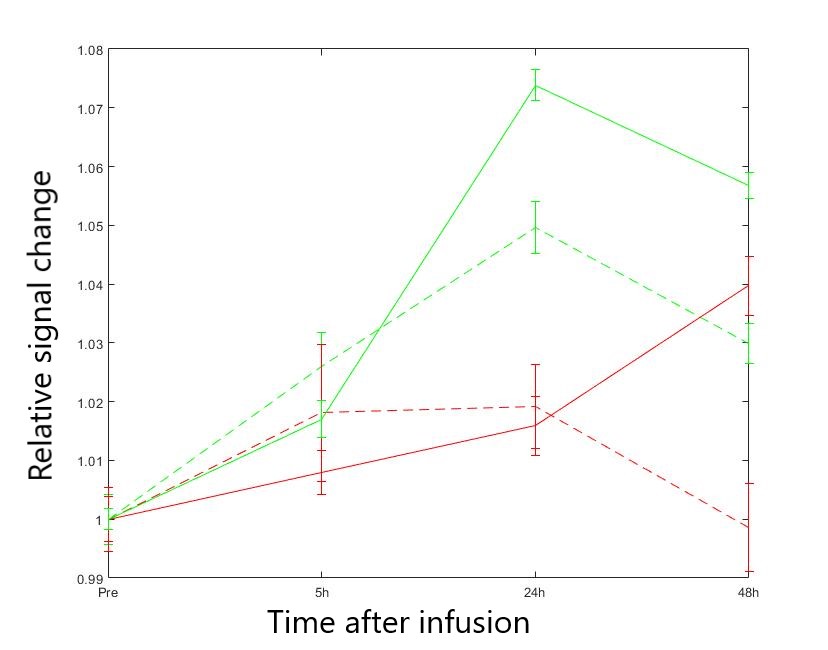
Relaxation maps obtained from the patient is shown in Figure 1. Enhancement in CSF can be seen in all post infusion maps. White matter is also slightly enhanced in all post infusion maps. Time series measured in corpus callosum, and putamen are shown in Figure 2 together with corresponding measurements performed in T1W images. In the relaxation maps, splenium of corpus callosum reach maximum after 24 hours while enhancement in putamen continues to increase to 48 hours. In measurements based on T1W images both structures show a maximum at 24 hours.A scatterplot of estimated contrast concentrations in the phantoms is shown in Figure 3. Estimates of Gadobutrol concentrations were consistently lower by the 3D-LL-TFE than the Mixed-sequence. The difference increased with concentration as can be appreciated in the Bland-Altman plot in Figure 4.
The differences in estimates were reduced when TFE-factor was reduced, and even more so when interval between inversions was increased.
Discussion
We have successfully applied a compressed SENSE accelerated 3D T1 mapping sequence to assess contrast enhancement in a time series after intrathecal contrast. The method may reduce errors propagated from uncertainty of reference measurements. In our clinical example, the two methods differed slightly in the measured time evolutions.In the phantom study we held scan time constant while investigating how to best spend the compressed SENSE acceleration. At the applied inversion interval of 3000 ms, long T1 is underestimated.
We found that given similar scan times increasing interval between inversions were more efficient than reducing saturation by reduced number of excitations.
In conclusion, we have found compressed SENSE to provide flexibility in the optimization of 3D-LL-TFE and full brain true isotropic 1mm T1 mapping is clinically feasible with this technique.
Acknowledgements
No acknowledgement found.References
1. Plog BA, Nedergaard M. The Glymphatic System in Central Nervous System Health and Disease: Past, Present, and Future. Annual Review of Pathology: Mechanisms of Disease. 2018;13:379-394. doi:10.1146/annurev-pathol-051217-111018
2. Lee S, Yoo RE, Choi SH, et al. Contrast-enhanced mri t1 mapping for quantitative evaluation of putative dynamic glymphatic activity in the human brain in sleep-wake states. Radiology. 2021;300(3). doi:10.1148/radiol.2021203784
Figures