1292
An Evaluation of the Diagnostic Quality of Machine Learning Approaches for PET Attenuation Correction in Neuroimaging: A Meta-Analysis1Medical Biophysics, Western University Ontario, London, ON, Canada, 2Lawson Health Research Institute, LONDON, ON, Canada, 3Anaesthesia, College of Medicine, Ibadan, Nigeria, 4Physics, Federal University of Technology, Minna, Nigeria, 5Clinical Physiology, Nuclear Medicine and PET, Rigshospitalet, Denmark, 6Turku PET Centre, Turku University, Turku, Finland
Synopsis
The last decade has seen an increase in the application of machine learning (ML) methods to PET/MRI attenuation correction (AC). This systematic review provides a head-to-head comparison between state-of-the-art ML methods and clinical standards for AC to determine the clinical feasibility of ML approaches PET AC. We extracted numerical values for image quality, tissue classification, regional and global diagnostic performance. The pooled mean relative error for global performance was 0.87 ± 1.3%, the quality of evidence for all outcomes ranged from moderate to very low. Our findings suggest that ML-AC performance is within acceptable limits for clinical PET/MR neuroimaging.
Introduction
Positron emission tomography (PET) scans provide highly sensitive information for measuring molecular and neurochemical changes in the brain. However, PET quantification can be limited by inaccurate estimation of attenuated PET photons, especially from brain tissue where the skull can significantly (up to 20%) bias quantitative PET information1. Established clinical standards for PET attenuation correction using either rotating transmission PET sources or bilinear scaling of measured tissue density from computed tomography (CT), provide direct and indirect approaches on standalone PET and hybrid PET/CT systems, respectively2. However, these approaches are unavailable on hybrid PET/MRI or emerging dedicated brain-only PET systems. Initial attempts to use MRI tissue signals or emitted PET data to predict tissue density for PET/MR neuroimaging demonstrated significant improvements in estimation of tissue attenuation in the head2,3. Nonetheless, lingering challenges with accurate MRI and emission PET tissue signal classification, particularly at air/tissue interfaces1,3 led to a proliferation of machine learning attempts aimed at overcoming these challenges to further improve accuracy4. Still, the diagnostic performance and robustness of ML approaches for brain PET/MRI in clinical settings remain unclear. Here, we performed a systematic review of ML AC approaches to identify promising state-of-art ML methods with validated CT or PET transmission AC standards. A head-to-head comparison was performed using meta-analysis in lieu of a direct multi-center single-test data cohort comparison.Methods
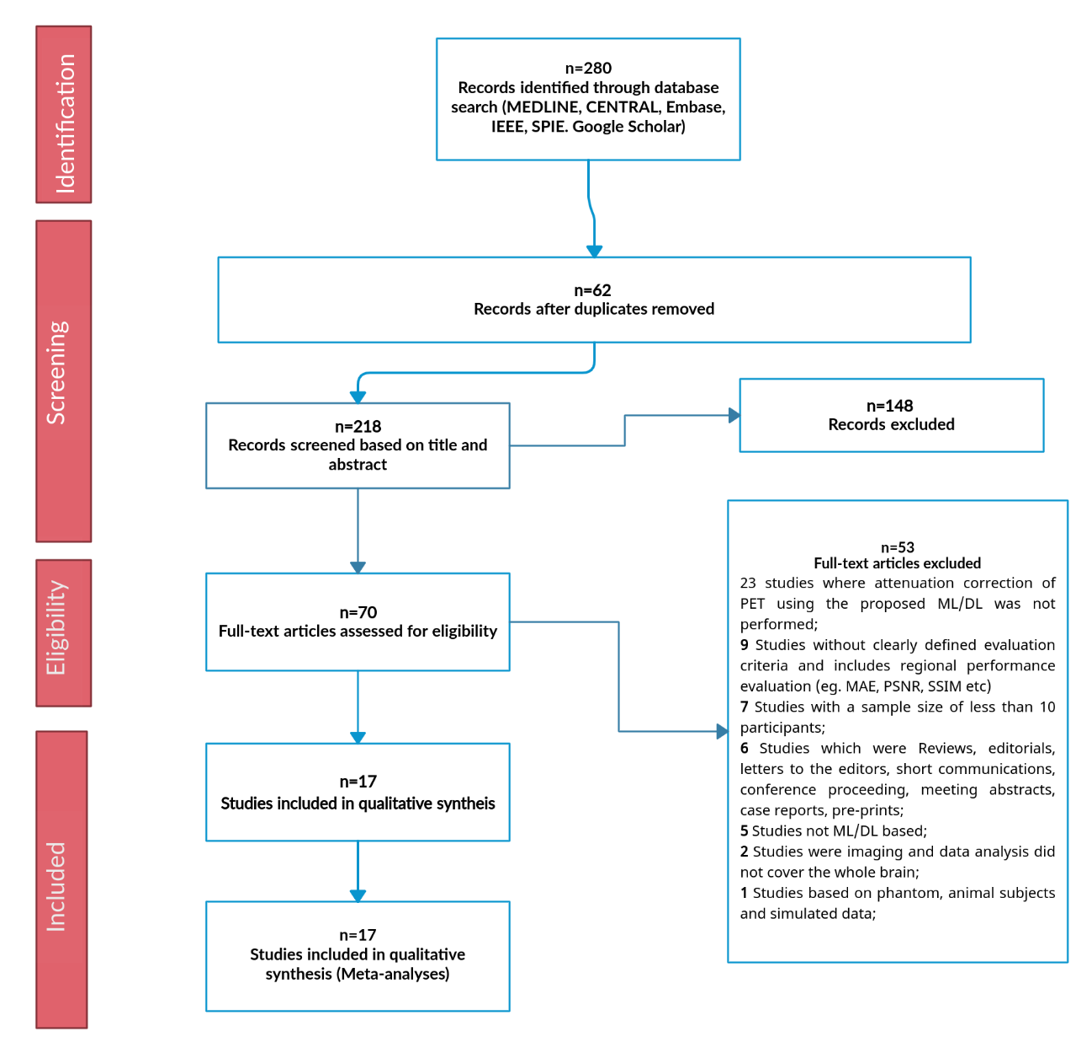
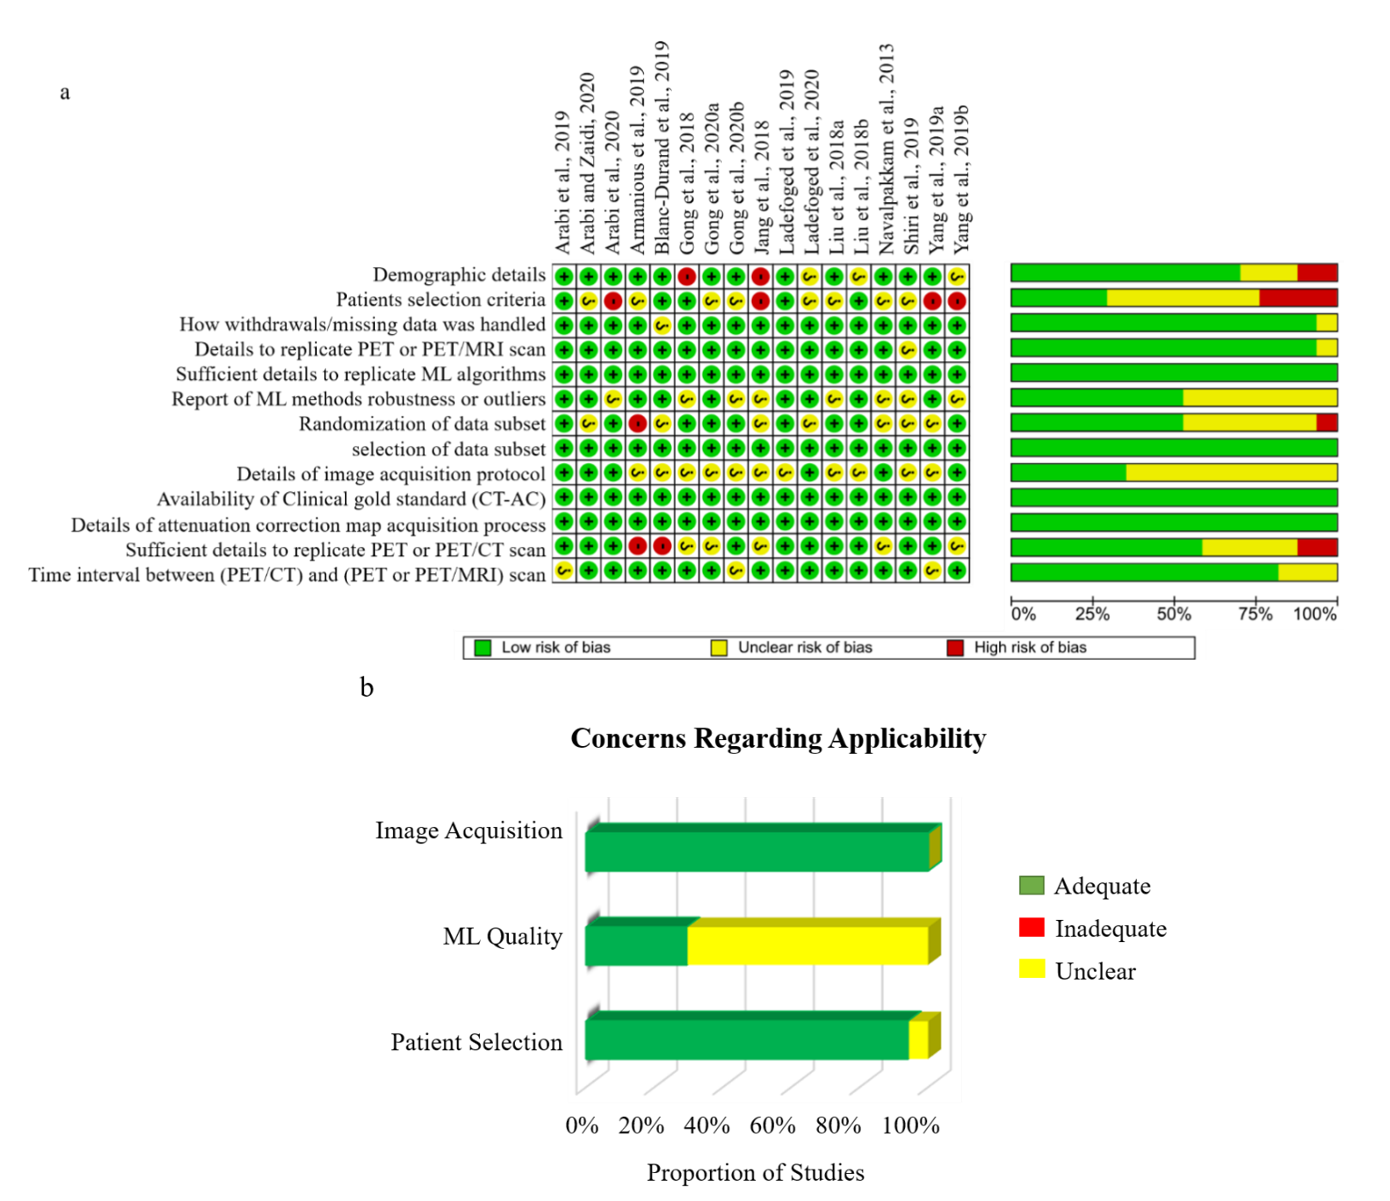
This systematic review protocol adhered to the guidelines of the Preferred Reporting Items for a Systematic Review and Meta-analysis of Diagnostic Test Accuracy Studies (PRISMA-DTA)5. A Comprehensive electronic search on MEDLINE via Ovid and PubMed interfaces, Cochrane central register of controlled trails (CENTRAL), EMBASE, IEEE Xplore digital library, and SPIE digital library was performed to include published methods from 1 January 2008 until 8 November 2021. Two independent reviewers screened titles, abstracts, and full text of the search results based on predefined eligibility criteria and extracted all data. Discrepancies between reviewers were resolved by consensus. A modified QUADAS-26 tool including several aspects of the Checklist for Artificial Intelligence in Medical Imaging (CLAIM)7 was used to assess risk of bias and concerns of applicability of the methodology reported in the included studies. Global and regional performance were estimated by comparing reported PET signal mean and standard deviation values of ML and established AC standards derived from total brain, four cortical regions (parietal, occipital, frontal, temporal), cerebellum, and common deep brain structures (caudate, putamen, and thalamus). Robustness of ML approaches was evaluated as the number of reported outliers, while image quality was assessed using reported metrics comparing synthesized CT to ground truth acquired CT, including peak signal-to-noise ratio (PSNR), root mean square error (RMSE), structural similarity index measure (SSIM), and Dice similarity score (DSC). Pooled effects of global and regional performance, and image quality were calculated to provide overall performance indicators using a random-effects model with 95% confidence interval (CI). Each study’s reported value was weighted against the participant data size.Results
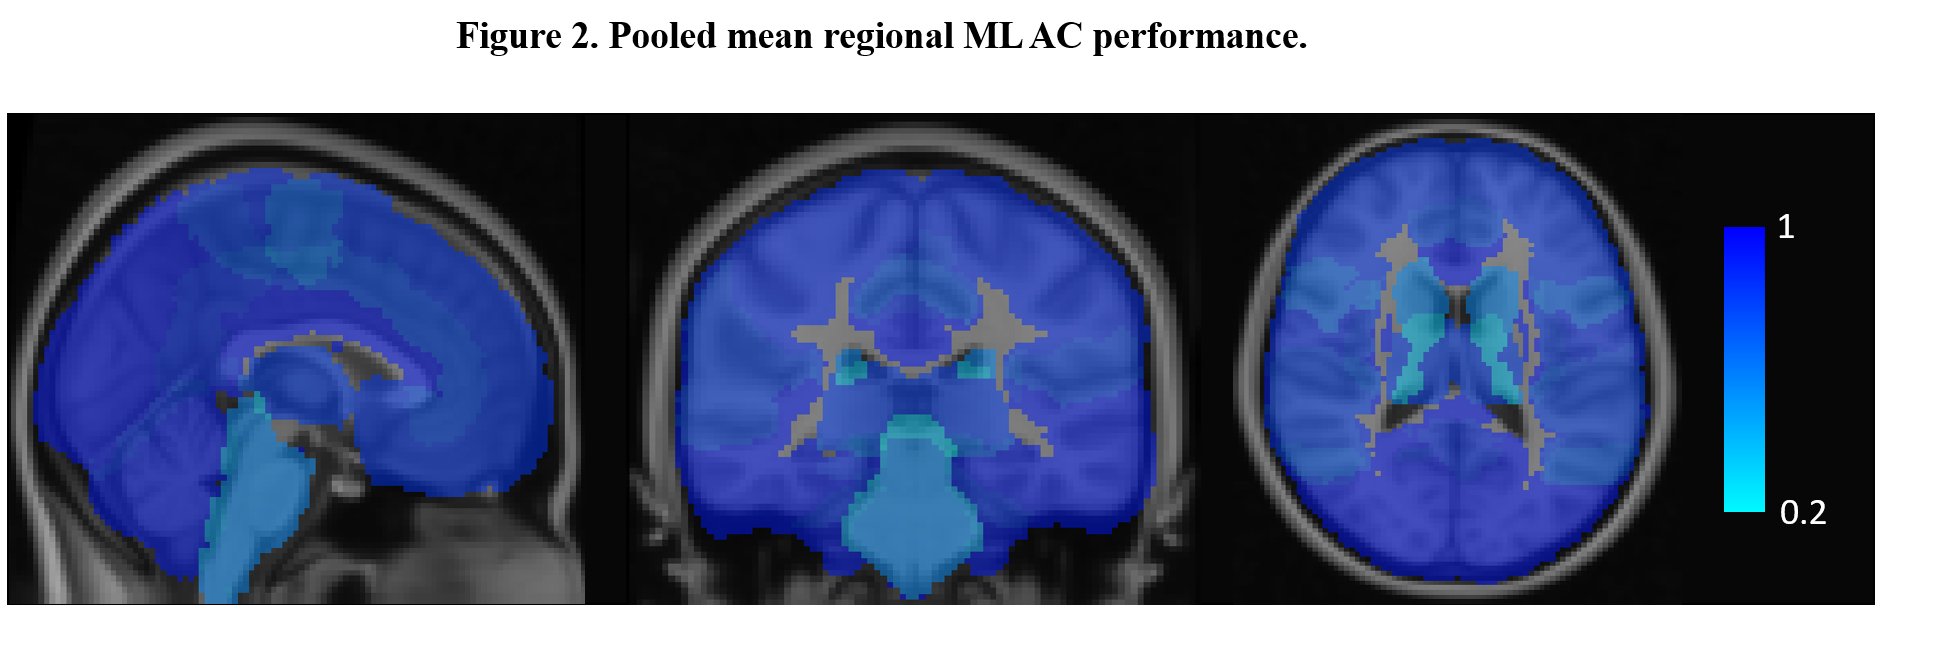
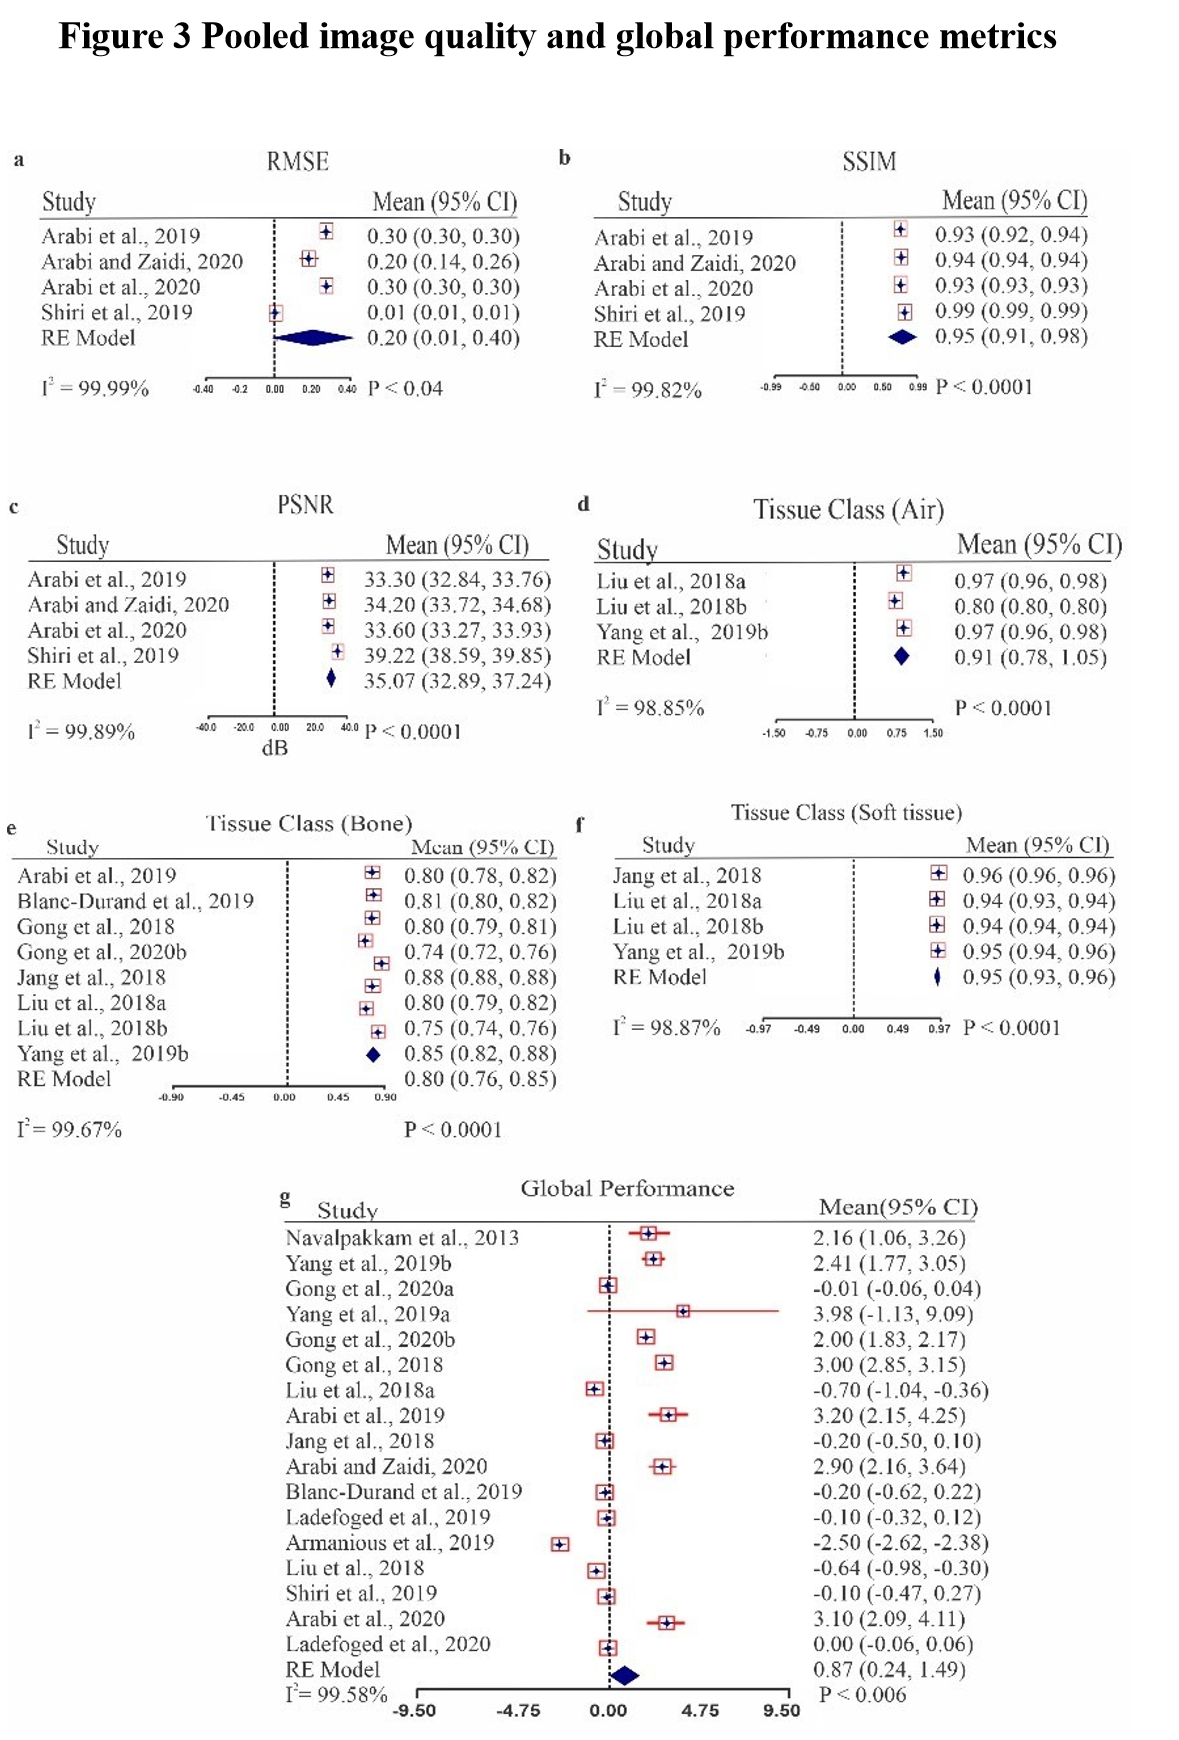
A total of 17 studies with 2074 participants were included in the systematic review (Fig. 1). Across the brain, regional performance of ML AC approaches relative to established AC standards ranged from -0.06 to 1.38% (Fig. 2, pooled estimates). The pooled mean relative error for global performance was 0.87 ± 1.3% (Fig. 3). For image quality, pooled mean for reported SSIM was 0.95, PSNR was 35.07dB, RMSE was 0.20 while for tissues class, pooled mean DSC for bone, soft tissue, and air were 0.79, 0.95, and 0.91, respectively (Fig. 3). For methodological quality, the quality of evidence for all outcomes was moderate except for the bone tissue which was very low (Fig 4). Only 3 of 17 (17.6%) studies used expert physician opinions to evaluate the clinical performance of ML-based AC, including assessment of imaging artefacts on synthesized AC images.Discussion
Machine learning-based AC holds immerse promise for clinical PET neuroimaging. Findings from this meta-analysis demonstrate that the diagnostic performance of machine learning approaches is well within acceptable limits (5% of established methods), while acknowledging that the quality of evidence was moderate. The ML methods were found to be superior to current vendor-provided implementations and outperform initial segmentation, atlas-based and reconstruction-based techniques3, particularly ML approaches with MRI inputs. Most of these ML approaches were not adequately evaluated by expert physicians with PET imaging experience, as such knowledge of potential clinical utility particularly the presence of imaging artefacts is unclear. Since only 2 of the 17 (11%) studies validated ML methods on other tracers besides FDG and only a single study (Ladefoged et al.8) investigated ML approaches in a paediatric cohort, the generalizability and wider use of these approaches remain unclear.Conclusion
In general, this study provides a consensus on the performance of current machine learning approaches for PET/MRI attenuation correction. Although ML is promising for PET/MR AC, its use in neuroimaging is still limited to research studies as only a small number of machine learning algorithms were clinically evaluated and more importantly, commercial PET/MRI systems are yet to fully implement ML AC for clinical neuroimaging. Future endeavours towards clinical utility should first leverage these existing and promising ML approaches to establish robustness, generalizability, and reproducibility for clinical PET neuroimaging.Acknowledgements
No acknowledgement found.References
1. Andersen, FL., et al. (2014). Combined PET/MR imaging in neurology: MR-based attenuation correction implies a strong spatial bias when ignoring bone. Neuroimage, 84, 206-16. doi: 10.1016/j.neuroimage.2013.08.042.
2. Teuho, J., et al. (2020). Magnetic resonance-based attenuation correction and scatter correction in neurological positron emission tomography/magnetic resonance imaging—current status with emerging applications. Frontiers in Physics, 7, 243.
3. Ladefoged CN, et al. (2017). A multi-centre evaluation of eleven clinically feasible brain PET/MRI attenuation correction techniques using a large cohort of patients. Neuroimage, 147, 346-359. doi: 10.1016/j.neuroimage.2016.12.010.
4. Lee, J. S. (2020). A Review of Deep-Learning-Based Approaches for Attenuation Correction in Positron Emission Tomography. IEEE Transactions on Radiation and Plasma Medical Sciences, 5(2), 160-184. DOI: 10.1109/TRPMS.2020.3009269.
5. Salameh JP, et al. (2020). Preferred reporting items for systematic review and meta-analysis of diagnostic test accuracy studies (PRISMA-DTA): explanation, elaboration, and checklist. bmj, 370. doi: 10.1136/bmj.m2632.
6. Whiting PF, et al. (2011). QUADAS-2: a revised tool for the quality assessment of diagnostic accuracy studies. Annals of internal medicine, 155(8), 529-536. doi: 10.7326/0003-4819-155-8-201110180-00009.
7. Gopalakrishna G, et al. (2014). Applying Grading of Recommendations Assessment, Development and Evaluation (GRADE) to diagnostic tests was challenging but doable. Journal of clinical epidemiology, 67(7), 760-768. doi: 10.1016/j.jclinepi.2014.01.006.
8. Ladefoged CN, et al. (2019). Deep learning-based attenuation correction of PET/MRI in pediatric brain tumor patients: evaluation in a clinical setting. Frontiers in neuroscience, 12, 1005. doi: 10.3389/fnins.2018.01005.
Figures