1284
Evaluation of 23Na relaxation times and concentrations in the patellar knee cartilage at 3T1University Dusseldorf, Medical Faculty, Department of Diagnostic and Interventional Radiology, Dusseldorf, Germany, 2University Dusseldorf, Medical Faculty, Clinic of Nuclear Medicine, Dusseldorf, Germany, 3Institute of Radiology, University Hospital Erlangen, Friedrich-Alexander-Universität Erlangen-Nürnberg 14 (FAU), Erlangen, Germany, 4Division of Medical Physics in Radiology, German Cancer Research Center (DKFZ), Heidelberg, Germany, 5Russell H. Morgan Department for Radiology and Radiological Science, The Johns Hopkins University 18 School of Medicine, Baltimore, MD, United States, 6F. M. Kirby Research Center for Functional Brain Imaging, Kennedy Krieger Institute, Baltimore, MD, United States
Synopsis
23Na relaxation times and concentrations were measured in patellar cartilage with a clinical 3T MRI scanner. Because of the low resolution in 23Na imaging, a focus was set on reducing the influence of synovial fluid. To estimate T1 a biexponential two-compartment fitting model was applied. In T2* measurements, an inversion pulse was used to suppress the signal from synovial fluid. 23Na parameters were successfully determined and are in good accordance to literature results measured at higher field strengths.
Introduction
23Na MRI has the potential to depict cartilage health. While the estimation of 23Na concentration in cartilage is a widely accepted indicator of proteoglycan content and can therefore be used as an early indicator of cartilage degradation, it has also been shown in vitro that 23Na relaxation times differ with changing proteoglycan content in cartilage.1 However, the resolution of 23Na imaging at 3T (in our case 3x3x3 mm3) results in partial volume effects that may cause the synovial fluid signal to spill into the cartilage signal, which affects the accurate estimation of cartilage 23Na parameters. Therefore, this study aimed to determine sodium relaxation times and to quantify sodium concentrations in patellar cartilage while reducing the impact of synovial fluid.Methods
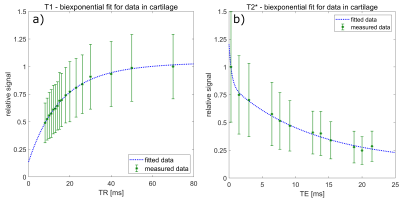
The study was conducted using a clinical 3T MRI scanner (Siemens MAGNETOM Prisma, Siemens Healthineers, Erlangen, Germany) and a dual-tuned 23Na/1H surface coil (RAPID Biomedical GmbH, Rimpar, Germany). Imaging was performed with the dual-tuned coil placed on top of the knee while using a density adapted 3D radial sequence.2 Two dedicated protocols were applied to determine T1 and T2* relaxation times of 23Na. For each protocol, data were acquired from the right knee of 10 healthy volunteers (protocol 1: 4 females, 6 males, mean age 23 ± 3 years; protocol 2: 3 females, 7 males, mean age 23 ± 2 years) and the affected knee of one patient each with retropatellar chondropathy (protocol 1: female, age 66 years, left knee; protocol 2: female, age 30 years, right knee). The patients were studied further using proton-density and T1-weighted sequences for clinical reference (Figure 1). In protocol 1 23Na data was acquired using 17 different TR for T1 fitting with a biexponential two-compartment model to differentiate the longitudinal relaxation times of cartilage (T1,car) and synovial fluid (T1,syn). In protocol 2 multi-echo 23Na data was acquired with 12 different TEs while using an inversion pulse to suppress the signal of synovial fluid. Again, the data were fitted biexponentially, but in this case because 23Na has a nuclear spin of 3/2 and subsequently short (T2s*) and long (T2l*) components of the transversal relaxation have been determined. An experienced radiologist marked the regions of interest, delineating the outer contours of the cartilage. Mean voxel values were used to perform fitting procedures. Furthermore, 23Na concentrations were determined using the images with the longest TR (70 ms) from protocol 1 and the images with the shortest TE (0.3 ms) from protocol 2. As reference, three cylindrical phantoms with 4% agarose and different 23Na concentrations (50 mmol/l, 100 mmol/l and 200 mmol/l) were placed medially on the knee. Corrections for partial volume effects and different relaxation times between phantoms and cartilage were applied to the calculated 23Na concentrations. The resulting concentration values of protocol 1 and 2 were tested for significant difference using a Wilcoxon signed-rank test.Results
23Na relaxation times were successfully measured in both healthy volunteer groups (T1,car = 14.5 ± 0.7 ms; T1,syn = 37.9 ± 2.9 ms; T2s* = 0.35 ± 0.11 ms; T2l* = 12.6 ± 0.7 ms; Figure 2). The relaxation times of the patients show a trend to elongated T1,car and T2l* and shortened T2s* (T1,car = 15.4 ± 0.2 ms; T1,syn = 39.8 ± 0.9 ms; T2s* = 0.10 ± 0.09 ms, T2l* = 14.0 ± 0.7 ms). Mean sodium concentrations did not differ significantly between both volunteer cohorts (protocol 1: 200.1 ± 47.7 mmol/l; protocol 2: 215.3 ± 44.1 mmol/l; p = 0.44; Figure 3). The patients showed a trend for lower sodium concentrations (protocol 1: 157.8 ± 30.2 mmol/l; protocol 2: 135.2 ± 28.9 mmol/l; Figure 3).Discussion
The results for 23Na relaxation times in healthy volunteers are in line with current literature, as is the tendency for elongated T1,car and T2l* and shortened T2s* in patients.1,3 For the estimation of 23Na concentration in cartilage no significant difference between the volunteer groups of protocol 1 and 2 could be shown, but differentiability between healthy volunteers and patients seemed improved in participants measured with protocol 2.Conclusion
In conclusion, a determination of 23Na relaxation times in patellar cartilage while considering the influence of synovial fluid is possible at a clinical field strength of 3T to quantify 23Na concentrations, which might be a valuable tool to determine cartilage health.Acknowledgements
No acknowledgement found.References
1. Insko EK, Kaufman JH, Leigh JS, Reddy R. Sodium NMR evaluation of articular cartilage degradation. Magn Reson Med. 1999;41(1):30-34. doi:10.1002/(SICI)1522-2594(199901)41:1<30::AID-MRM6>3.0.CO;2-U
2. Nagel AM, Laun FB, Weber MA, Matthies C, Semmler W, Schad LR. Sodium MRI using a density-adapted 3D radial acquisition technique. Magn Reson Med. 2009;62(6):1565-1573. doi:10.1002/mrm.22157
3. Madelin G, Jerschow A, Regatte
RR. Sodium relaxation times in the knee joint in vivo at 7T. NMR
Biomed. 2012;25(4):530-537. doi:10.1002/nbm.1768
Figures


