1282
2D ultra-short TE imaging for 23Na MRI using half-pulse excitation1Department of Biomedical Engineering, The University of Melbourne, Parkville, Australia
Synopsis
This work implements 2D ultra-short TE (UTE) imaging for 23Na using half-pulse excitation. The sequence was examined in numerical simulations and phantom experiments at 7T. 2D UTE 23Na imaging is shown to be less prone to partial volume effects than conventional radial 3D sodium imaging and able to produce high in-plane resolution 23Na images.
Introduction
Total sodium concentration mapping has been used in a range of research studies (see [1] for review). Acquisition of the rapid tissue sodium transverse relaxation requires UTE sequences, usually implemented with volumetric acquisitions such as 3D projection reconstruction (PR). However, 3DPR is prone to partial volume effects (PVE) and undersampled aliasing that decrease the accuracy of sodium quantification 2,3. Besides, isotropic resolution may be disadvantageous at high resolution, as SNR decreases cubically with voxel size leading to unrecoverable signal loss.Conventional 2D imaging has lower sampling requirement but the minimum TE is in milliseconds due to the existence of the rephasing lobe. The rephasing lobe can be eliminated using half-pulse excitation 4, which has been demonstrated in 23Na cardiac MRI to reduce the scan time 5. This work explores 2D UTE imaging with half-pulse excitation for high-resolution 23Na MRI. We show that 2D imaging with half-pulse excitation can reduce PVE and aliasing, and enables anisotropic resolution that compensates SNR loss associated with the increased in-plane resolution.
Methods
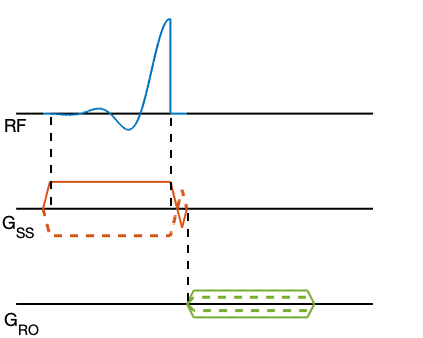
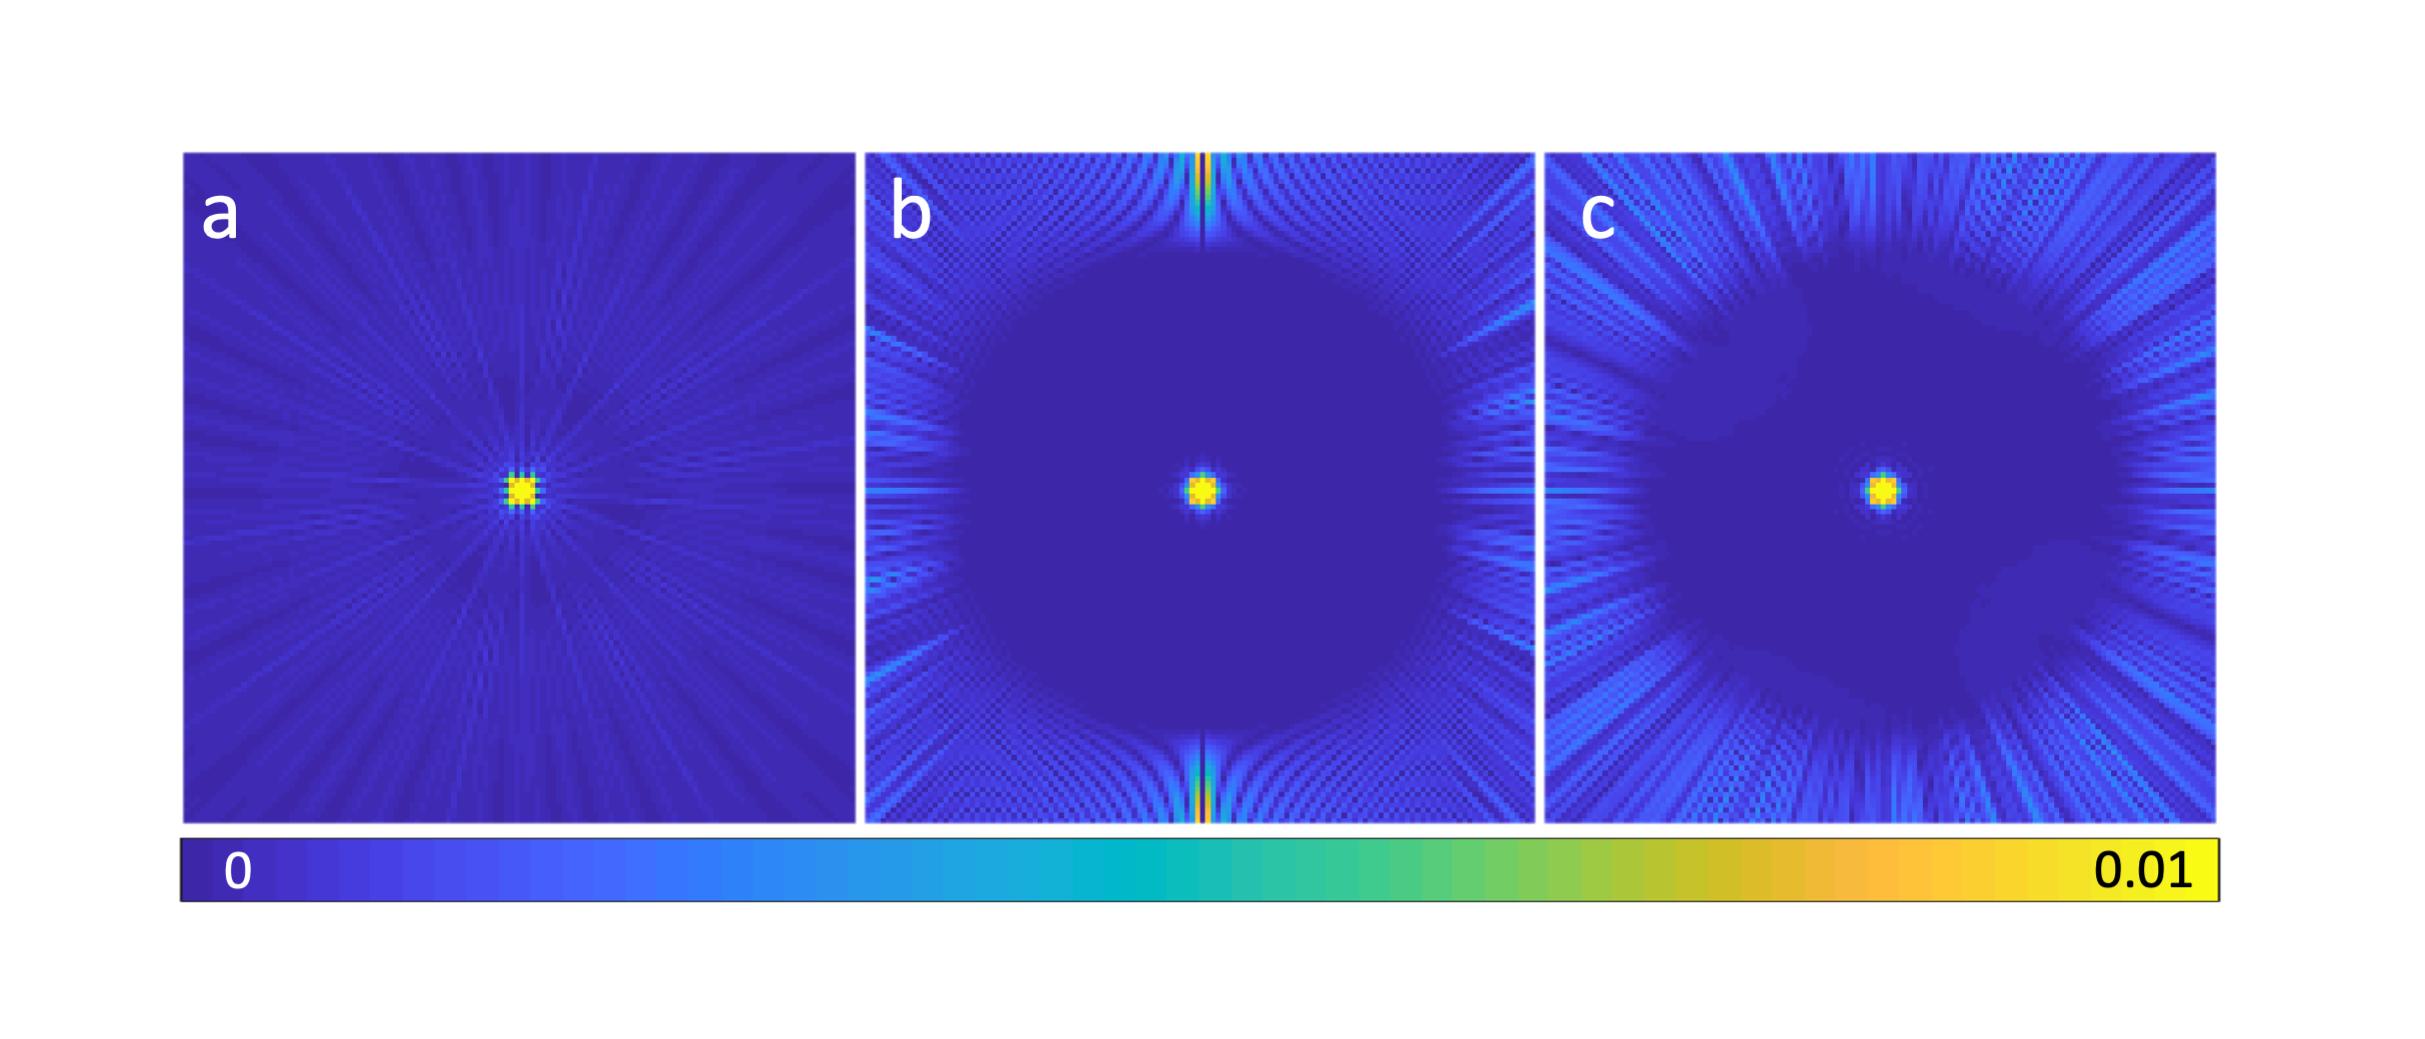
The 2D UTE sequence consists of a half sinc pulse with a slice-selective (SS) gradient. The transverse magnetisation is in phase at the end of the half pulse. After a short rephasing gradient that cancels the gradient moment during the SS gradient ramp-down, a centre-out readout (RO) gradient follows (Fig. 1).To simulate the PSF for 2DPR and 3DPR, radial spokes, distributed in the k-space according to the acquisition schemes, were Fourier transformed by the NUFFT algorithm, after they were density compensated and Hann filtered. FOV of 200 mm, resolution of 1.6 mm and 6000 spokes were chosen to be the simulated setting. For 2DPR, the spokes were distributed by golden angle method 6. For 3DPR, the Saff and Kuijlaars’ algorithm 7 was used.
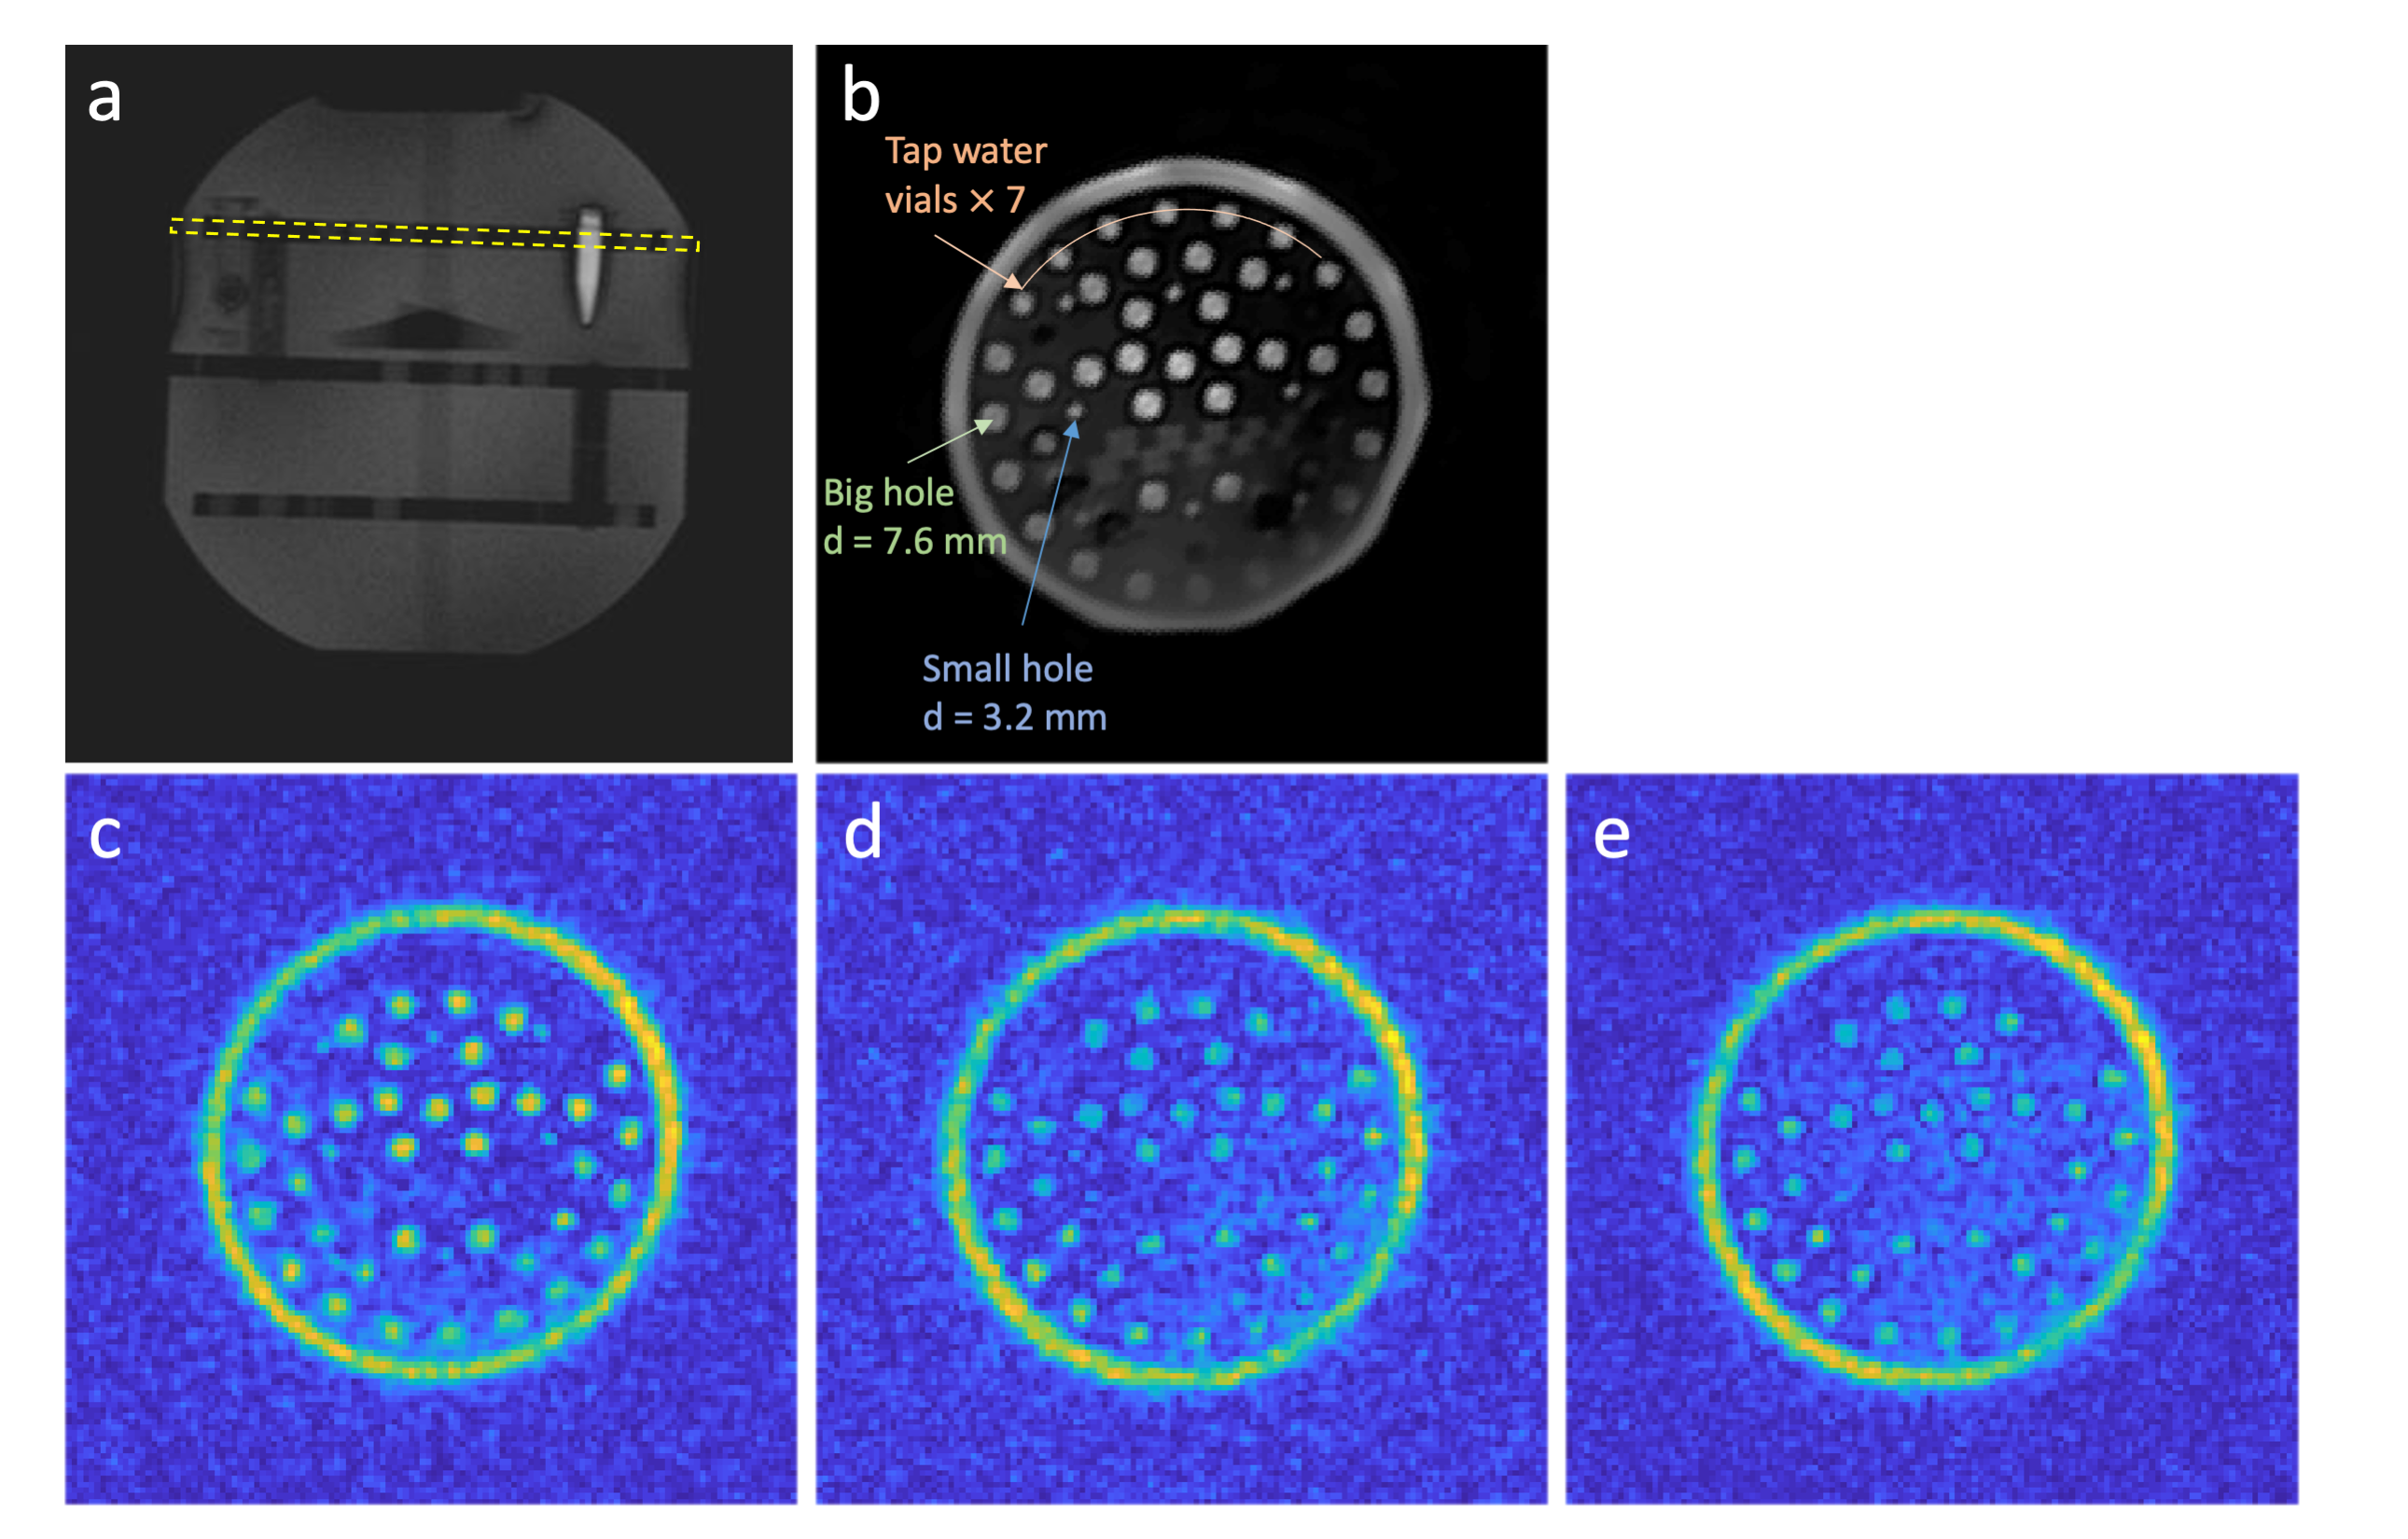
Phantom experiments were performed on a 7T MRI scanner (Siemens Healthineers, Germany) with a 1H/23Na dual-tuned head coil (QED, USA). The phantom consisted of vials and PMMA discs, filled with saline. Proton images were used to describe the phantom structure and the slice position (Fig. 3a,b). 2DPR: A 5-mm slice was excited by the half pulse modified from an apodized sinc pulse, with 60° flip angle, 4-ms length, time-bandwidth product of 8 and SS gradient magnitude of 17.7 mT/m, TE/TR = 0.25/140 ms, readout length TRO = 12 ms, TA = 14 min. 3DPR: Rectangular pulse length = 0.5ms, FA = 60°, TE/TR = 0.4/140 ms, TRO = 12 ms, TA = 14 min. The FOV and resolution choices were identical to PSF simulations. The reconstruction pipelines followed the procedures described for simulations, with 3DPR k-space coordinates adjusted by a 3D rotation matrix so that the image coronal plane was parallel with the PMMA disc.
Results
The simulated PSF of 2DPR contains significantly reduced streaking artifacts compared to the undersampled 3DPR PSF (Fig. 2). The full width at half maximum (FWHM) is 2.12 pixels for 2DPR and 2.32 pixels for 3DPR. The resultant FWHM values are only associated with the acquisition schemes. Those of real data are larger due to T2 blurring.The 5-mm thick phantom slice acquired by 2DPR demonstrates the ability of half-pulse UTE acquisition to resolve the small holes on the disc (Fig. 3c). For comparison, a 1.6mm thick 3DPR slice was selected (Fig. 3d). In addition, a 4.8mm thick slice was also generated by summing three consecutive slices within the disk (Fig. 3e). These two images suffer from impaired contrast as the voxel intensities increase in the “null-signal” solid region of the phantom, and hence the small holes are barely distinguishable. SNR measurements for the large holes are 10.8 (2DPR), 9.1 (3DPR, 4.8mm) and 7.0 (3DPR, 1.6mm).
Discussion
Our simulations show that 2DPR attains a good PSF with a practical number of radial spokes. The phantom experiment demonstrates that 2DPR achieves higher fidelity than 3DPR. The loss of contrast in 3DPR can be explained by the PSF simulation results; 3DPR PSF introduces PVE from adjacent saline surrounding the disc and its steaking artifacts accumulate within the phantom, leading to the contamination. The slice selection of 2DPR reduces this contamination.2DPR enables a more flexible trade-off between SNR and slice thickness, which is beneficial in obtaining high-resolution 23Na images. According to the SNR relationship 8, 2DPR image is 1.8 times higher than 4.8mm 3DPR and 3.1 times higher than 1.6mm 3DPR. In the phantom experiment, the measured SNR increase is lower. This may be related to the distorted slice profile and the lack of eddy current correction for the half-pulse excitation, as well as the strong PVE and the 3D Hann filtering in 3DPR.
Our results have demonstrated 2DPR of 23Na in saline, while 23Na signal in tissue has been shown to have broader PSF 9; this may result in slice widening and attenuation during the slice selective excitation. Further investigation will validate the UTE 2DPR on a phantom with slow-motion environments, as well as in-vivo imaging.
Conclusion
This work implemented high resolution UTE 2DPR with half-pulse excitation for 23Na MRI. The simulations and phantom experiments have shown that 2DPR can reduce the SNR loss and improve the image fidelity in high in-plane resolution imaging.Acknowledgements
We acknowledge the facilities, and the scientific and technical assistance of the Australian National Imaging Facility, a National Collaborative Research Infrastructure Strategy (NCRIS) capability, at the Melbourne Brain Centre Imaging Unit of the University of Melbourne. The work was also supported by a research collaboration agreement with Siemens Healthineers.References
[1] Madelin G, Regatte RR. Biomedical applications of sodium MRI in vivo. Journal of Magnetic Resonance Imaging. 2013:511-29.
[2] Niesporek, Sebastian C., et al. "Partial volume correction for in vivo 23Na-MRI data of the human brain." Neuroimage (2015): 353-363.
[3] Gurney, Paul T., Brian A. Hargreaves, and Dwight G. Nishimura. "Design and analysis of a practical 3D cones trajectory." Magnetic Resonance in Medicine: An Official Journal of the International Society for Magnetic Resonance in Medicine (2006): 575-582.
[4] Pauly, John, Dwight Nishimura, and Albert Macovski. "A k-space analysis of small-tip-angle excitation." Journal of Magnetic Resonance (1989): 43-56.
[5] Konstandin, Simon, et al. "Two‐dimensional radial acquisition technique with density adaption in sodium MRI." Magnetic resonance in medicine (2011): 1090-1096.
[6] Winkelmann, Stefanie, et al. "An optimal radial profile order based on the Golden Ratio for time-resolved MRI." IEEE transactions on medical imaging (2006): 68-76.
[7] Saff, Edward B., and Amo BJ Kuijlaars. "Distributing many points on a sphere." The mathematical intelligencer (1997): 5-11.
[8] Brown, Robert W., et al. Magnetic resonance imaging: physical principles and sequence design. John Wiley & Sons, (2014).
[9] Rahmer, Jürgen, et al. "Three‐dimensional radial ultrashort echo‐time imaging with T2 adapted sampling." Magnetic Resonance in Medicine (2006): 1075-1082.
Figures