1281
Towards standardising quantification in 23Na-MRI by synthetic polyacrylamide gel phantoms1NMR Research Unit, Queen Square MS Centre, Department of Neuroinflammation, UCL Queen Square Institute of Neurology, Faculty of Brain Sciences, University College London, London, United Kingdom, 2Department of Medical Physics and Biomedical Engineering, University College London, London, United Kingdom, 3Gold Standard Phantoms, London, United Kingdom, 4Department of Brain Repair and Rehabilitation, UCL Queen Square Institute of Neurology, Faculty of Brain Sciences, University College London, London, United Kingdom, 5Department of Brain & Behavioural Sciences, University of Pavia, Pavia, Italy, 6Brain Connectivity Centre Research Department, IRCCS Mondino Foundation, Pavia, Italy
Synopsis
Accuracy in quantitative 23Na (sodium) MRI is impacted by the quality of the signal calibration phantom. Agarose phantoms, the current benchmark, exhibit various unfavourable qualities. To move towards standardisation in 23Na-MRI, the objective was to develop a synthetic, polymer-based calibration phantom for traceable, reliable and accurate quantification in 23Na-MRI. Crosslinked polyacrylamide gel (PAG) was selected as the most suitable choice, for its bi-exponential 23Na T2 decay. Here, we present the T1, T2 properties and 23Na-MRI data of prototype PAG phantoms at different 23Na concentrations. PAG emerges as a reliable choice to replace the ubiquitous agarose gel phantom.
Introduction
23Na (sodium) ions are essential in many physiological processes in the human body1, and 23Na-MRI has been shown to provide a unique insight into such (patho)physiology2. Due to its quadrupolar 3/2-spin nucleus, 23Na MR-signal decay is rapid and sensitive to molecular environment3, e.g. exhibiting bi-exponential T2 in brain tissue4,5.Accurate quantification of concentration in 23Na-MRI relies on the quality of the calibration phantom: ideally, it must (a) share similar relaxation properties to tissue, (b) exhibit structural homogeneity, (c) be consistent across batches, (d) stable over time.
Typically, agarose gel is used for 23Na-MRI calibration phantoms6. Although it fulfils characteristics (a) and (b), it can be challenging to prepare to a consistent, high standard. As evaporation occurs throughout preparation at high temperatures, the sodium concentration will rise by an unknown amount. Further, as agarose is a naturally derived substance, its molecular structure (therefore T1/T2 values) could be inconsistent across batches. Agarose may also deteriorate with time7. Combined, this poses a challenge in achieving accuracy and traceability in longitudinal or multi-centre quantitative 23Na-MRI studies. We believe there is a need for a new class of robust sodium phantoms, paving the way towards standardising 23Na-MRI quantification.
Here, we assess the suitability of crosslinked polyacrylamide gel (PAG) phantoms by characterising the T1, T2 parameters and stability over time, for different sodium concentrations. We also present 23Na-MRI imaging data.
Methods
PreparationPAG was prepared at a 10% monomer concentration, of which 25% was bis-acrylamide crosslinker. For synthesis, monomers were combined with ammonium persulfate and the polymerisation initiator, Tetramethylethylenediamine (TEMED). 7 samples were prepared at sodium concentrations of 10mM-150mM and doped with nickel chloride (NiCl2, of 0.3mM-4.5mM) for 1H contrast. Fig. 1 gives an overview of sample compositions, including actual concentrations, which were evaluated volumetrically after polymerisation.
Acquisition
Phantoms were scanned on a 3.0T Ingenia CX system (Philips Healthcare, Best, The Netherlands) with a single-channel birdcage sodium coil (RAPID Biomedical GmbH, Germany). Vials were in a holder containing potassium chloride solution for coil loading and shimming. To measure relaxation parameters, a non-localised free induction decay pulse-acquire spectroscopy protocol was utilised, with time to acquisition=0.25ms; TR=200ms; readout=86ms; BW=6000Hz; no. acquisition samples=512; averages=400. For T1 measurement, a 180º inversion pulse was prepended, with inversion times spaced logarithmically from 5ms-120ms. Phantoms were imaged using a UTE 3D-cones8,9 sequence with time to acquisition=0.22ms, TR=120ms, readout=7ms, averages=3, resolution=3mm isotropic.
Analysis
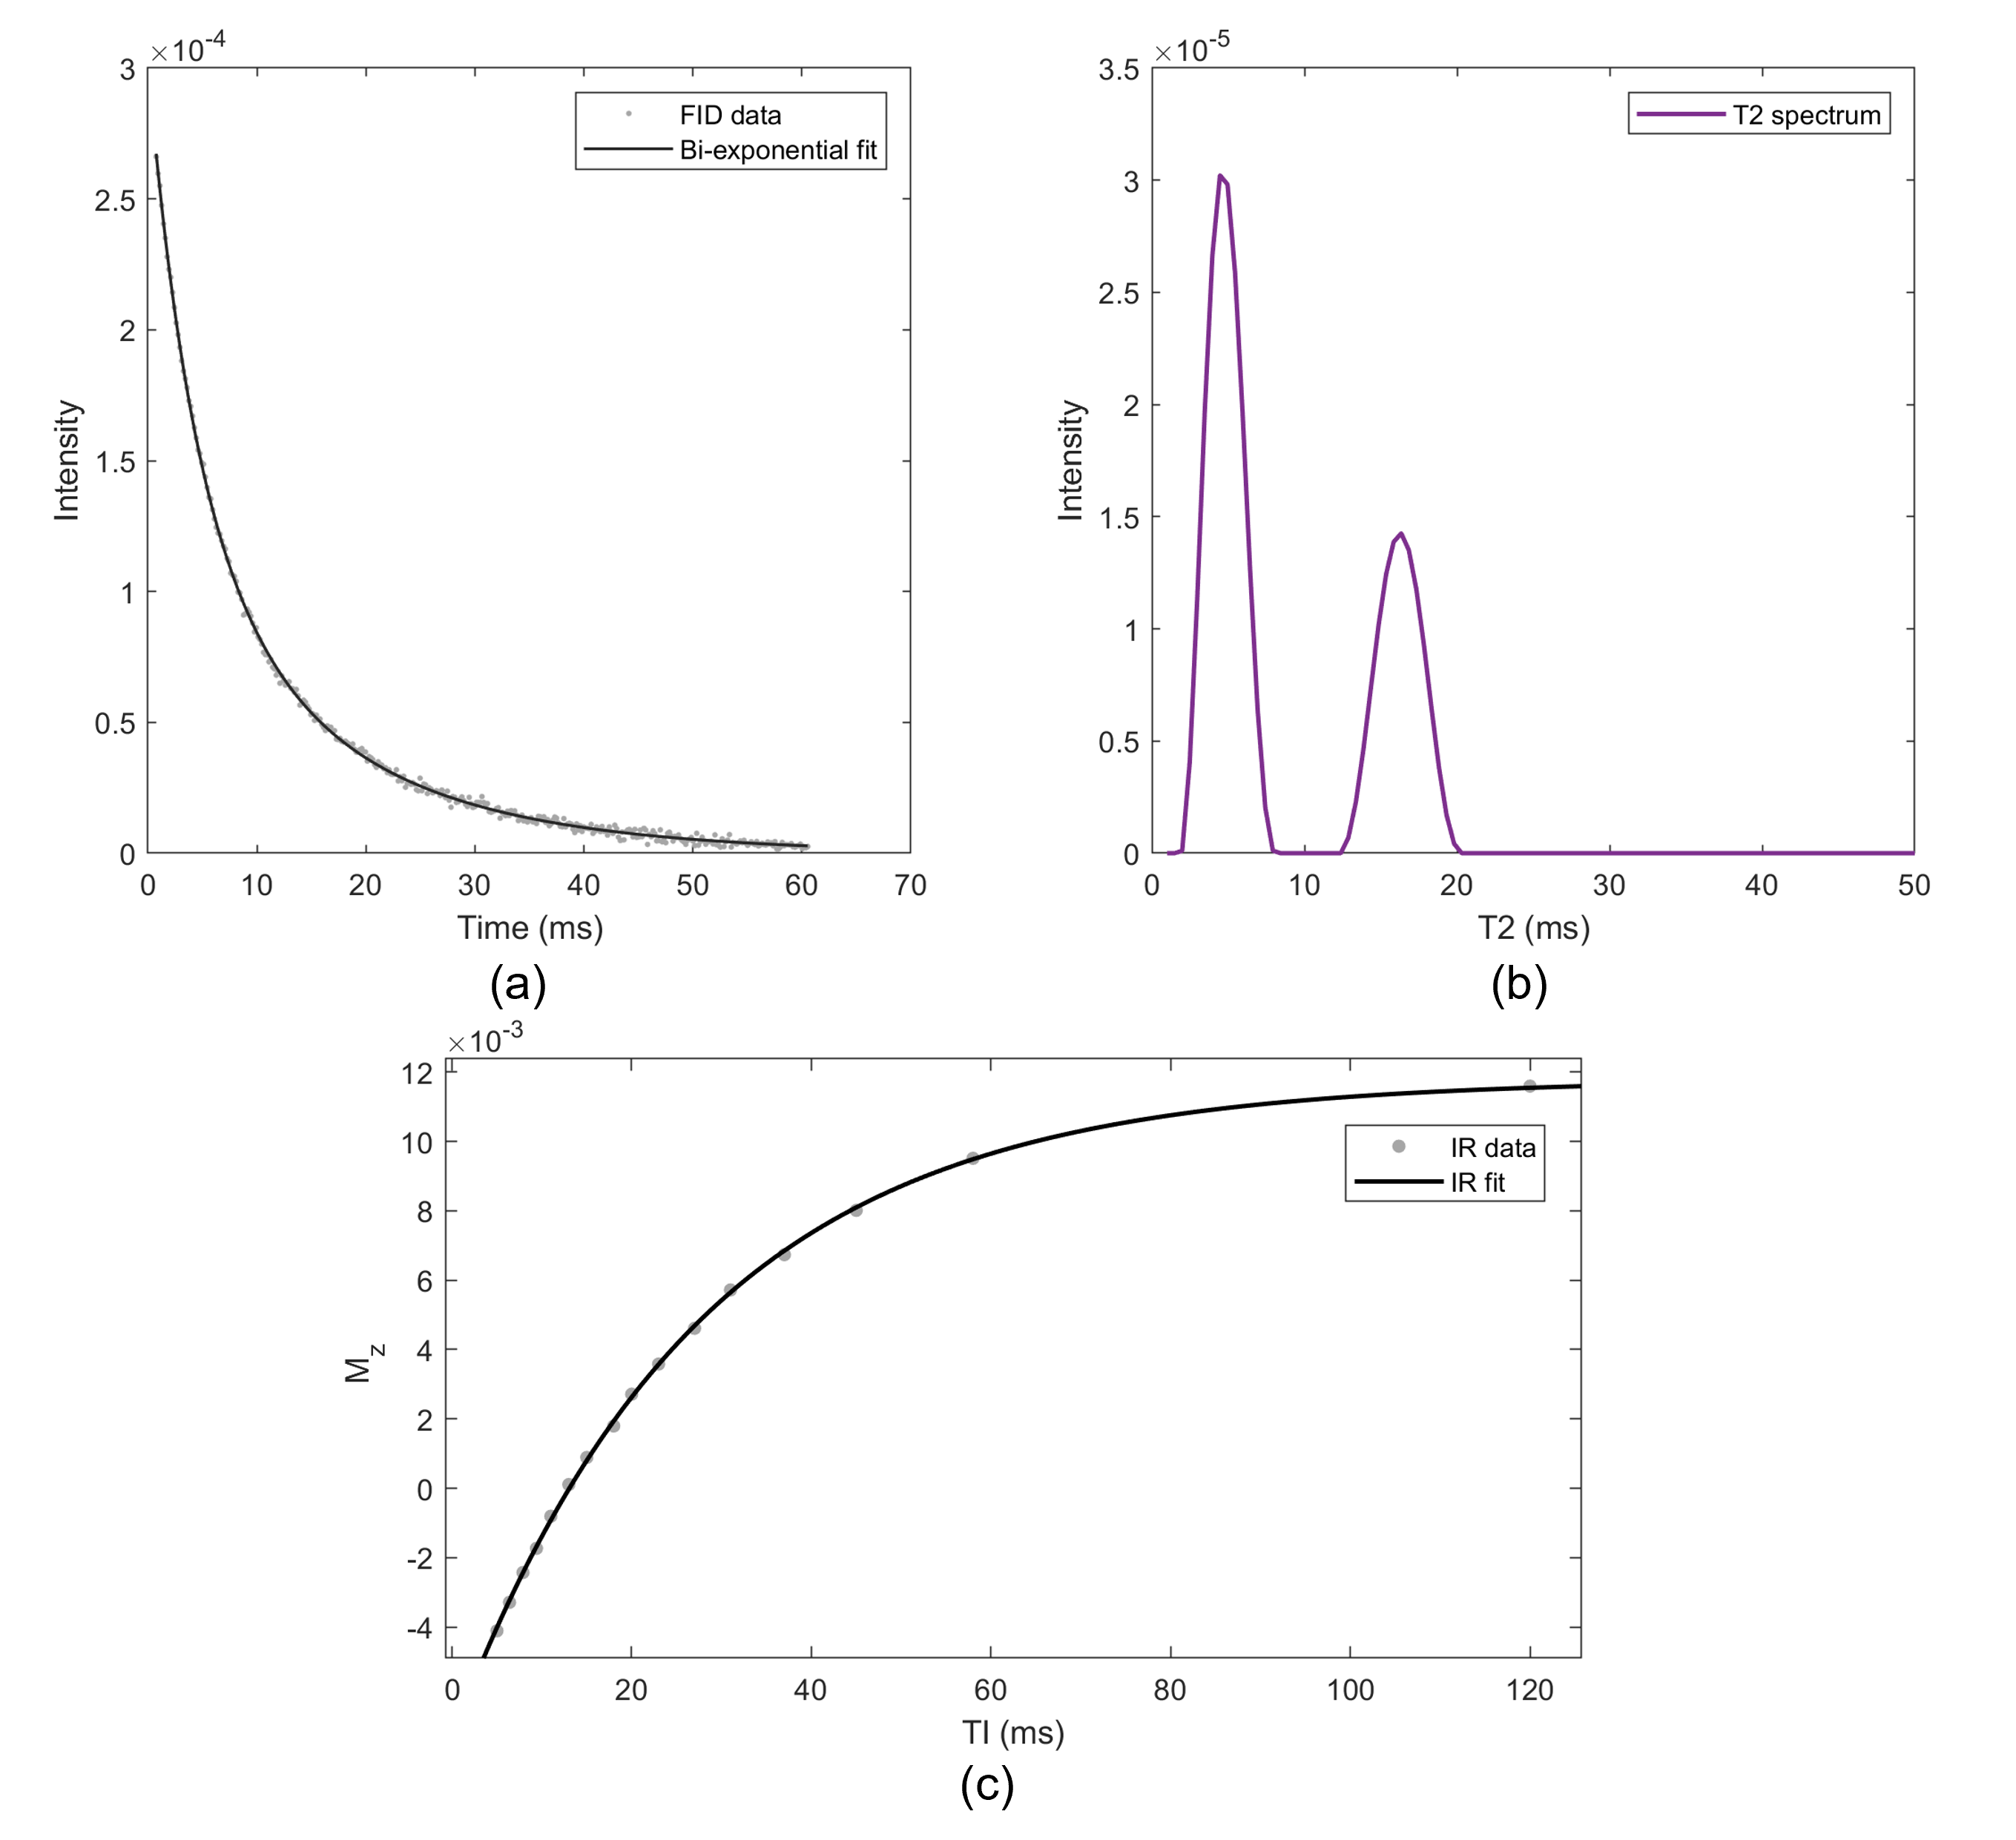
To estimate T2 values, a multi-exponential signal model was fitted in MATLAB, utilising Marino’s implementation10 of Provencher’s CONTIN11, a continuous fitting routine that approximates the inverse Laplace transform. Mono-exponential T1 values were estimated by fitting the inversion recovery equation, including an additional parameter to account for imperfect flip-angle optimisation. Images were segmented using ITK-Snap12.
Results
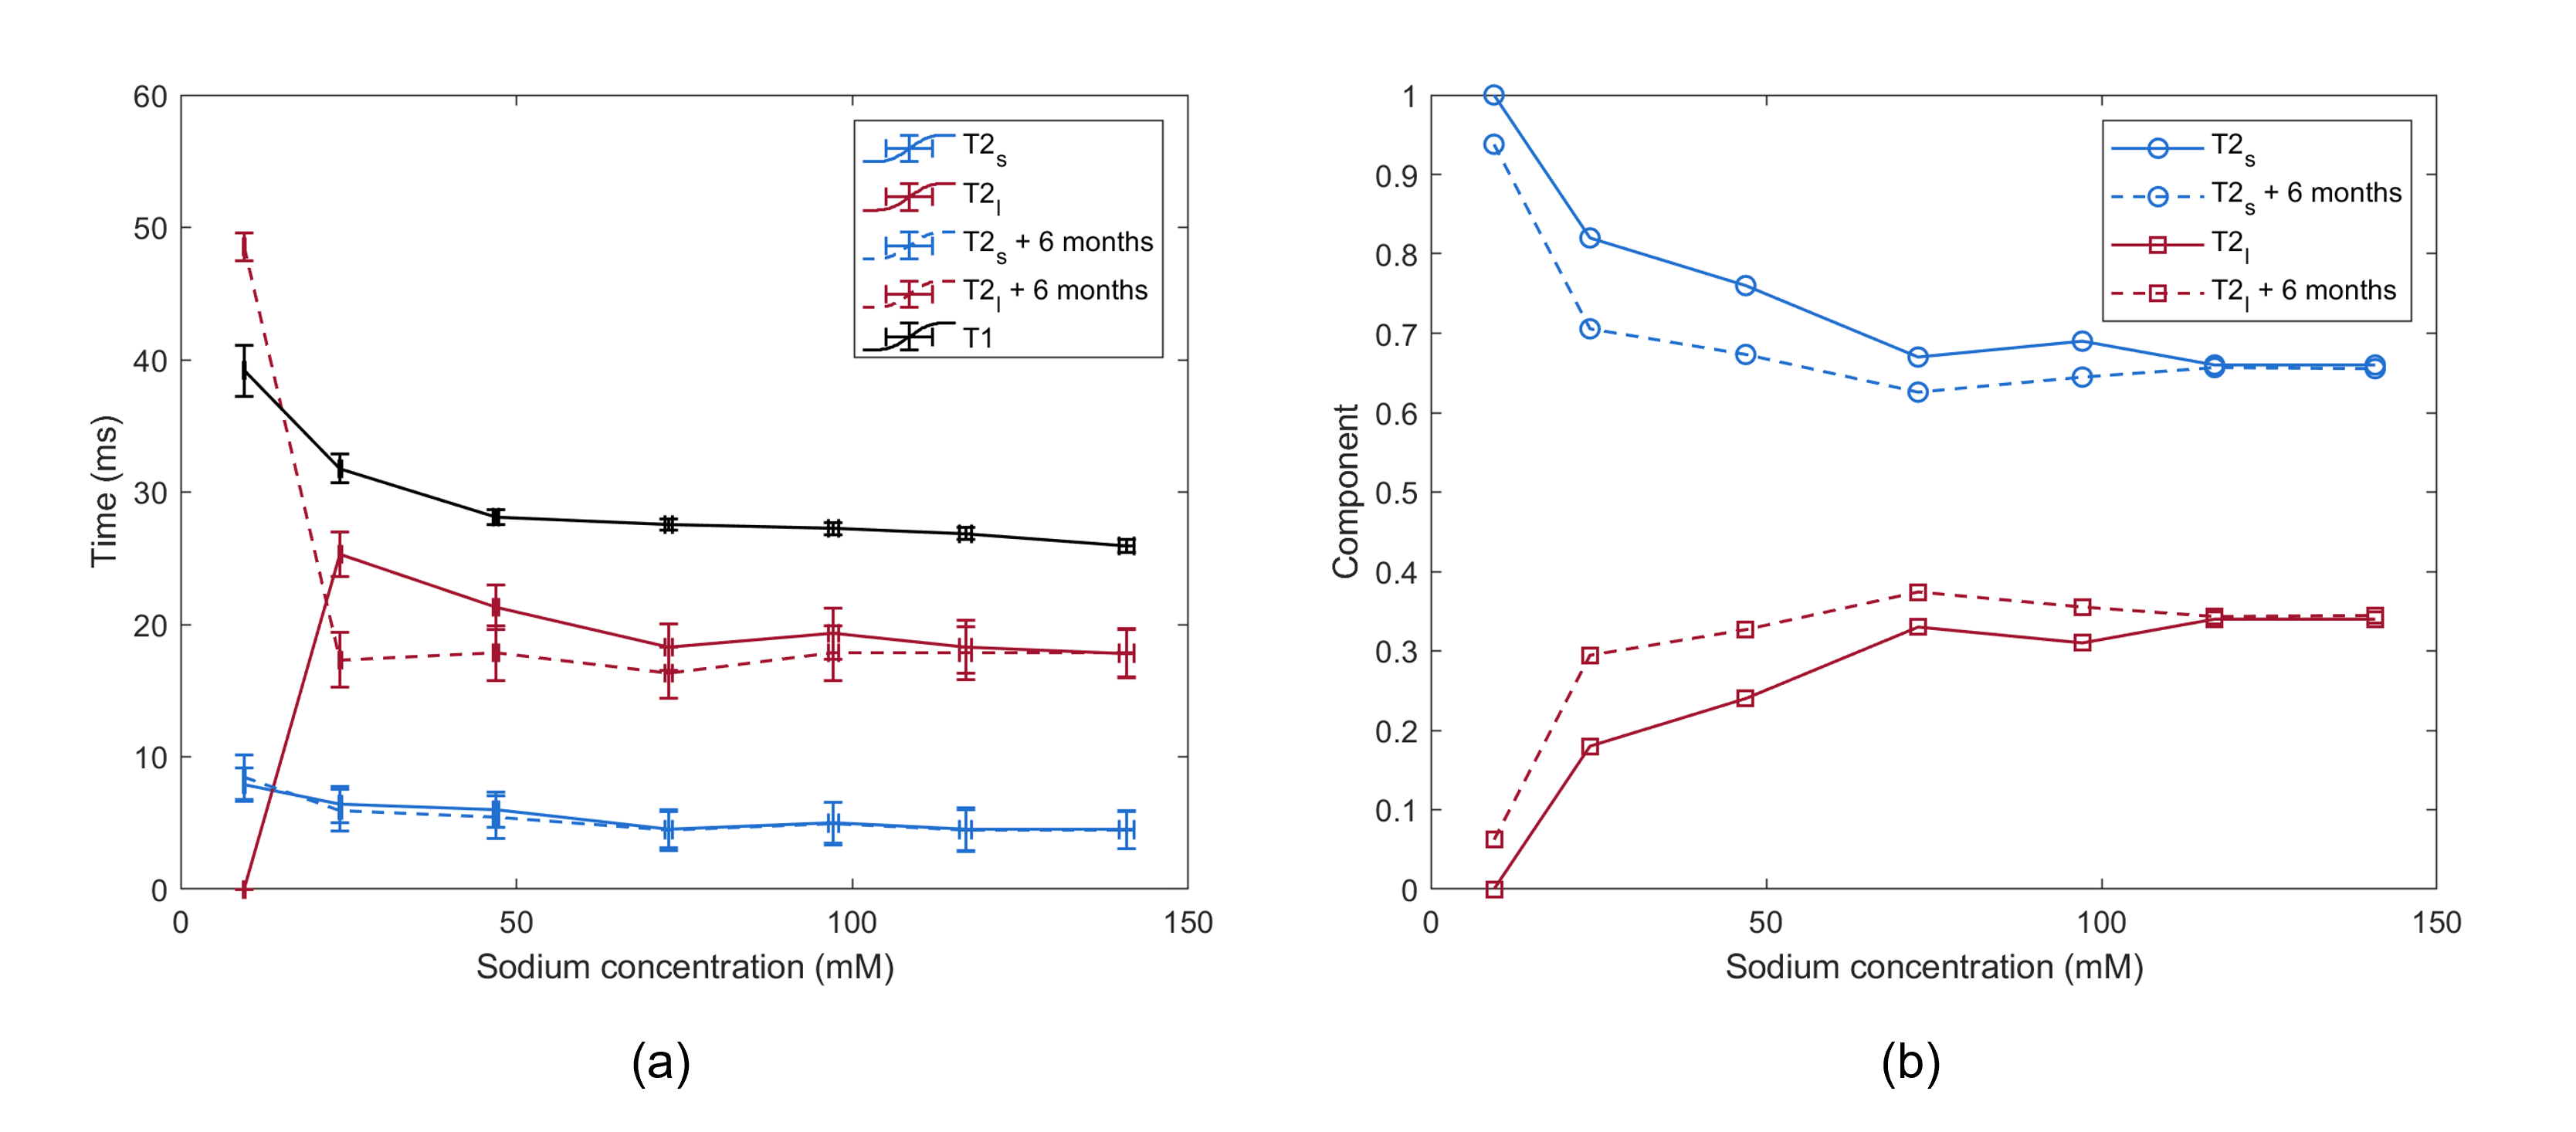
PAG phantoms exhibit bi-exponential 23Na T2 decay, with relaxation parameters ranging from T2s=4-6ms, T2l=17-24ms, T1=27-32ms (see Fig. 3). Fitted FID and IR signals for the 100mM sample are displayed in Fig. 2. T1, T2 values and T2 component ratios of sodium are stable with sodium concentration and time, for concentrations above 25mM. Fig. 4 displays 1H and 23Na-MRI images of 4 PAG vials and a saline vial. The PAG calibration curve shows a linear relationship across mean intensities, passing through the saline control.Discussion
Results show PAG phantoms fulfil the desired characteristics of 23Na-MRI calibration phantoms:(a) 23Na relaxation parameters in PAG agree well with those reported in-vivo (0.5-4ms for T2s, 15-30ms for T2l and 20-30ms for T14,13).
(b) PAG phantoms are structurally homogeneous and suitable for calibration, as shown by 23Na and 1H images and their intensities in Fig. 4.
(c) Following standardised methodology, PAG phantoms are producible to an accurate, consistent standard. The preparation of PAG was traceable from beginning to end, permitting error propagation of the actual sodium concentrations, for metrology (Fig. 1).
(d) Longitudinal T2 values indicate no significant changes over 6 months in samples above 25mM. Whilst PAG can degrade by depolymerisation if exposed to certain conditions14, this is unlikely to occur in an MR environment.
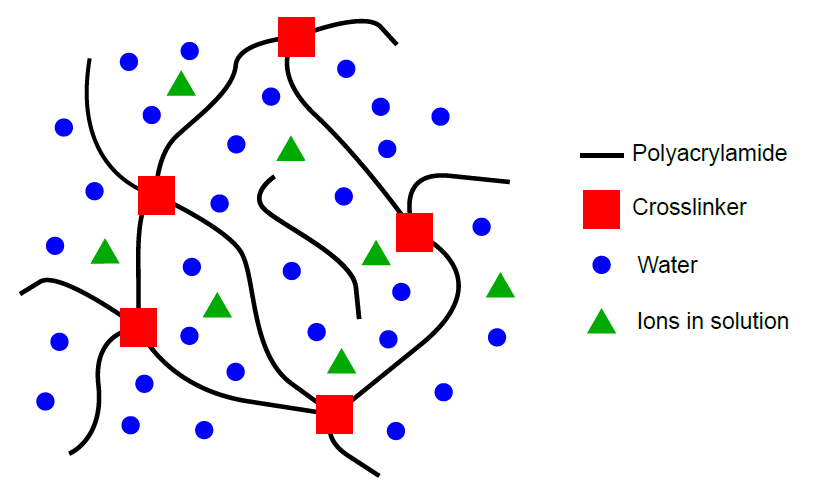
The molecular structure of PAG15 (illustrated in Fig. 5) makes it particularly suitable as a 23Na-MRI calibration phantom, as it emulates the irregular molecular environments found in-vivo. Initial experiments (not presented) indicated that 23Na T2 may be controlled by varying acrylamide and crosslinker concentrations, but further investigation is needed.
It must be noted that relaxation parameters (Fig. 3) deviate at lower concentrations (10mM-25mM). This could be a systematic error, with possible sources including low SNR, or inconsistent shimming, due to NiCl2 affecting the 1H signal. Alternatively, it may indicate a relationship between relaxation parameters and sodium concentration, as also demonstrated by Woessner in agarose gel16. At low concentrations, the interactions between sodium ions and macromolecules which induce bi-exponential T2 decay, may not occur frequently enough. Lastly, it cannot be ruled out that NiCl2 impacts sodium relaxation.
Conclusion
Novel polyacrylamide gel (PAG) phantoms were tested for their suitability as alternatives to agarose in quantitative 23Na-MRI, by assessing relaxation parameters and imaging. Results show that crosslinked PAG yields the desired characteristics of a 23Na-MRI phantom, achieving stability and traceability, while still exhibiting favourable relaxation properties. Demonstrations and validations in-vivo, and design of a foam sample holder, will finalise development.Acknowledgements
SR is supported by the EPSRC-funded UCL Centre for Doctoral Training in Intelligent, Integrated Imaging in Healthcare (i4health) (EP/S021930/1) and the Department of Health’s NIHR-funded Biomedical Research Centre at University College London Hospitals. CGWK receives funding from the UK MS Society (#77), Wings for Life (#169111), Horizon2020 (CDS-QUAMRI, #634541), BRC (#BRC704/CAP/CGW). BS has received funding from Wings for Life.
The UK MS Society and the UCL-UCLH Biomedical Research Centre for ongoing support.
References
- T. D. Pollard, W. C. Earnshaw, J. Lippincott-Schwartz and G. Johnson, Cell Biology, Elsevier LTD, Oxford, 2017.
- K. R. Thulborn, “Quantitative sodium MR imaging: A review of its evolving role in medicine,” NeuroImage, vol. 168, pp. 250-268, 2018.
- W. D. Rooney and C. S. Springer, “A comprehensive approach to the analysis and interpretation of the resonances of spins 3/2 from living systems,” NMR in Biomedicine, vol. 4, p. 209–226, October 1991.
- F. Riemer, B. S. Solanky, C. A. M. Wheeler-Kingshott and X. Golay, “Bi-exponential 23Na T2 component analysis in the human brain,” NMR in Biomedicine, vol. 31, p. e3899, February 2018.
- B. Ridley, A. M. Nagel, M. Bydder, A. Maarouf, J.-P. Stellmann, S. Gherib, J. Verneuil, P. Viout, M. Guye, J.-P. Ranjeva and W. Zaaraoui, “Distribution of brain sodium long and short relaxation times and concentrations: a multi-echo ultra-high field 23Na MRI study,” Scientific Reports, vol. 8, March 2018.
- R. Ouwerkerk, “Sodium MRI,” in Methods in Molecular Biology, Humana Press, 2010, p. 175–201.
- A. Hellerbach, V. Schuster, A. Jansen and J. Sommer, “MRI Phantoms – Are There Alternatives to Agar?,” PLoS ONE, vol. 8, p. e70343, August 2013.
- P. T. Gurney, B. A. Hargreaves and D. G. Nishimura, “Design and analysis of a practical 3D cones trajectory,” Magnetic Resonance in Medicine, vol. 55, pp. 575-582, 2006.
- F. Riemer, B. S. Solanky, C. Stehning, M. Clemence, C. A. M. Wheeler-Kingshott and X. Golay, “Sodium (23Na) ultra-short echo time imaging in the human brain using a 3D-Cones trajectory,” Magnetic Resonance Materials in Physics, Biology and Medicine, vol. 27, p. 35–46, 01 February 2014.
- I.-G. Marino, “Regularized Inverse Laplace Transform,” MATLAB Central File Exchange, 2021.
- S. W. Provencher, “CONTIN: A general purpose constrained regularization program for inverting noisy linear algebraic and integral equations,” Computer Physics Communications, vol. 27, p. 229–242, September 1982.
- P. A. Yushkevich, J. Piven, H. C. Hazlett, R. G. Smith, S. Ho, J. C. Gee and G. Gerig, “User-guided 3D active contour segmentation of anatomical structures: Significantly improved efficiency and reliability,” vol. 31, p. 1116–1128, July 2006.
- G. Madelin, J.-S. Lee, R. R. Regatte and A. Jerschow, “Sodium MRI: Methods and applications,” Progress in Nuclear Magnetic Resonance Spectroscopy, vol. 79, pp. 14-47, 2014.
- M. J. Caulfield, G. G. Qiao and D. H. Solomon, “Some Aspects of the Properties and Degradation of Polyacrylamides,” vol. 102, p. 3067–3084, July 2002.
- C. Yang, T. Yin and Z. Suo, “Polyacrylamide hydrogels. I. Network imperfection,” vol. 131, p. 43–55, October 2019.
- D. E. Woessner, “NMR relaxation of spin-3/2 nuclei: Effects of structure, order, and dynamics in aqueous heterogeneous systems,” Concepts in Magnetic Resonance, vol. 13, p. 294–325, 2001.
Figures