1280
Assessing the repeatability of tissue sodium concentration and characterizing the bi-exponential T2* decay signal in the calf1Sir Peter Mansfield Imaging Centre, University of Nottingham, Nottingham, United Kingdom
Synopsis
The repeatability of sodium (23Na) MRI measures must be understood to allow for its application in clinical studies of patient groups or response to therapy. A series of 23Na scans were performed on the calf of healthy subjects, this included a 3D GRE 23Na scan and phase sensitive B1 mapping to measure tissue sodium concentration (TSC). Subjects were scanned twice for assessment of repeatability of measures. A multi echo UTE scan was used to measure the T2* decay. TSC was shown to have a coefficient of variation of 16±4 % between visits and the bi-exponential decay curve was characterized.
Introduction
In the body sodium is thought to be stored in three main compartments - extracellular space, the skeletal pool, and a recently established skin and muscle tissue component1. Sodium (23Na) MRI of tissue has the potential for in vivo spatial quantification of tissue sodium concentration for clinical use in Diabetes Mellitus2,3, hypertension4,5, and in kidney disease such as in Chronic Kidney Disease6 and haemodialysis patients7, and to study the response to therapeutic strategies. Here we implement an optimised 23Na MRI protocol to determine tissue sodium concentration and the associated bi-exponential transverse T2* relaxation time in muscle of the calf. We assess the repeatability of measuring sodium (23Na) concentration for application in future clinical studies.Methods
Scanning was performed on a 3T Philips Ingenia scanner using a 23Na birdcage leg coil (PulseTeq Ltd) and the scanner’s Q-body coil to collect 1H measures. The protocol comprised 1H mDixon (0.4x0.4x8 mm3, TE: 20ms, FA: 90o, TR: 500ms, 15 slices, TA: 4 mins) for localisation and tissue segmentation, volume and fat/water fraction. A 3D GRE 23Na scan (5x5x30mm3, 10 slices, TE/TE: 1.26/100ms, FA: 90o, NSA: 16, TA: 8min) for 23Na quantification. Phase sensitive B1 mapping (5x5x30mm3, 7 slices, TE/TR: 2.1/210ms, FA: 60o, NSA: 12, TA: 7.8mins) to correct B1 inhomogeneities along the leg coil. A 1H dual echo B0 map was also acquired. A series of multi-echo UTE scans (5x5x30mm3, TE1: 0.18ms, ΔTE = 1.5ms, FA: 90o, TR: 100ms, TA: 15.3mins) were collected to measure the 23Na signal bi-exponential T2* decay.The protocol was collected on five healthy subjects (4M:1F, 23-48 yrs) who were scanned twice within a 2 week period to assess repeatability of measures. To quantify tissue sodium concentration (TSC) maps, 23Na GRE images were first corrected using the B1 maps. Reference bottles of known 23Na concentration (20, 30, 40 and 50 mmol/L NaCl) positioned within the leg coil were used in a linear regression to estimate TSC. The biexponential T2* decay in the skin/muscle was measured by performing a biexponential fit to produce a slow and fast decay constant.
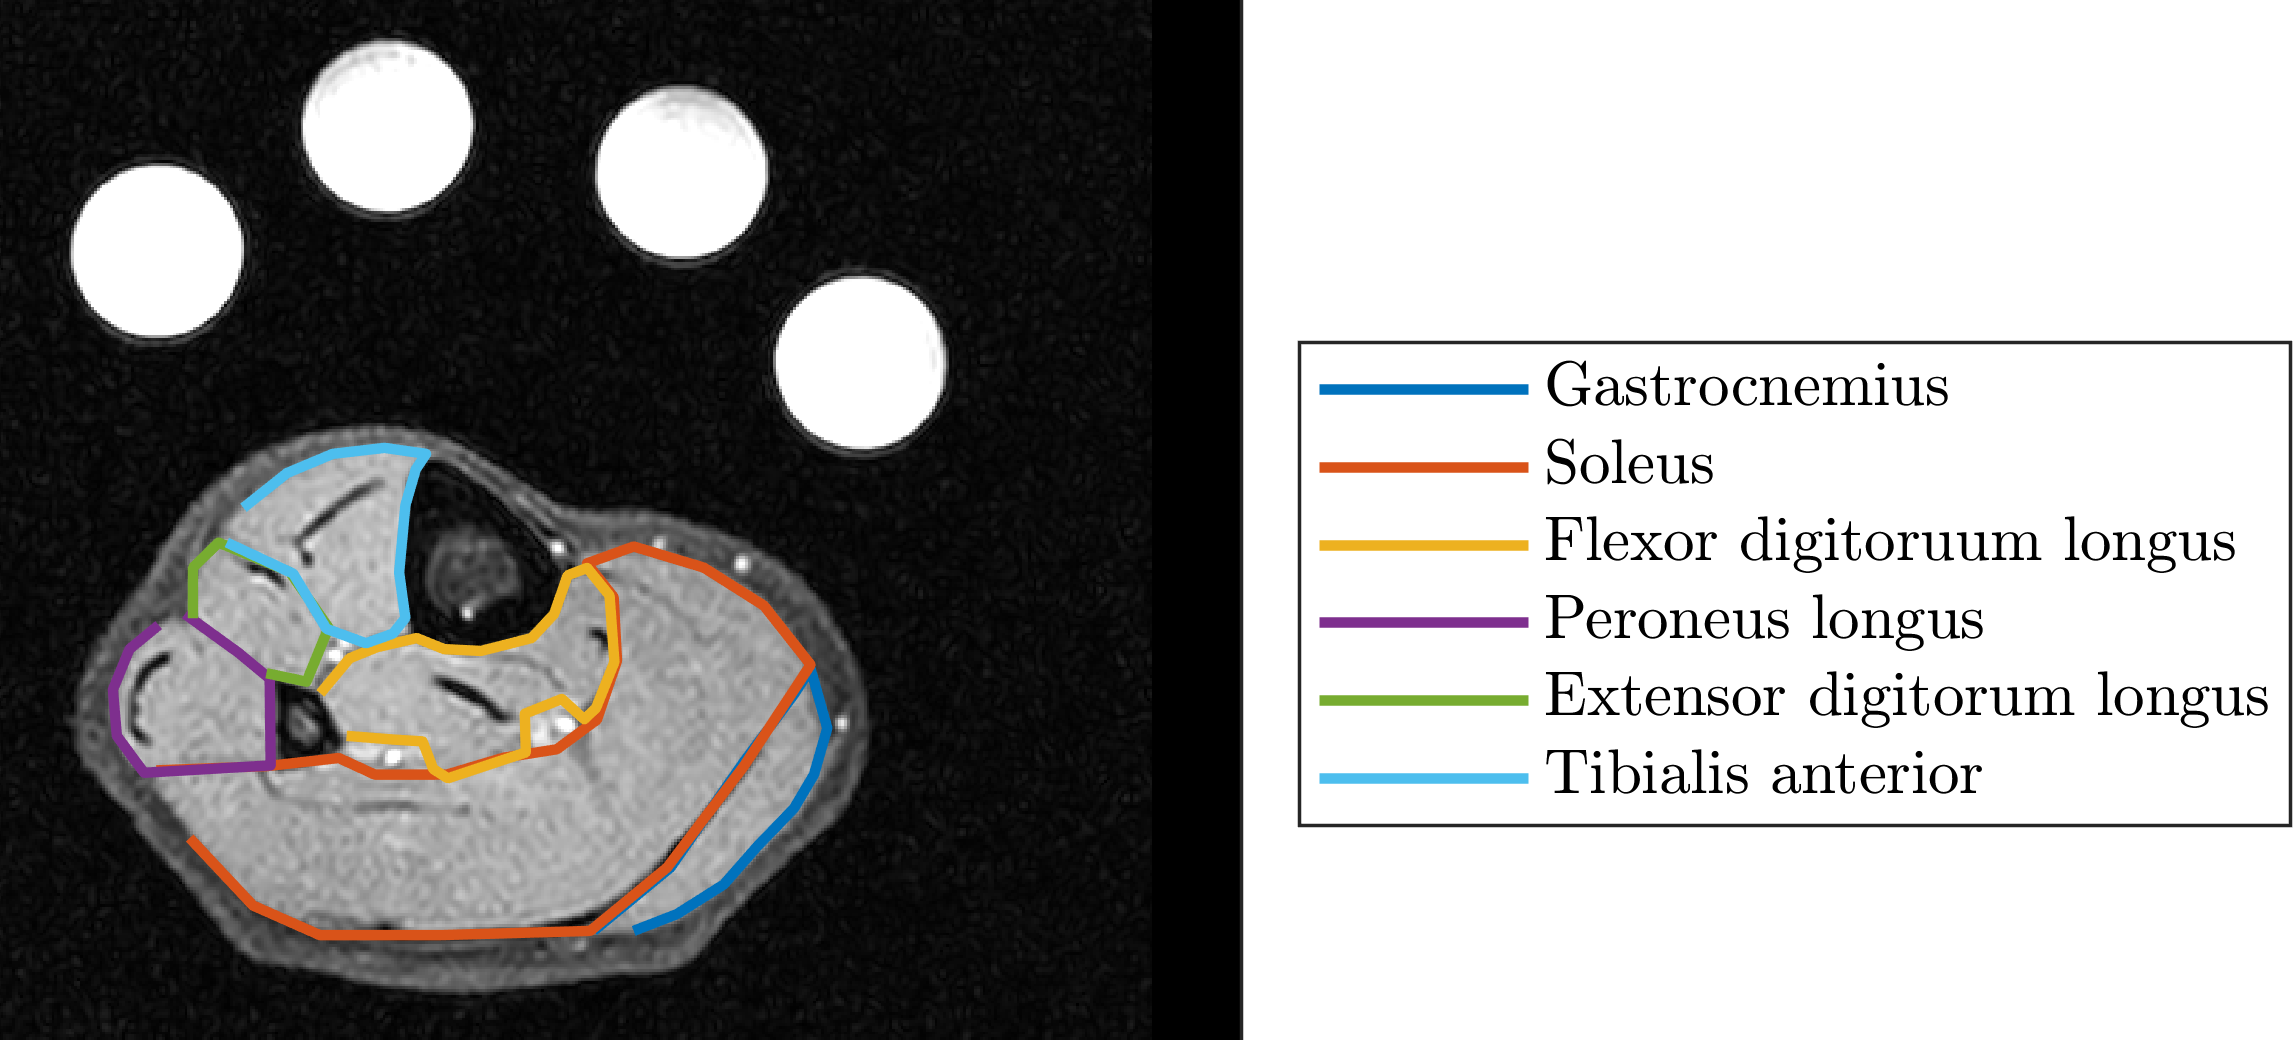
Muscle and skin ROIs were drawn on the 1H mDixon images, these ROIs were then applied to the TSC and relaxometry maps, and histogram analysis of measures performed. Measures were compared between each subject, and repeatability assessed using coefficient of variance.
Results
Figure 1 shows the measured tissue 23Na concentration in the calf of five healthy subjects for two visits, along with the R2 correlation of fit of the reference bottles. The corresponding 23Na concentration histograms are shown in Figure 2 and show good agreement in all but Subject 2 for whom R2 values of the reference bottles varies between Visit 1 and 2. The intra-subject CoV was 16±7% for the mode and 19±15% for the FWHM. Figure 3 shows an example 23Na T2* map from the bi-exponential fitting, and Figure 4 tabulates the fast fraction, fast component and slow component measured in the calf muscle for four healthy subjects, with mean slow (T2s) and fast (T2f) component times of 18±1ms and 2.1±0.1ms.Discussion
There is good agreement in the TSC in the calf between the two visits, with mean of 21±4mmol/L and CoV of 16±4%. Despite using phase sensitive B1 mapping, further improvement is needed in the B1 correction as demonstrated by the variance in TSC in the individual reference bottles and indicated by the variance in the R2 of the reference bottles from 0.85 – 0.99. The TSC maps shown in Figure 1 depict the central slice only, and the positioning of the leg in the coil differed between some visits, as seen for Subject 1 and 3. However, scans were collected across multiple axial slices along the coil's length to enable measurement throughout the calf, achievable with a good B1 homogeneity of this coil, and so in future the slices can be realigned to match between visits.The multi-echo echo sequence provided echo times to sample the T2* decay well and yield a good fit in all subjects (R2 = 0.996). In a homogeneous environment the fraction of T2f and T2s is 60:40 but by fitting the T2* curves this allowed for deviations from this ratio. The fitted value of the fast fraction 0.57±0.04 agrees well with literature8,9. The variance in the measured fractions reflects the in-homogeneous environment in the tissue. Knowing the transverse relaxation time in both the muscle and reference bottles, will allow in future the 23Na signal at a given TE to be corrected for T2* decay10.
In future, work will be carried out to compare 3D GRE and UTE techniques, to capture the very rapid decay of the 23Na signal. Additionally, all data will be segmented into muscle groups in the calf from the 1H mDixon scans (Figure 5) to assess differential sodium distribution.
Conclusion
We measured TSC and T2* in the calf muscle and shown that the TSC is repeatable. In future these methods will be performed in haemodialysis patients before and after treatment to aid the monitoring of hemodynamic stability and dialysis tolerance to improve patient outcomes.Acknowledgements
We acknowledge support from Fresenius Medical Care.References
[1] B. Canaud et al., “Sodium and water handling during hemodialysis: new pathophysiologic insights and management approaches for improving outcomes in end-stage kidney disease,” Kidney Int., vol. 95, no. 2, pp. 296–309, Feb. 2019.
[2] G. Chang, L. Wang, M. E. Schweitzer, and R. R. Regatte, “3D 23Na MRI of human skeletal muscle at 7 tesla: Initial experience,” Eur. Radiol., vol. 20, no. 8, pp. 2039–2046, Aug. 2010. [3]
[3] D. Kannenkeril et al., “Tissue sodium content in patients with type 2 diabetes mellitus,” J. Diabetes Complications, vol. 33, no. 7, pp. 485–489, Jul. 2019.
[4] C. Kopp et al., “23Na magnetic resonance imaging of tissue sodium,” Hypertension, vol. 59, no. 1, pp. 167–172, 2012.
[5] C. Ott et al., “Impact of renal denervation on tissue Na+ content in treatment-resistant hypertension,” Clin. Res. Cardiol., vol. 107, no. 1, pp. 42–48, Jan. 2018.
[6] M. P. Schneider et al., “Skin sodium concentration correlates with left ventricular hypertrophy in CKD,” J. Am. Soc. Nephrol., vol. 28, no. 6, pp. 1867–1876, Feb. 2017.
[7] A. Dahlmann et al., “Magnetic resonance-determined sodium removal from tissue stores in hemodialysis patients.,” Kidney Int., vol. 87, no. 2, pp. 434–41, 2015.
[8] G. Madelin, “Sodium Magnetic Resonance Imaging: Biomedical Applications,” 2012.
[9] D. A. Gerlach et al., “Atrophy of calf muscles by unloading results in an increase of tissue sodium concentration and fat fraction decrease: a 23Na MRI physiology study,” Eur. J. Appl. Physiol., vol. 117, no. 8, pp. 1585–1595, Aug. 2017.
[10] J. Lott et al., “Corrections of myocardial tissue sodium concentration measurements in human cardiac 23Na MRI at 7 Tesla,” Magn. Reson. Med., 2019.
Figures
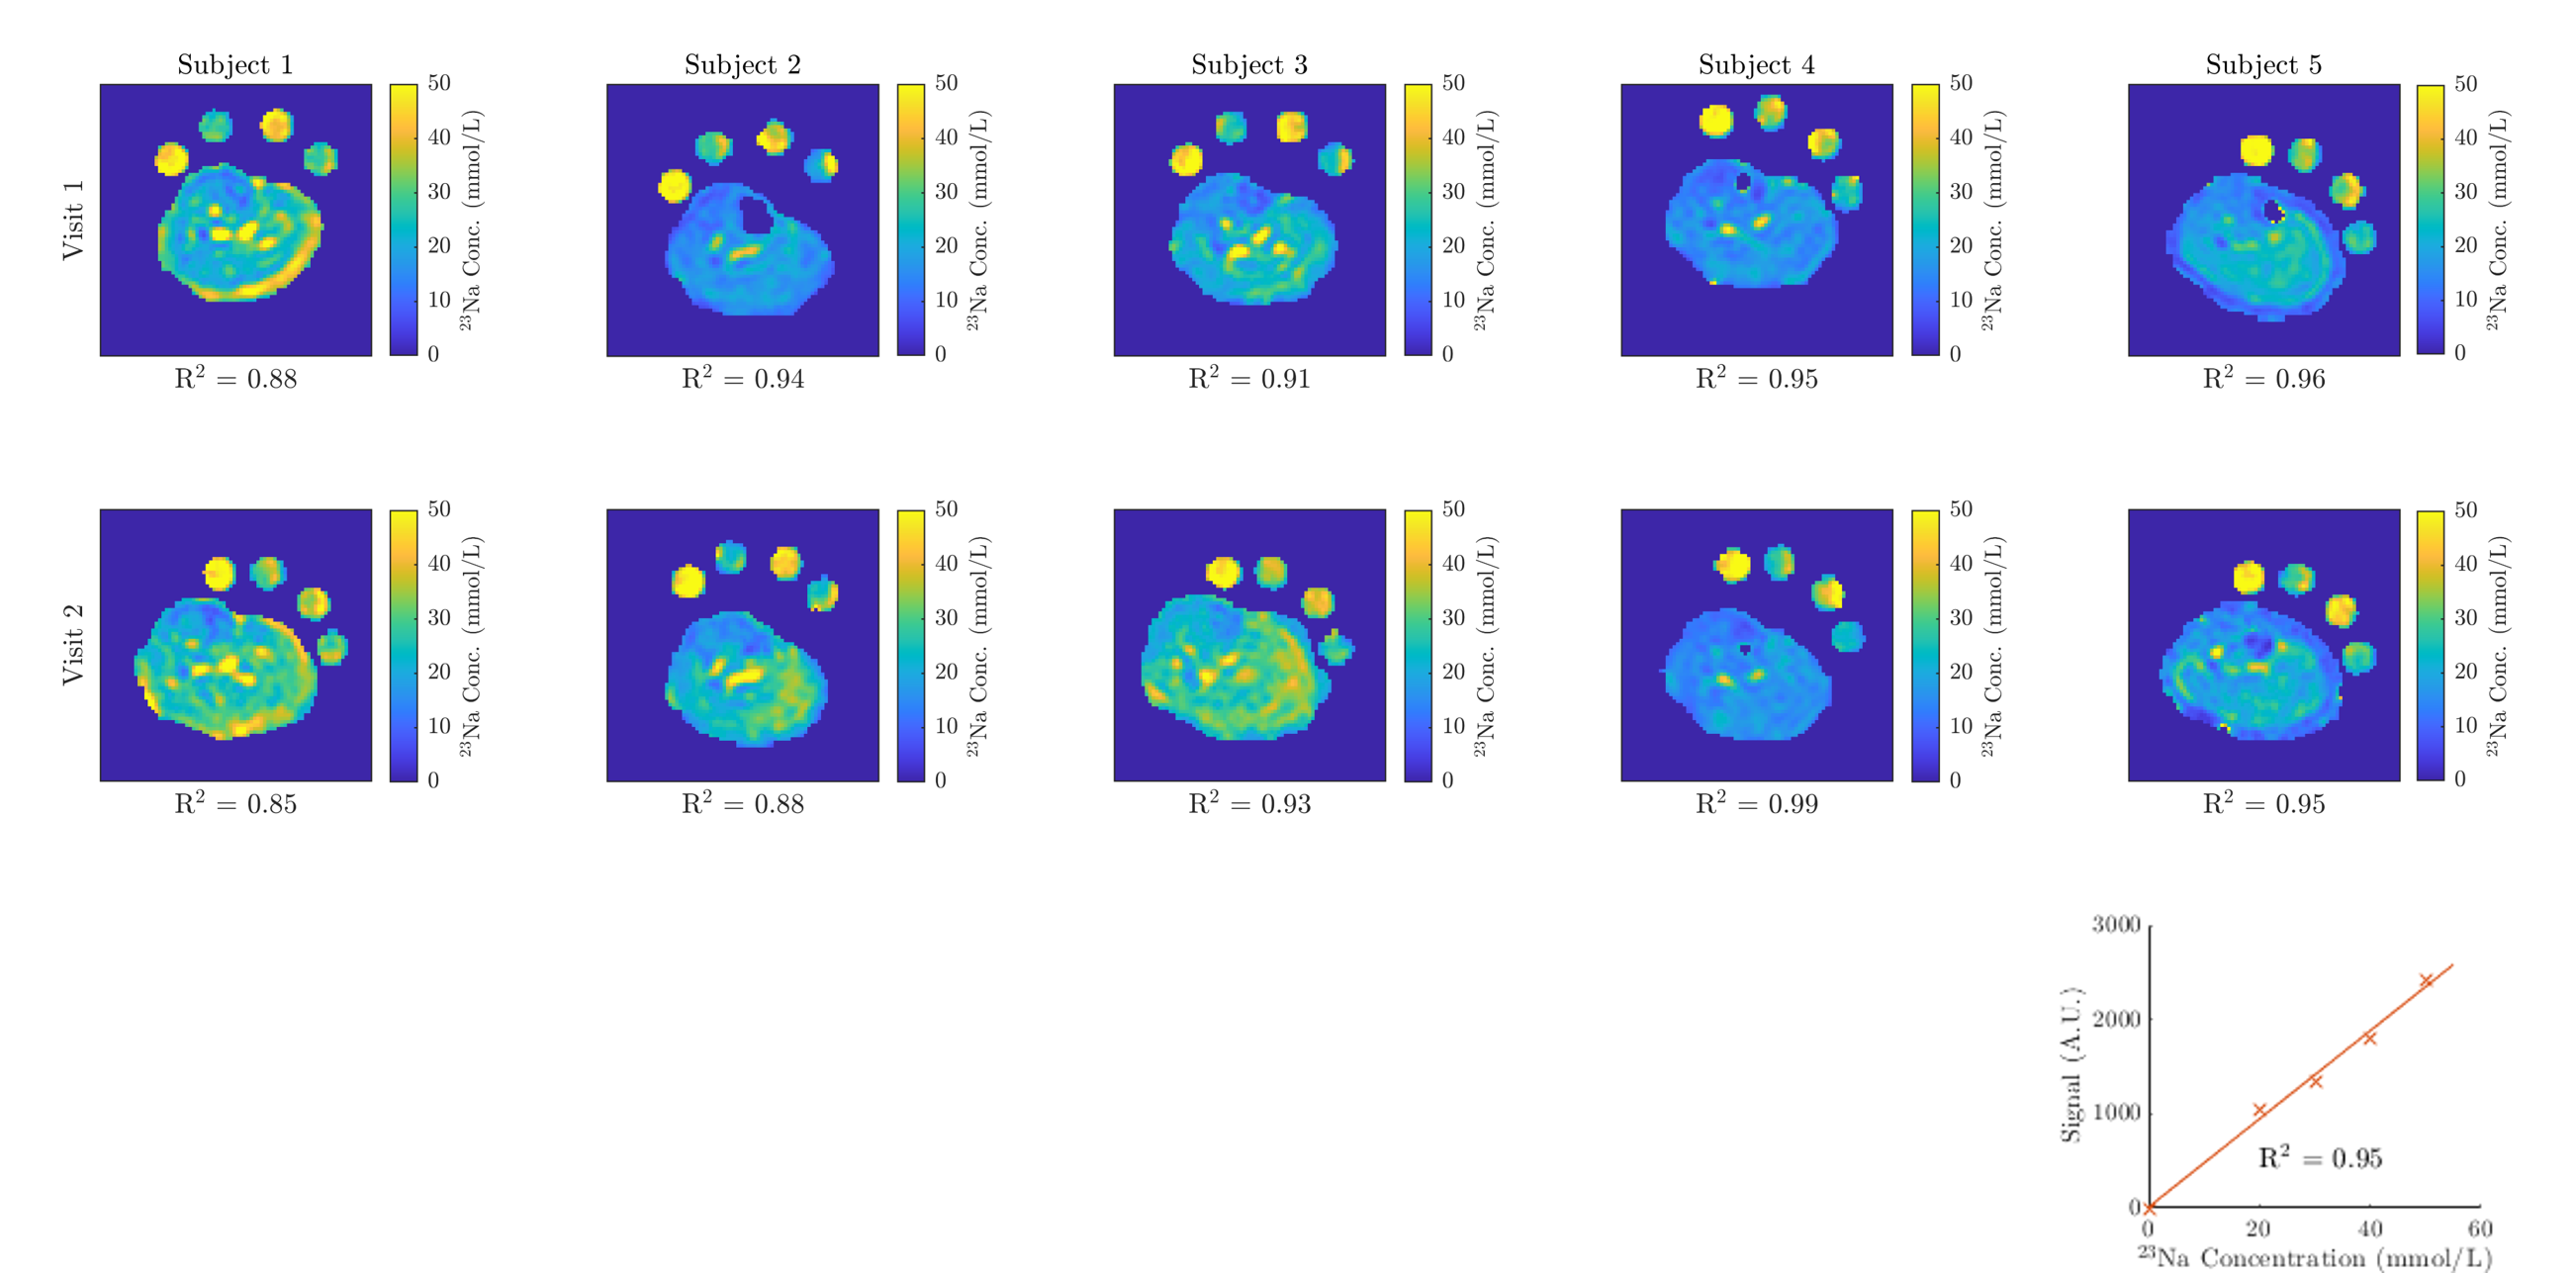
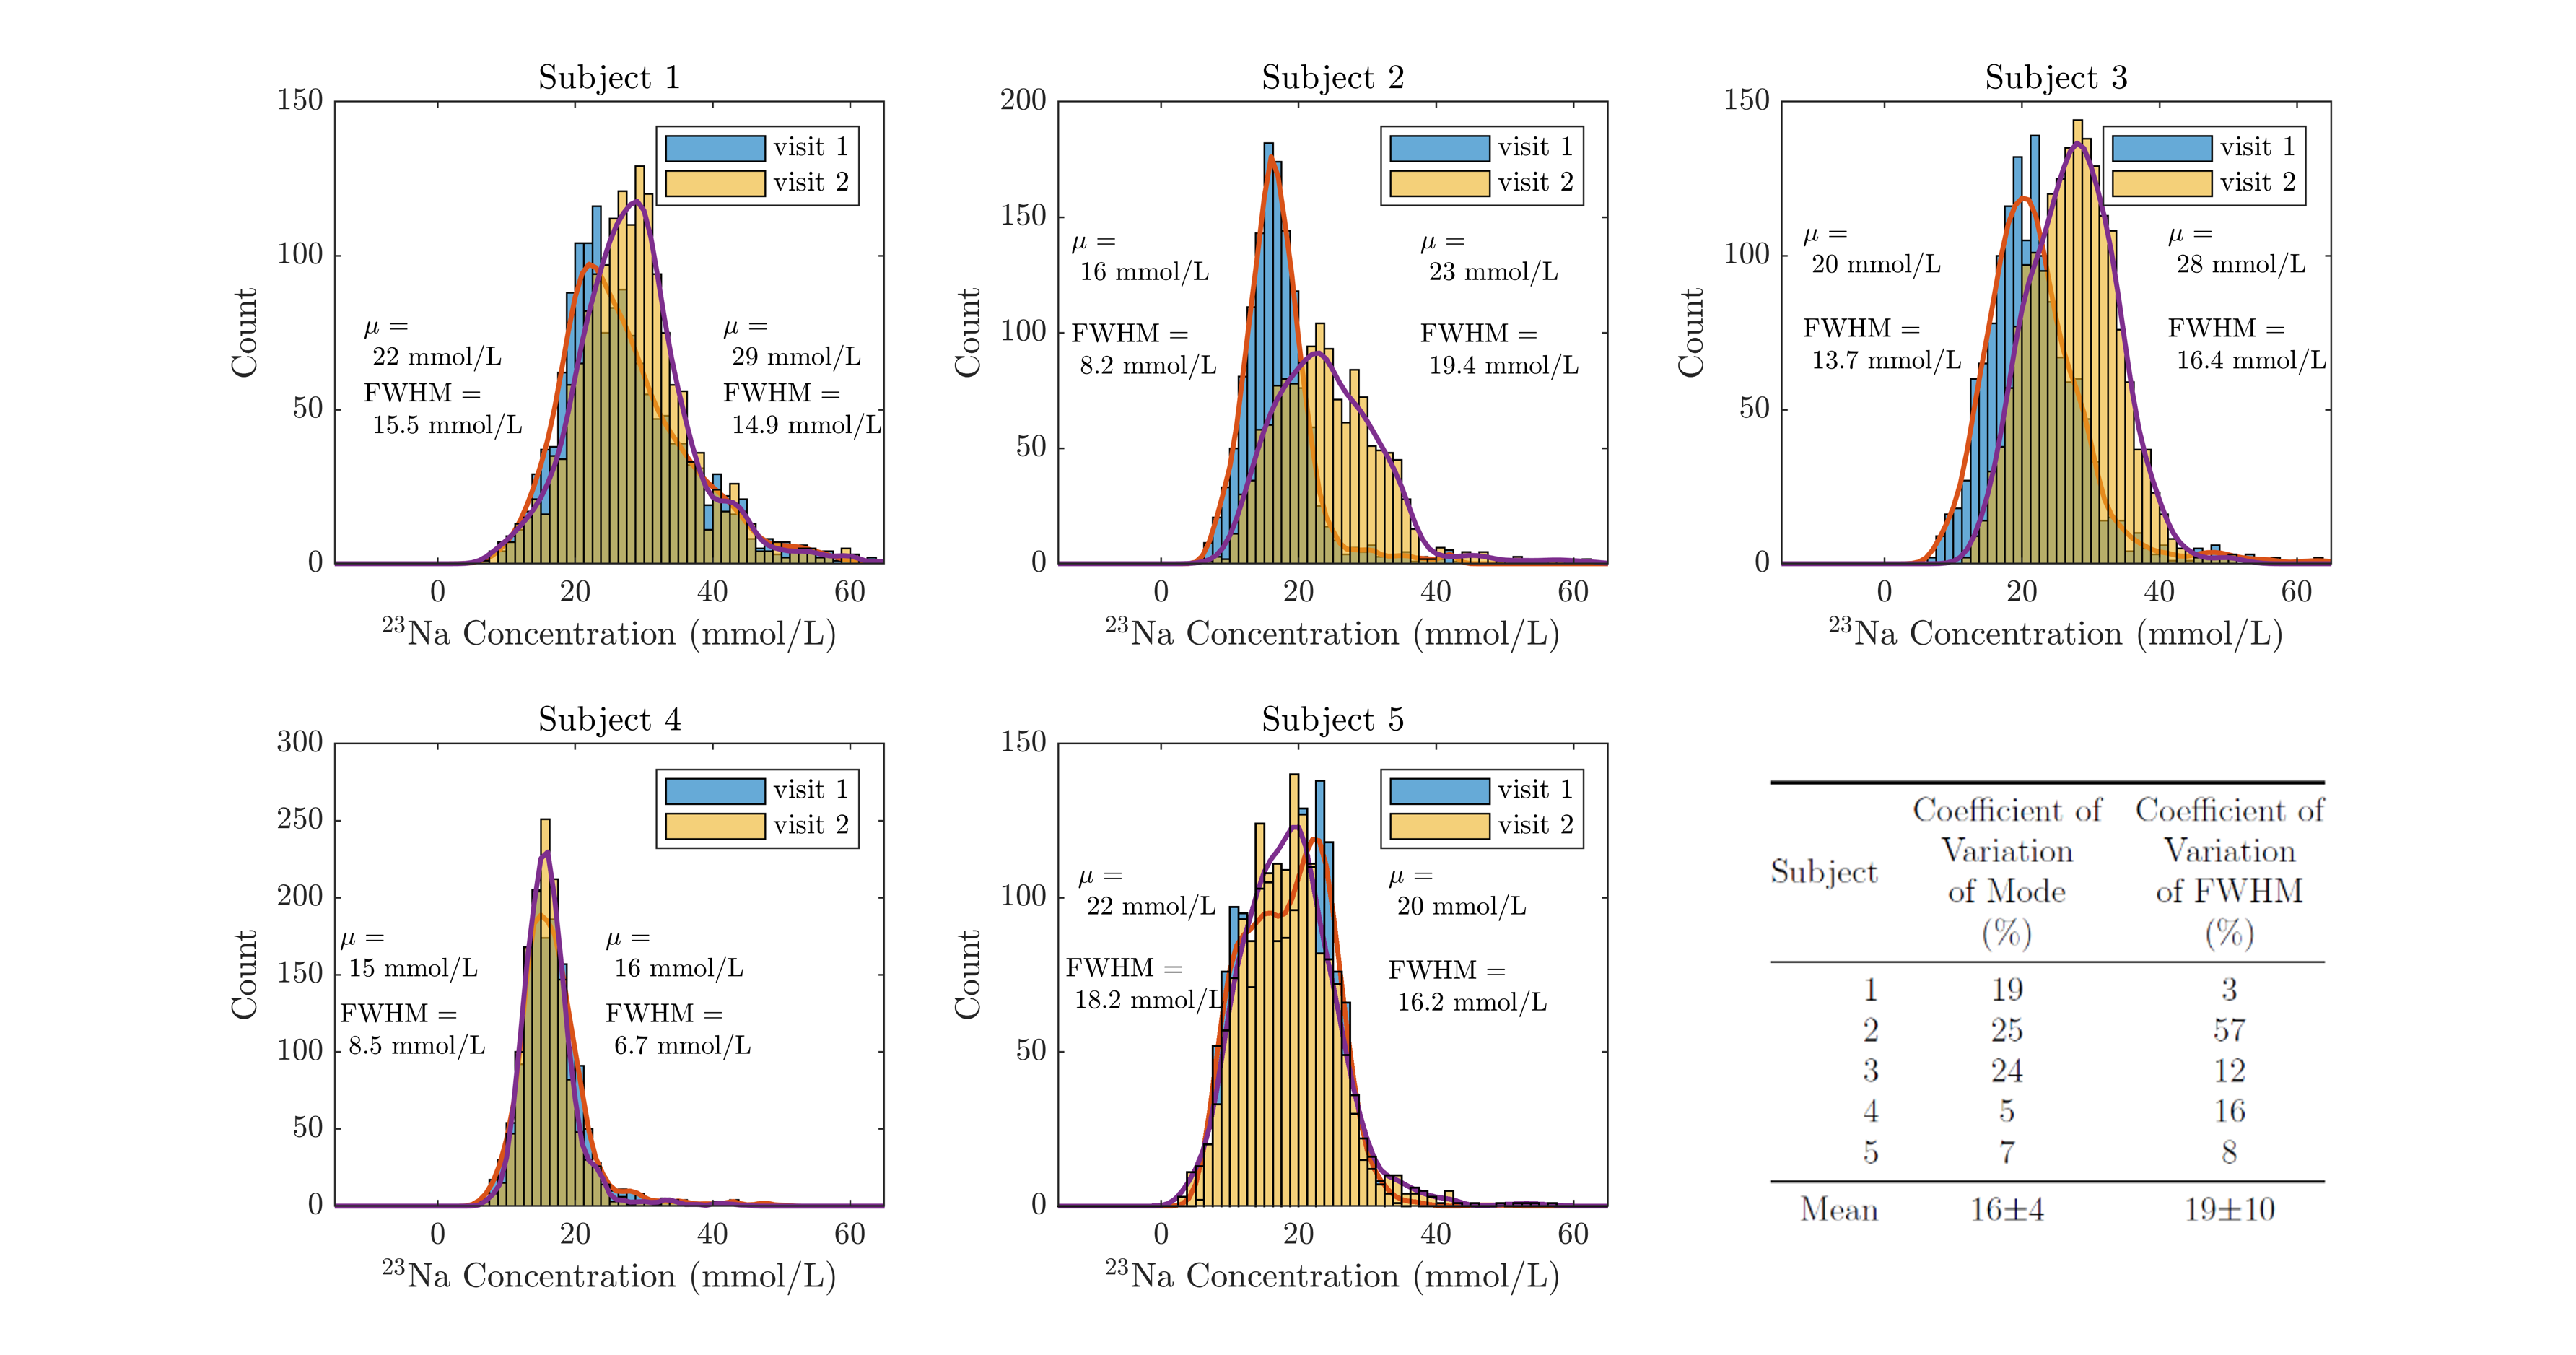
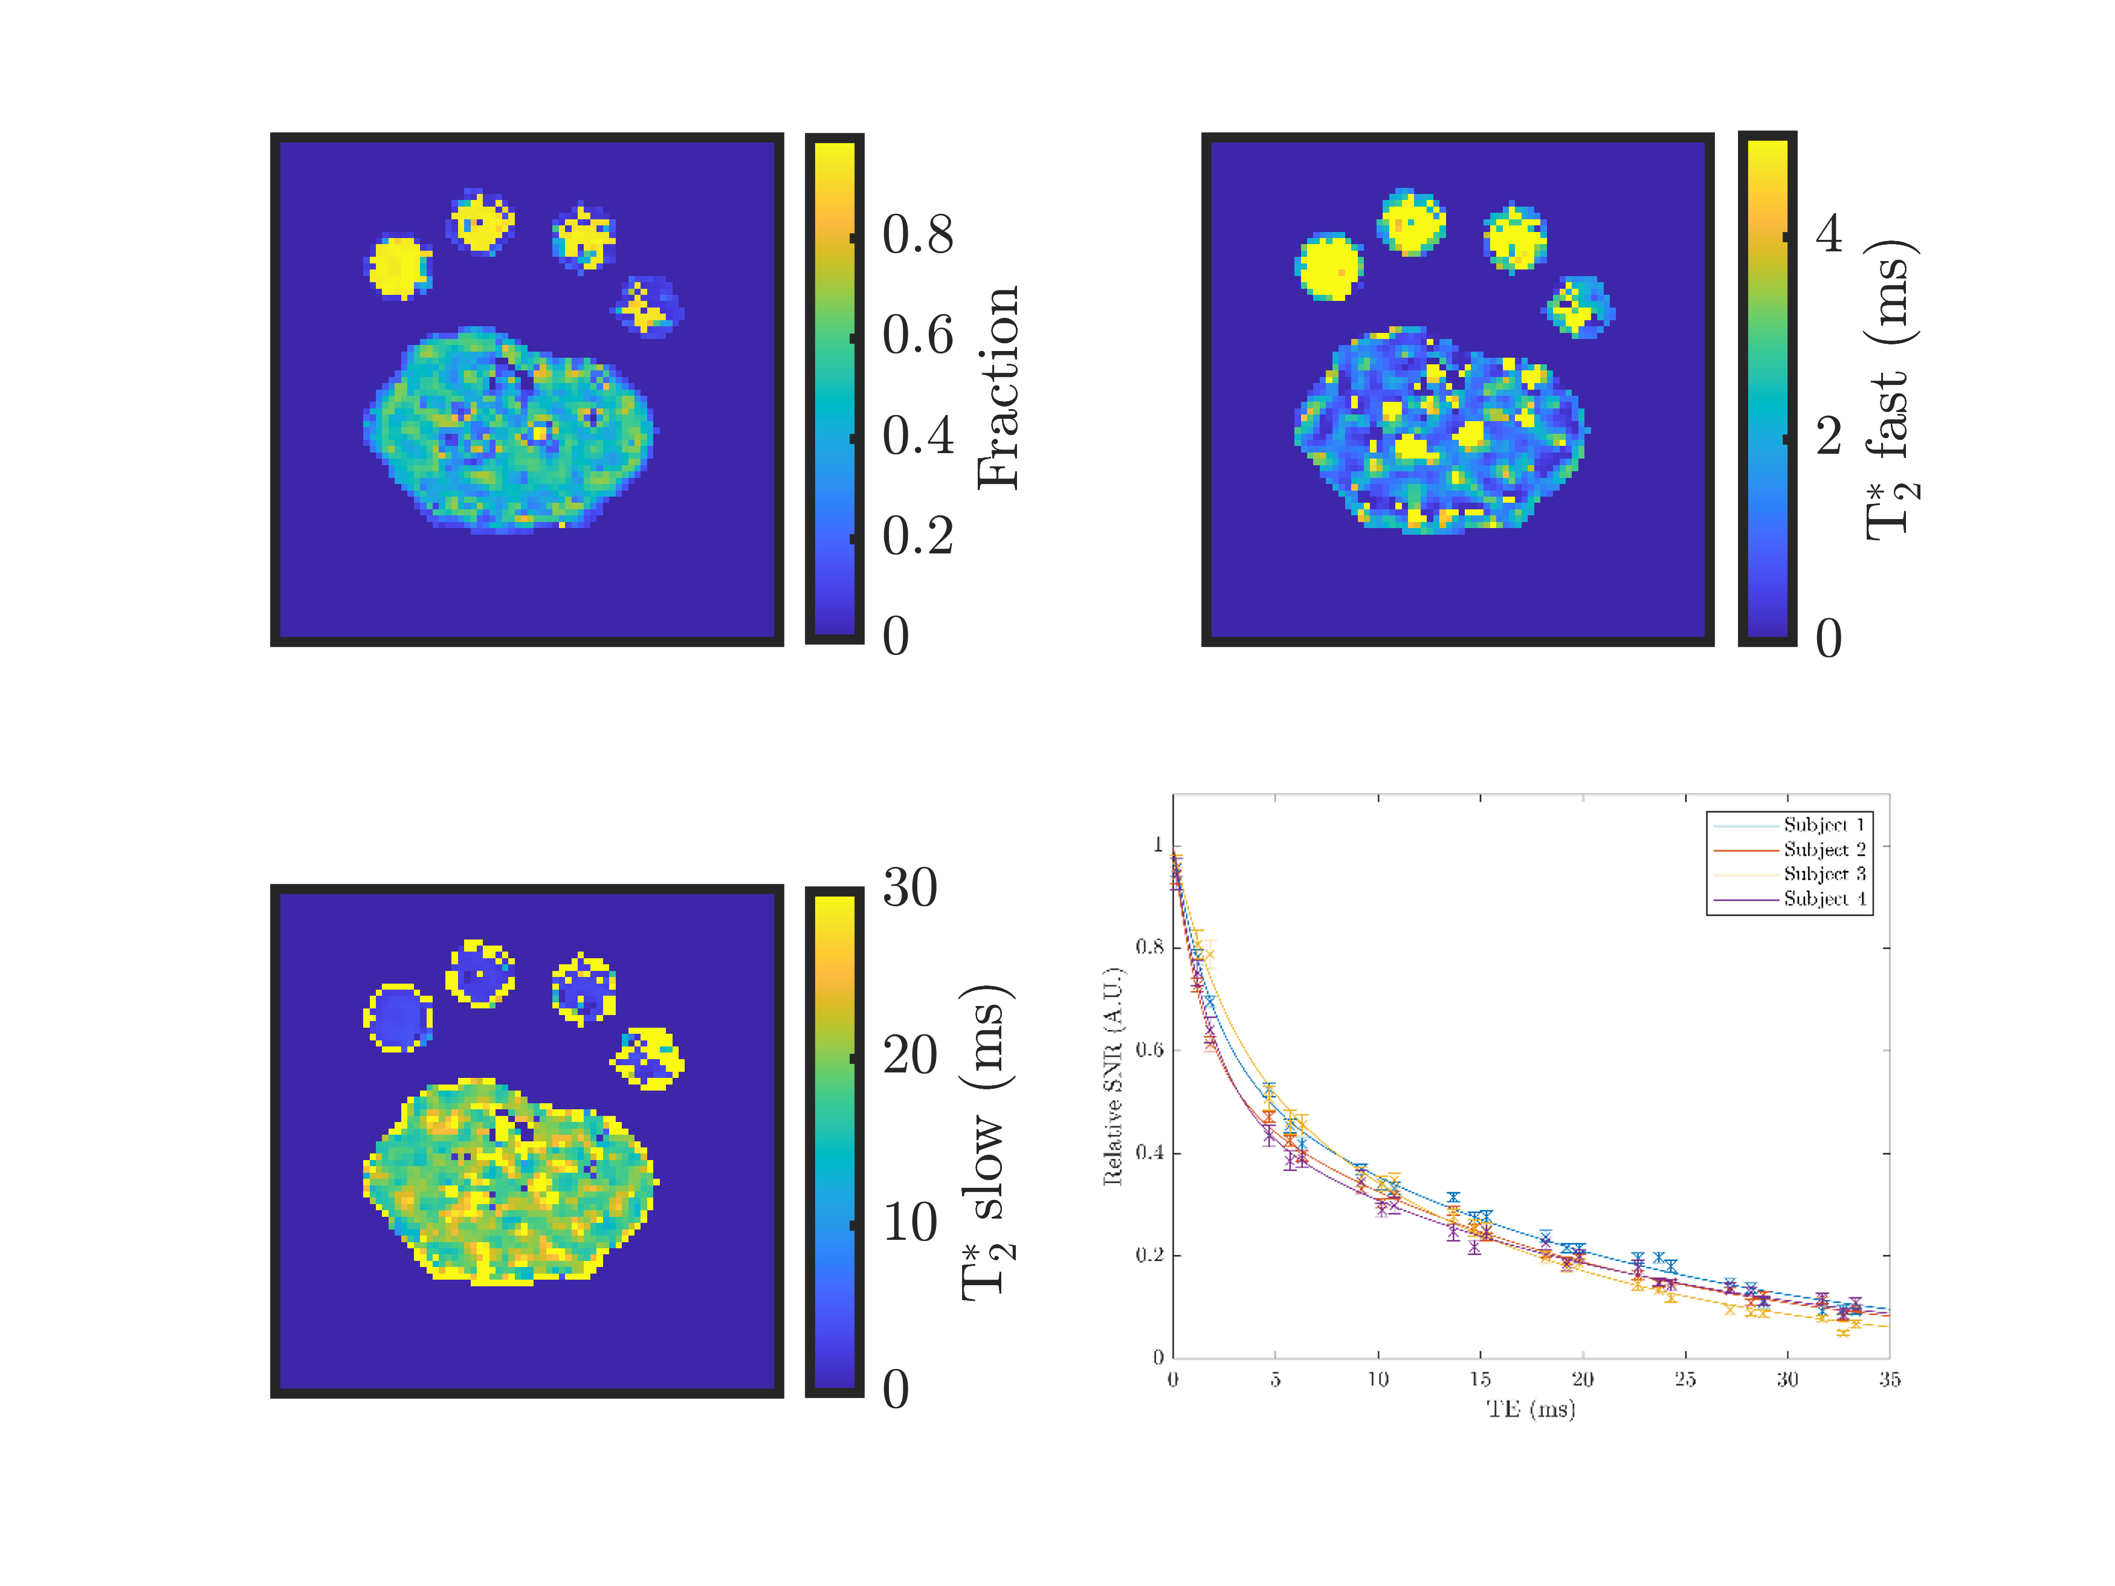
Figure 3: Example T2* maps showing the fast fraction, the fast component, and the slow component of the bi-exponential T2* decay. The decay curve of all four subjects is shown on the bottom right.
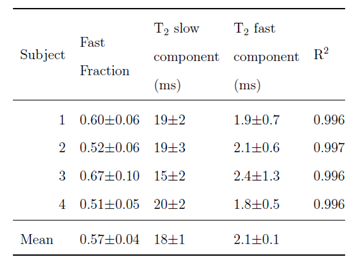
Figure 4: Fitted parameters of the bi-exponential T2* decay of the 23Na signal in the muscle.