1279
Multi-nuclear 1H/23Na Sodium MRI reveals relationship between intermuscular adipose tissue and tissue sodium content1Department of Radiology and Radiological Sciences, Vanderbilt University Medical Center, Nashville, TN, United States, 2Institute of Imaging Science, Vanderbilt University Medical Center, Nashville, TN, United States, 3Department of Medicine, Vanderbilt University Medical Center, Nashville, TN, United States, 4U.S. Department of Veterans Affairs, Tennessee Valley Healthcare System, Nashville, TN, United States, 5Biomedical Engineering, Vanderbilt University Medical Center, Nashville, TN, United States
Synopsis
Adipose tissue depositions between muscle compartments, known as intermuscular adipose tissue (IMAT), occurs in various conditions such as with obesity and aging. Tissue sodium content (TSC) measured by sodium magnetic resonance imaging increases with aging and may be associated with insulin resistance. In this study, we found a correlation between IMAT volume percentage and muscle TSC (r=0.52, p=0.01). Additionally, mean TSC in the IMAT region was higher than mean TSC in total muscle (p<0.001). The relationship between tissue sodium content and IMAT opens avenues for understanding the mechanisms of sodium storage and fat depositions in tissue compartments of the leg.
Introduction
Ectopic depots of adipose tissue in the muscle compartment, known as intermuscular adipose tissue (IMAT), occurs in various conditions such as with obesity and aging1,2. IMAT is considered similar to visceral adipose tissue and impairs muscle function and contraction, and it is associated with insulin resistance3. Peripheral tissue sodium content (TSC) measured by sodium magnetic resonance imaging (23Na MRI) also increases with aging and may be associated with insulin resistance4–6. It is currently unknown how IMAT compares to other types of adipose tissue, such as subcutaneous adipose tissue (SAT), in regard to sodium content7. In this study, we used 23Na MRI to measure TSC in lower extremity skin and muscle, as well as in adipose tissue regions SAT and IMAT. Dixon fat-water 1H MRI was used to identify regions of interest in healthy controls. Our hypotheses are that i.) IMAT volume is associated with sodium content in muscle, and ii.) TSC is higher in IMAT that in SAT regions, reflecting a potential pathologic profile of IMAT and co-local sodium deposition.Methods
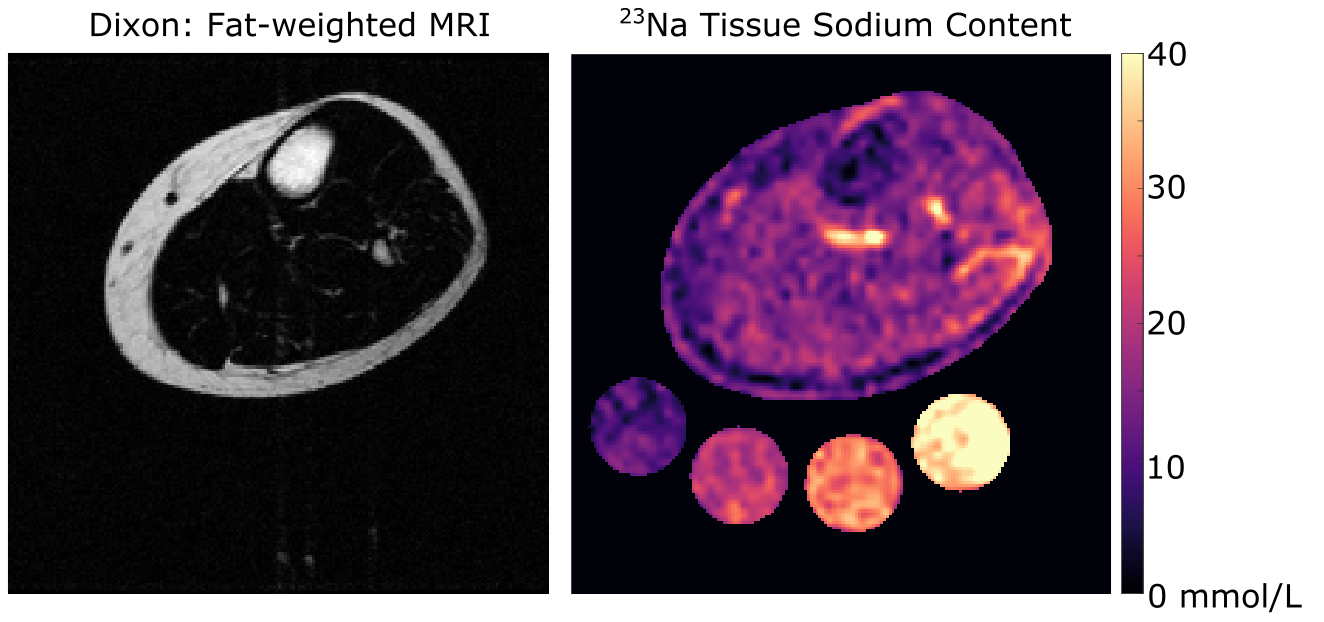
Subjects: Adult healthy volunteers (n=24) provided informed, written consent. Participants underwent screening to determine eligibility based on physical examination and medical history. Exclusion criteria included MRI contraindications.Data acquisition & processing: Non-invasive 1H/23Na MRI was performed on a 3.0T Philips Ingenia (Philips Healthcare, Best, The Netherlands) that incorporated the capability for multi-nuclear imaging. The participant’s calf was placed in a quadrature, single-tuned 23Na knee coil (Rapid Biomedical GmbH, Rimpar, Germany), and the offset frequency of 23Na (∆𝜔0=33.8MHz±1150Hz) was measured and set for each scan. Sodium imaging was acquired using a 3D gradient-echo sequence: TR/TE = 130/0.99 ms; field-of-view (FOV)=192x192 mm2, spatial resolution=3x3x30 mm3; flip angle=90°; scan duration=15 minutes. Four aqueous sodium standards containing 10, 20, 30, and 40 mmol/L NaCl were used for signal calibration. In an identical FOV, proton-weighted imaging was acquired with the body coil using the multi-point Dixon method: TR/TE1/TE2= 200 ms/1.15 ms/2.30 ms; in-plane spatial resolution=1x1 mm2; slice thickness=5 mm; flip angle=90°, scan duration=4 minutes.
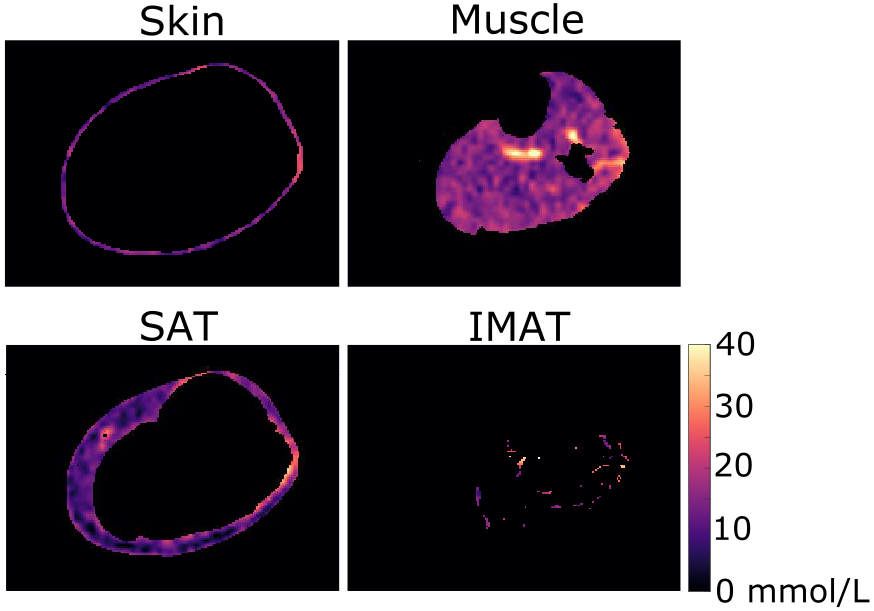
Statistical analysis & hypothesis testing: TSC was calculated based on a linear calibration of sodium MRI signal in the four aqueous sodium standards (Figure 1). Four regions of interest (ROIs) were calculated using an automated segmentation method to separate skin, muscle, subcutaneous adipose tissue (SAT), and inter-muscular adipose tissue (IMAT) areas of the leg (Figure 2). These regions of interest were then applied to the sodium image to obtain measures of tissue sodium content (TSC) in all regions. IMAT volume was calculated as the pixel volume of IMAT divided by the tissue sodium content of muscle. To evaluate our first hypothesis, Spearman's correlation was performed to evaluate the relationship between IMAT volume in muscle and total muscle tissue sodium content. To evaluate our secondary hypothesis, a two-tailed paired t-test was used to compare TSC in SAT and IMAT, with significance criteria of p<0.05 two-sided.
Results
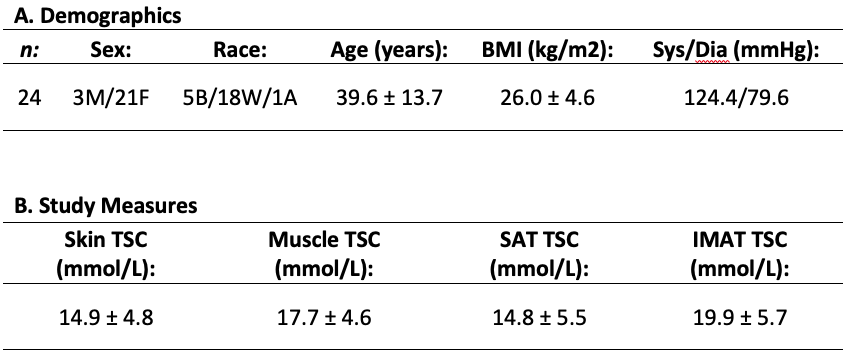
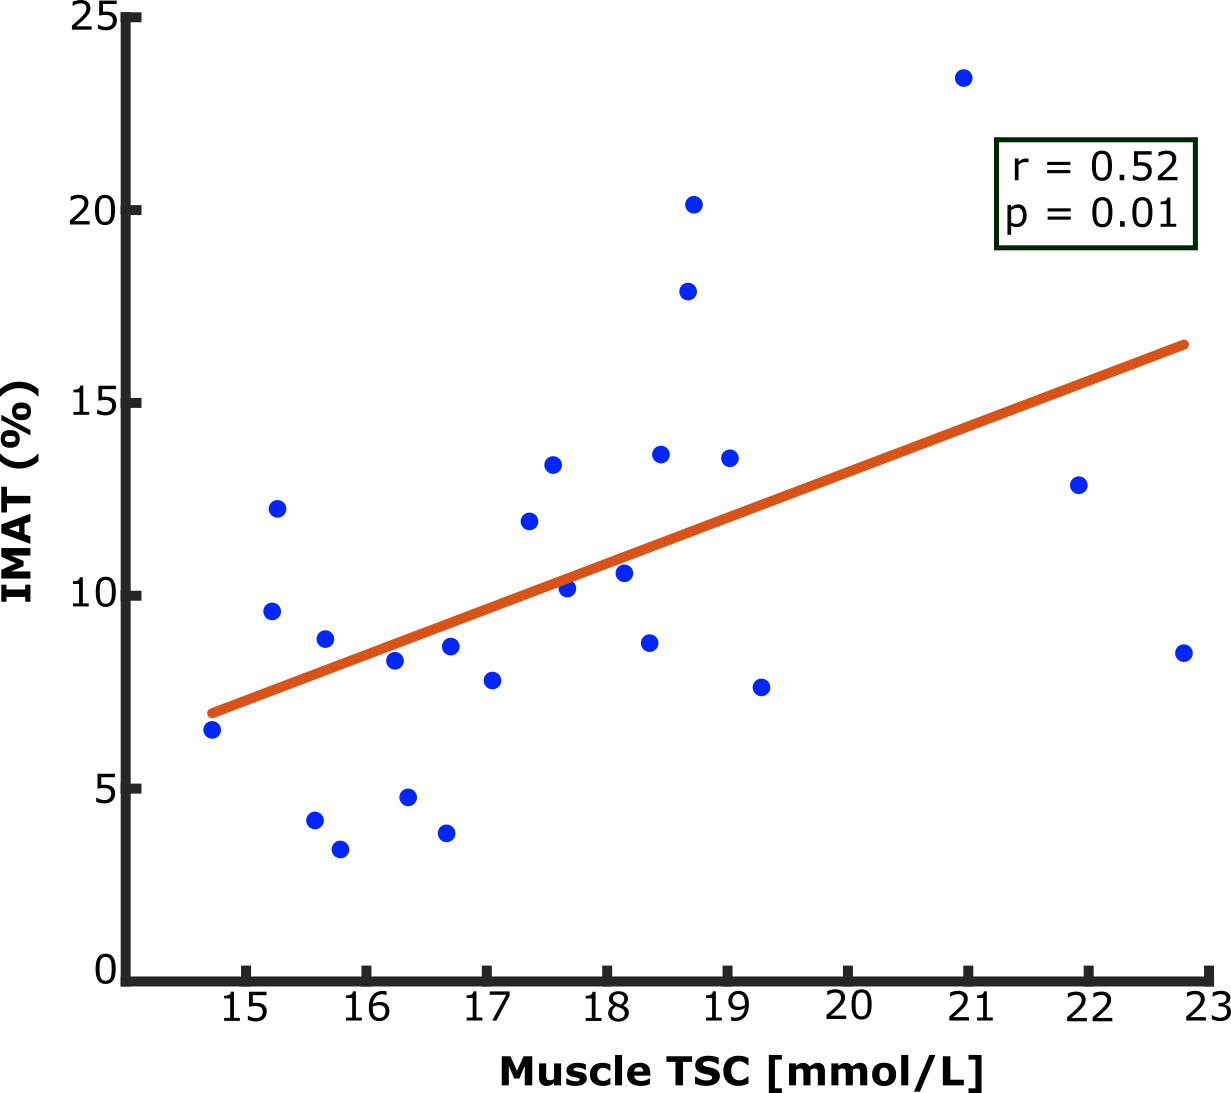
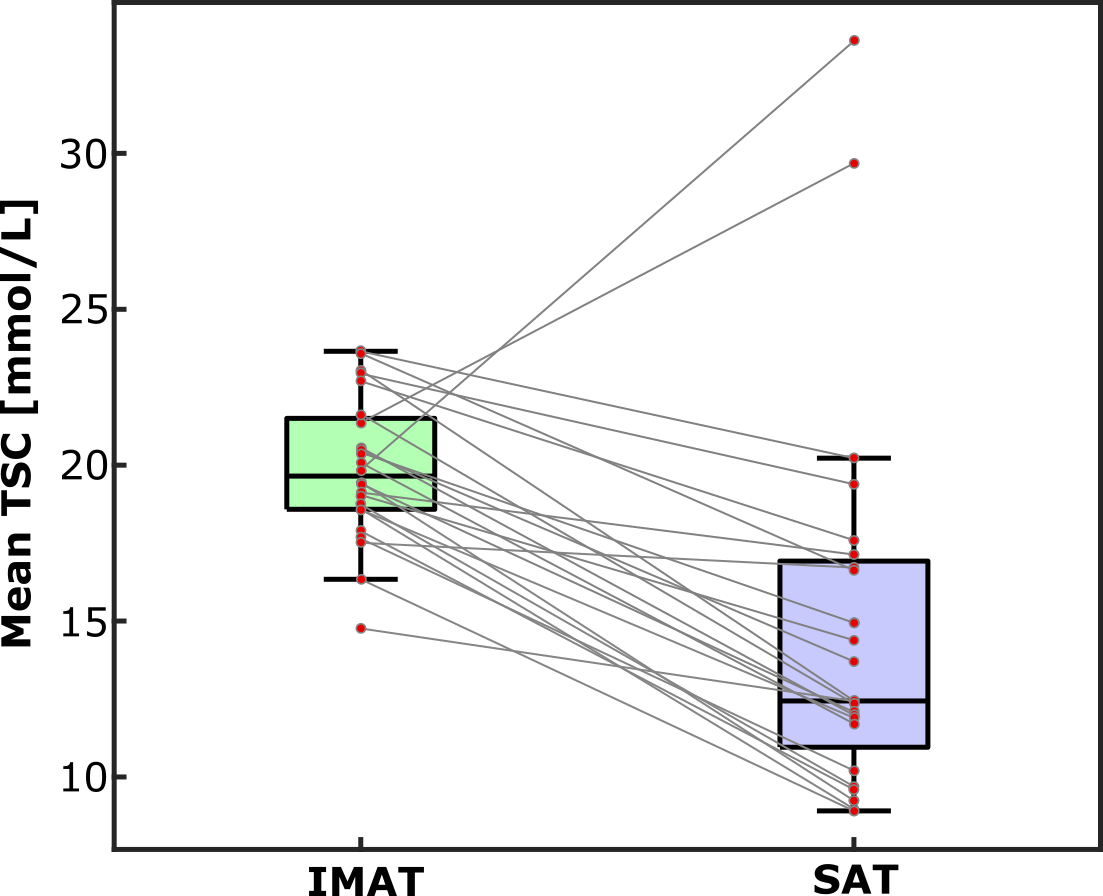
Demographic characteristics and study measures of the population are shown in Table 1. In technical observations, we found that applying the group-average of calibrated 23Na-signal slope and intercept to individual 23Na-weighted images produced a TSC percent error of 0.03%; individual calibrations were still used for measurement of standardized TSC. IMAT volume and muscle TSC were significantly correlated (r=0.52, p=0.01; Figure 3). Additionally, mean TSC was higher in IMAT than SAT (p<0.001; Figure 4).Discussion
There is a strong correlation between IMAT volume and TSC in the muscle compartment of healthy participants in this preliminary study. This finding suggests that expansion of ectopic fat in the muscle is related to sodium deposition in this compartment. In addition, observation of higher sodium content in IMAT than in SAT suggests that lower-extremity adipose tissue depots have intrinsically different mechanisms to store sodium.Conclusion
Multi-nuclear 1H/23Na sodium MRI reveals a positive correlation between peripheral tissue sodium and IMAT deposition in healthy adults, and the unique sodium composition of IMAT compared to SAT. Further ongoing studies will quantify tissue sodium and fat content of IMAT to aid our understanding of aging and diseases of insulin resistance.Acknowledgements
This study is supported in part by grants from the National Institute of Biomedical Imaging and Bioengineering T32 Postdoctoral Training in Biomedical MRI and MRS (5-T32-EB001628-19), American Heart Association (18CDA34110297), Lupus Research Alliance, the National Institutes of Health R01HL140145 (NHLBI), and Veterans Health Administration CDA (IK2CX001269). The sponsors did not influence the design, execution, and analysis of the results of the study. We would like to thank all the study coordinators and participants for their dedication to the study. Imaging experiments were performed in the Vanderbilt Human Imaging Core, using research resources supported by the National Institutes of Health (NIH) grant 1S10OD021771-01. We would also like to acknowledge the support and expertise of the technologists and the Human Imaging Core at the Vanderbilt University Institute of Imaging Science.References
1. De Carvalho FG, Justice JN, de Freitas EC, Kershaw EE, Sparks LM. Adipose Tissue Qualityin Aging: How Structural Skeletal Muscle Quality? Nutrients. 2019;11:2553.2.
2. Pellegrinelli V, Rouault C, Rodriguez-Cuenca S, et al. Human adipocytes induce inflammation and atrophy in muscle cells during obesity. Diabetes. 2015;64(9):3121-3134. doi:10.2337/db14-07963.
3. Sachs S, Zarini S, Kahn DE, et al. Intermuscular adipose tissue directly modulates skeletal muscle insulin sensitivity in humans. Am J Physiol Endocrinol Metab. 2019;316(5):E866-E879. doi:10.1152/ajpendo.00243.20184.
4. Kopp C, Linz P, Dahlmann A, et al. 23Na magnetic resonance imaging-determined tissue sodium in healthy subjects and hypertensive patients. Hypertension. 2013;61(3):635-640. doi:10.1161/HYPERTENSIONAHA.111.005665.
5. Deger SM, Wang P, Fissell R, et al. Tissue sodium accumulation and peripheral insulin sensitivity in maintenance hemodialysis patients. J Cachexia Sarcopenia Muscle. 2017;8(3):500-507. doi:10.1002/jcsm.121796.
6. Boettcher M, Machann J, Stefan N, et al. Intermuscular adipose tissue (IMAT): Association with other adipose tissue compartments and insulin sensitivity. J Magn Reson Imaging. 2009;29(6):1340-1345. doi:10.1002/jmri.217547.
7. Yim JE, Heshka S, Albu J, et al. Intermuscular adipose tissue rivals visceral adipose tissue in independent associations with cardiovascular risk. Int J Obes. 2007;31(9):1400-1405. doi:10.1038/sj.ijo.0803621
Figures