1278
Sodium 23Na-MRI relaxometry and tissue sodium content at 15.2T in a murine model of lymphangiogenesis1Biomedical Engineering, Vanderbilt University, Nashville, TN, United States, 2Vanderbilt University Institute of Imaging Science, Vanderbilt University Medical Center, Nashville, TN, United States, 3Radiology and Radiological Sciences, Vanderbilt University Medical Center, Nashville, TN, United States, 4Medical Physiology, Texas A&M University College of Medicine, Bryan, TX, United States, 5Electrical Engineering and Computer Science, Vanderbilt University, Nashville, TN, United States, 6Molecular Physiology and Biophysics, Vanderbilt University, Nashville, TN, United States, 7Physics and Astronomy, Vanderbilt University, Nashville, TN, United States
Synopsis
To investigate questions regarding the physiology of salt storage in skin and muscle and its relationship with lymphangiogenesis, we are developing sodium 23Na-MRI protocols for a mouse model of controllable lymphangiogenesis in adipose tissue. We acquired images at 15.2T from a UTE center-out sequence and quantified sodium longitudinal and bi-exponential transverse relaxation times and tissue sodium content (TSC) in the skin and muscle. Baseline TSC was reduced in animals undergoing lymphangiogenesis compared to littermates, while 23Na-relaxometry was similar. These results will be used for protocol development in this animal model to study sodium and lymphatic physiology.
Introduction
Preclinical studies demonstrate that lymphatics regulate tissue sodium levels via lymphangiogenesis1,2,3. However, it is unclear whether lymphangiogenesis can assist with the clearance of excess tissue sodium storage, which has been observed in the skin and muscle by multi-nuclear sodium 23Na-MRI and is a hallmark of patients with hypertension4. To study this physiology, we are developing sodium and lymphatic imaging strategies in a mouse model of lymphangiogenesis in adipose tissue (Adipo-VD)5, through inducible vascular endothelial growth factor-D (VEGF-D) expression. In this initial study, we measured sodium 23Na relaxation and tissue sodium content (TSC) measurements at 15.2T to test the hypothesis that TSC is reduced in animals with lymphangiogenesis.Methods
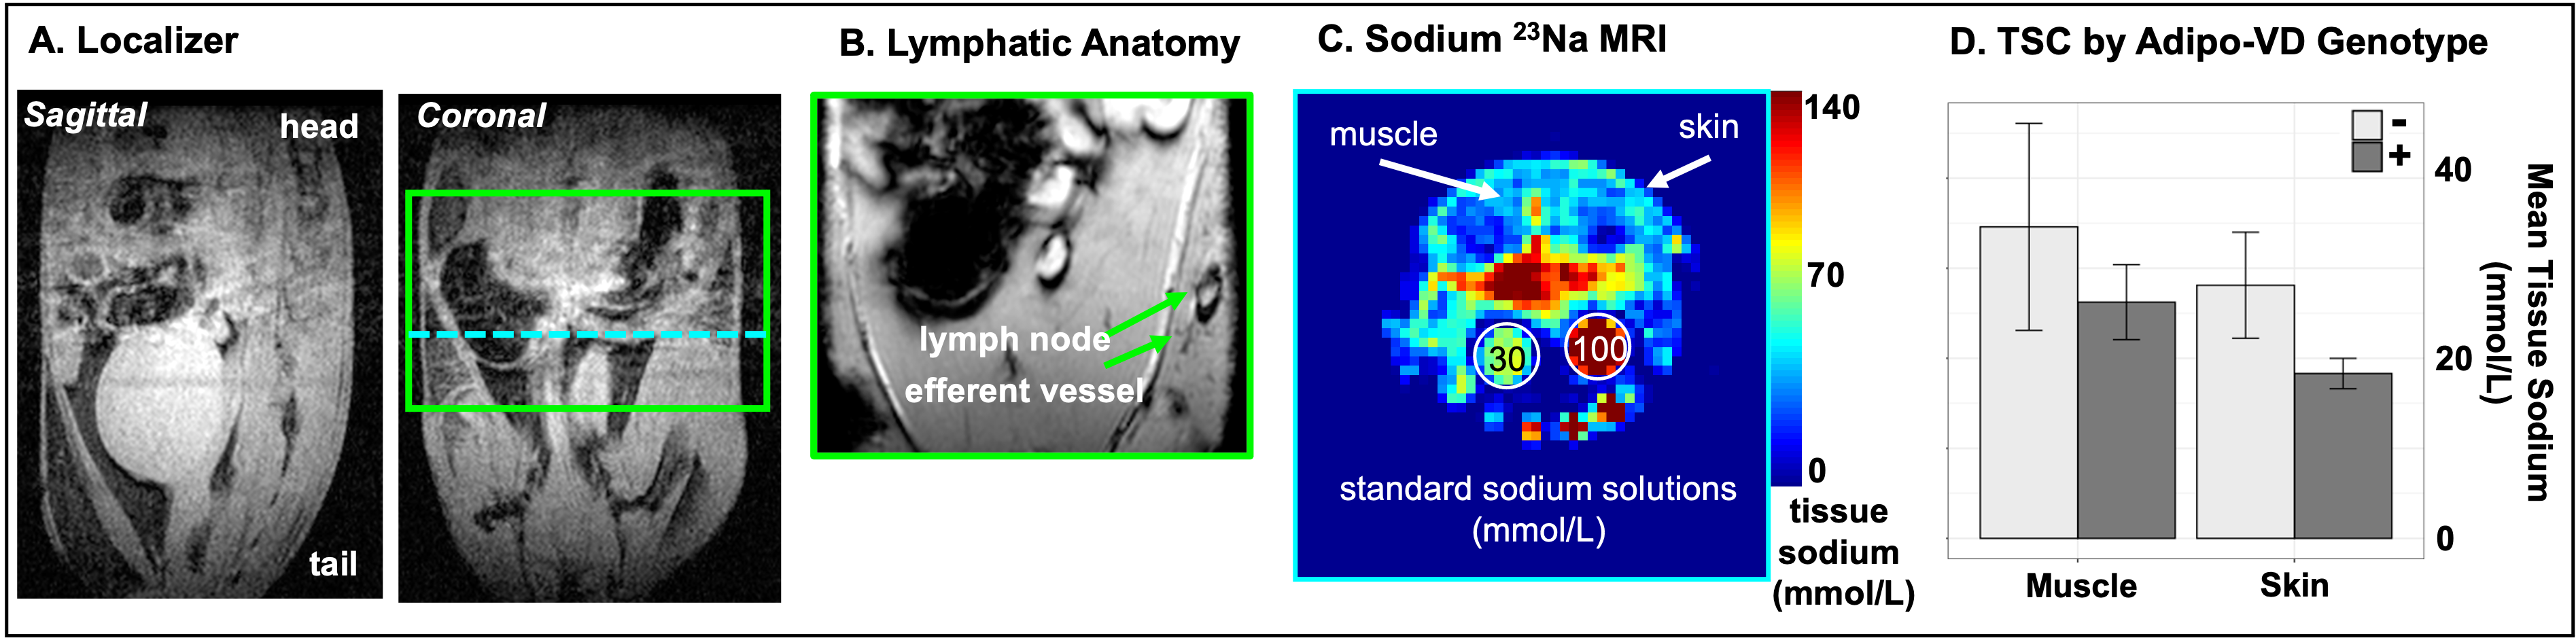
Animal Model. The Adipo-VD mouse model is capable of controlled de novo adipose tissue lymphangiogenesis from doxycycline-activated expression of murine VEGF-D via a tetracycline response element5. Three functionally Adipo-VD+ and three Adipo-VD- mice (N=6) were maintained in accordance with institutional guidelines and fed a 600 mg/kg doxycycline diet with standard 0.24% sodium content (Bio-Serv, Flemington, NJ, USA).Image Acquisitions. 23Na-MRI data were acquired with a 15.2T Bruker BioSpec (Bruker Biospin, Billerica, MA, USA) with a custom-built dual-tuned 1H/23Na volume coil. Animals were positioned with samples of 30 mmol/L and 100 mmol/L NaCl in deionized water in the field-of-view (FOV). Following localization of the area of interest consisting of abdominal fat including the inguinal lymph nodes (Figure 1A,1B), images were acquired with a 2D ultrashort echo time (UTE) radial center-out sequence with the following parameters: TR/TE=150/0.25 ms, number of projections=202, flip-angle=85 degrees, bandwidth=100,000 Hz, FOV=40x40x10 mm3, matrix=64x64, number of signal acquisitions (NA)=38. For T1 measurements, 2D UTE was repeated with identical parameters except NA=6, TE=0.128 ms, and six different TR = 30, 50, 100, 150, 200, 250 ms. For T2* measurements, 2D UTE was repeated with TR=150 ms and TE = 0.13, 0.25, 0.50, 1.0, 1.5, 2.0, 2.5, 5.0, 10.0, 20.0, 30.0, 50.0 ms. Images were reconstructed offline with Kaiser-Bessel gridding using a custom MATLAB routine (Mathworks, Natick, MA, USA). Tissue sodium maps were calculated based on a linear calibration of 23Na signal intensity in the standard samples (Figure 1C).
Relaxometry.
Naturally abundant 23Na is a spin = 3/2 system6 and interactions of the quadrupole moment with the external magnetic field and tissue microenvironment produce characteristic relaxation time constants (T1, T2*short, T2*long) which were quantified in two regions of interest (ROIs): skin and muscle. Relaxometry maps were generated by calculating the exponential time constants voxel-wise, and the mean time constants measured in each ROI. All fittings were performed in MATLAB using the non-linear trust-region-reflective fitting algorithm. Rician noise bias was corrected for using the method described by Gudbjartsson and Patz7 where noise was measured from a uniform region of thermal noise.
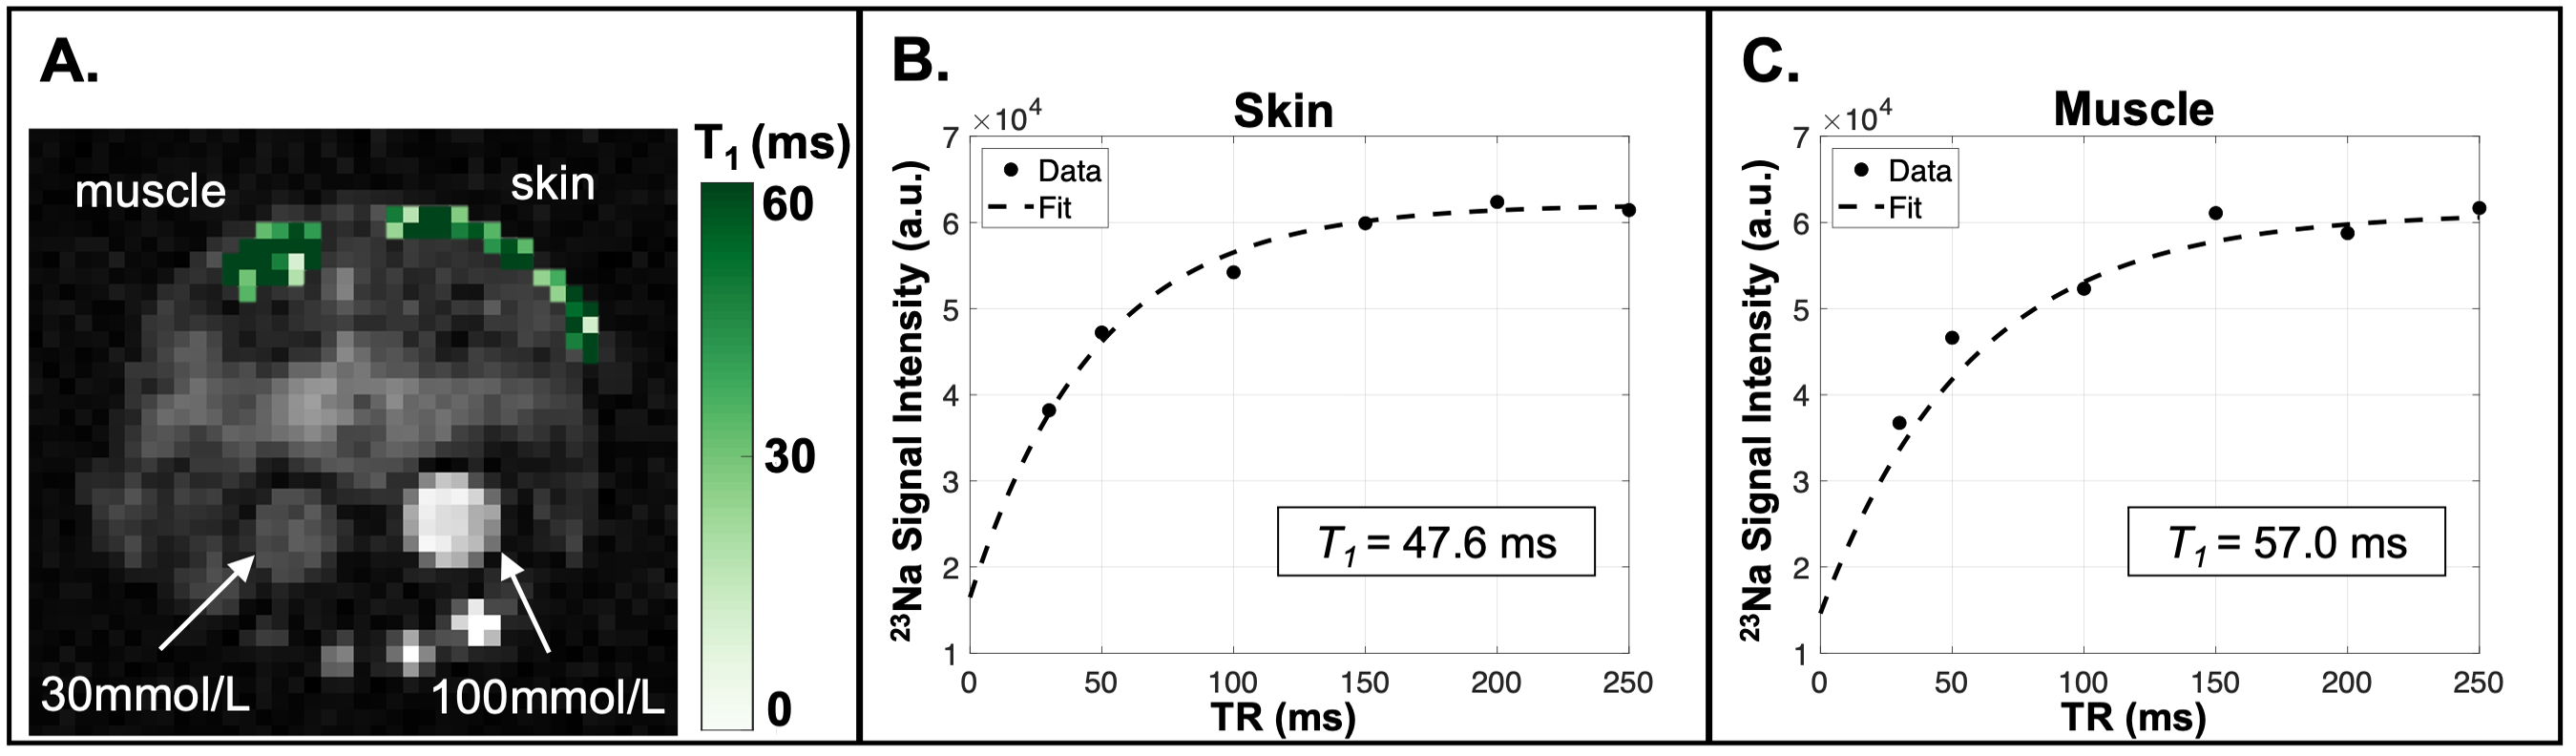
The 23Na longitudinal relaxation time constant (T1) was estimated using a model of mono-exponential recovery, as the short component is considered <20% of the signal even in non-aqueous environments8. A conventional Bloch equation model describing T1 exponential recovery was fit for three parameters:
$$S=A\bigg(1-B e^{\frac{-TR}{T_{1}}}\bigg)$$
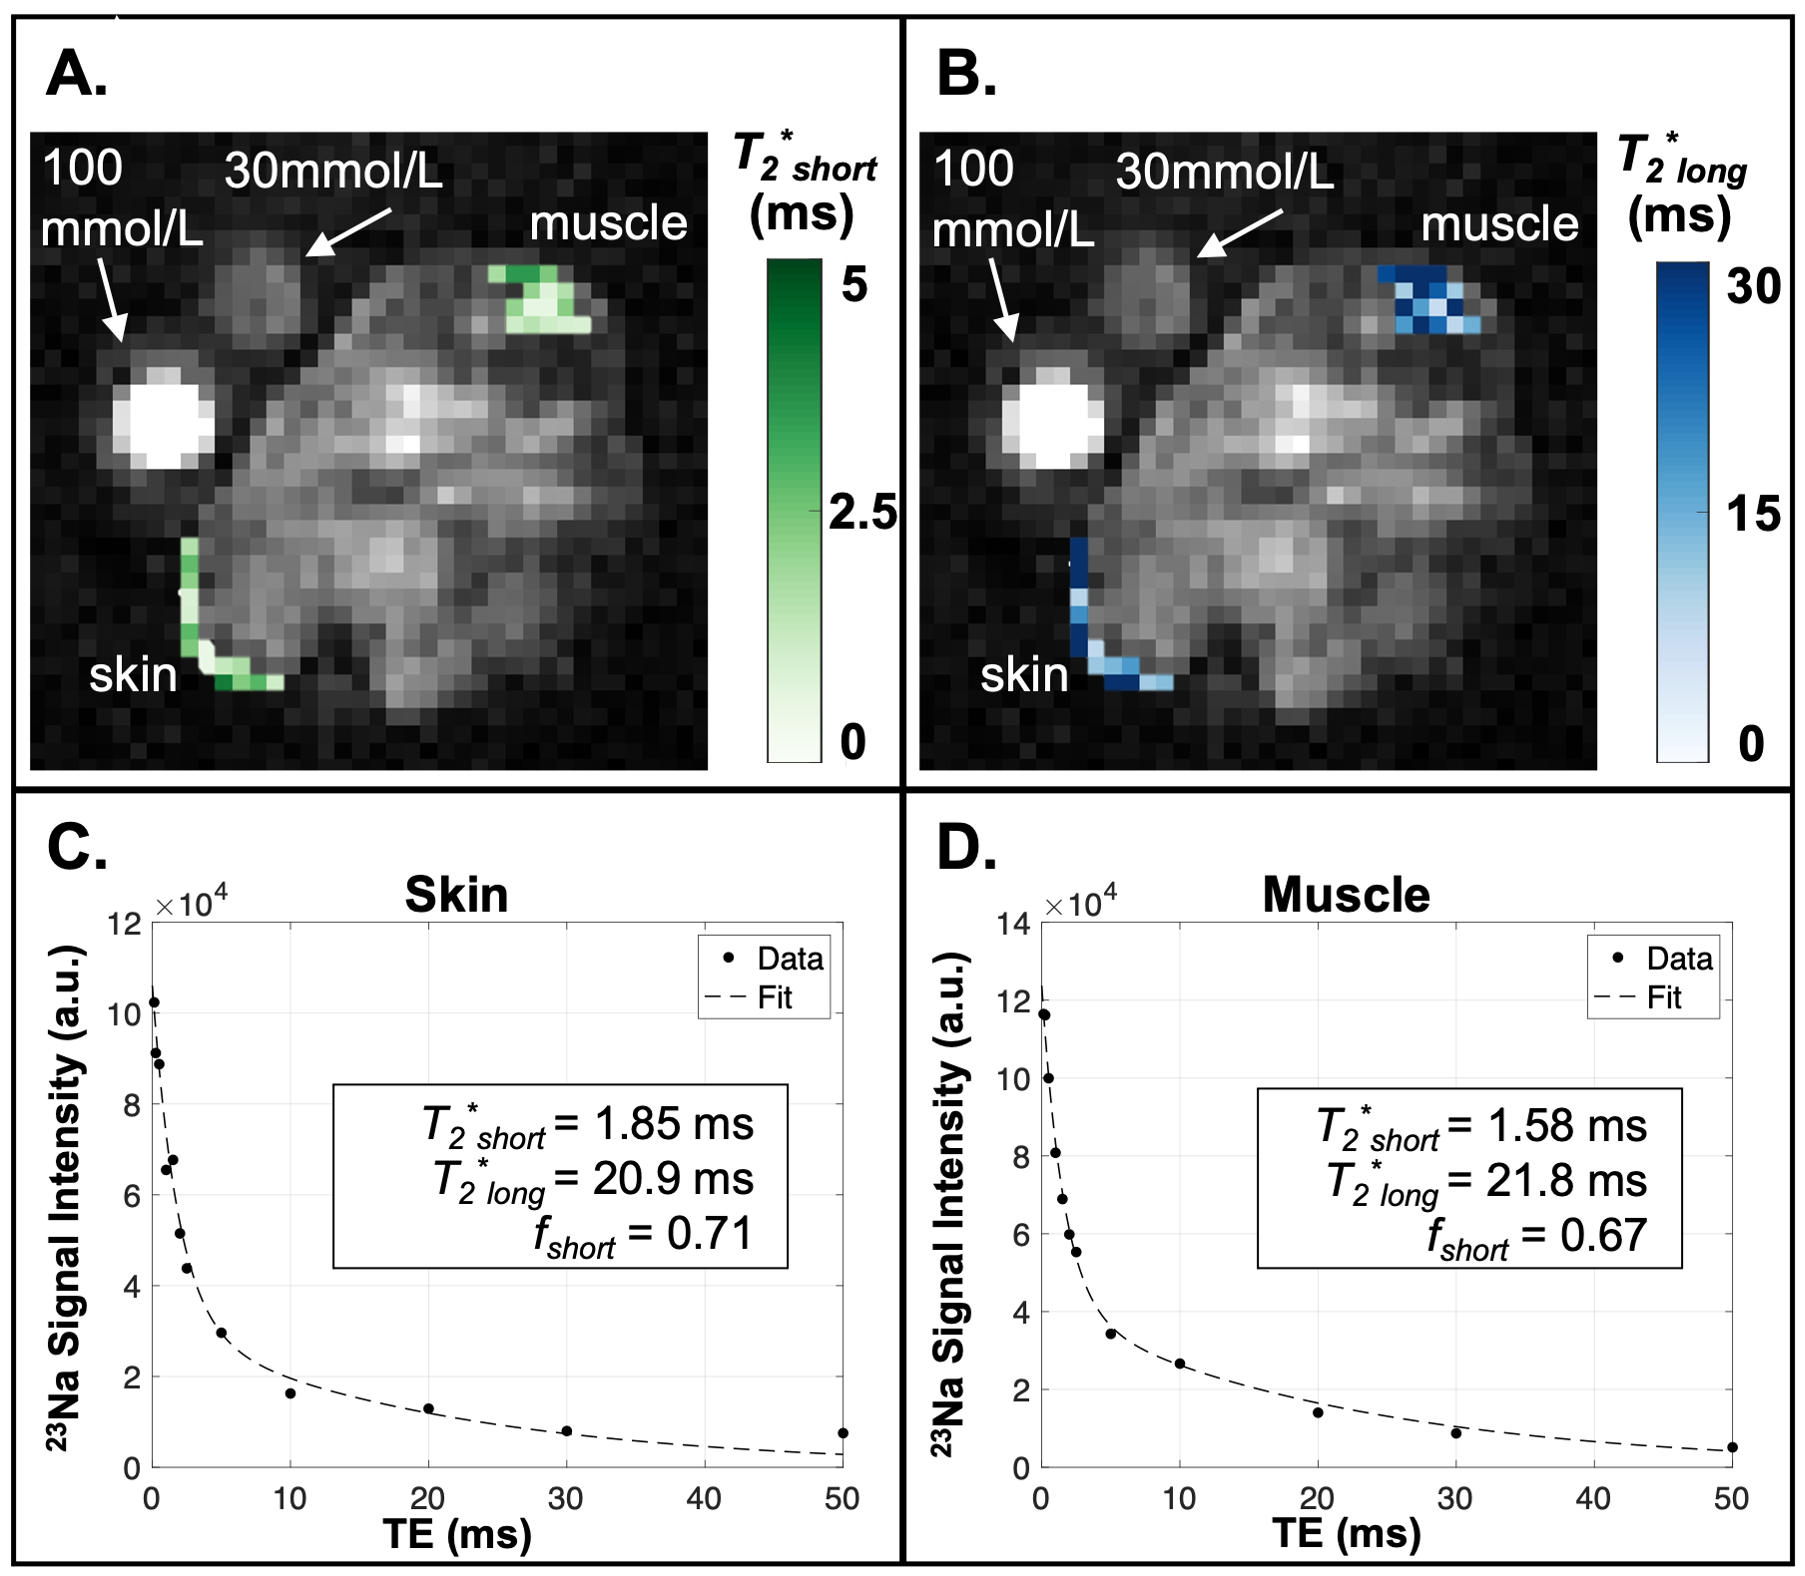
where A is constrained by the equilibrium signal intensity, and B is a term to correct for B1 perturbation. The 23Na transverse relaxation time constants corresponding to the short (T2*short) and long (T2*long) components were estimated using a model of bi-exponential decay9 fit for four parameters:
$$S=A\bigg(f_{short}e^{\frac{-TE}{{T_{2}^*}_{short}}} + (1-f_{short})e^{\frac{-TE}{{T_{2}^*}_{long}}}\bigg)$$
where A is constrained by the equilibrium signal intensity, and fshort is the relative fraction of the short component of the signal.
Results
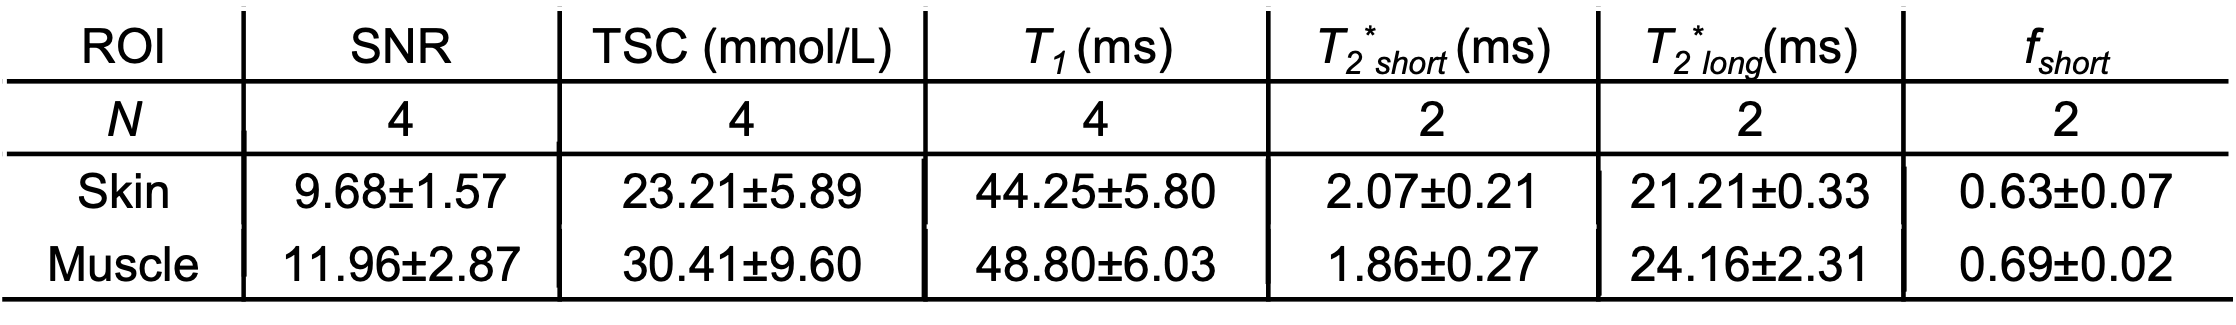
In this preliminary cohort of Adipo-VD mice imaged at 15.2T, skin TSC was observed to be lower in Adipo-VD+ vs. Adipo-VD- animals (18.30±1.68 mmol/L vs. 28.11±5.89 mmol/L, Figure 1D). The measured 23Na relaxation times and regional TSC are summarized in Figure 2. Relaxation times did not differ significantly between Adipo-VD+ and Adipo-VD- animals and were found to be T1=44.25±5.80 ms in the skin and T1=48.80±6.03 ms in the muscle (Figure 3). Bi-exponential T2* relaxometry in the skin was T2*short=2.07±0.21 ms and T2*long=21.21±0.33 ms, and in the muscle, T2*short=1.86±0.27 ms and T2*long=24.16±2.31 ms (Figure 4).Discussion
Our results demonstrate preliminary differences in 23Na-MRI tissue sodium content in a pre-clinical model of lymphangiogenesis, which may be useful for developing noninvasive imaging strategies to study sodium and lymphatic physiology. Sodium relaxometry in the rodent brain10 and human knee11 at high field strengths have been previously reported, but to our knowledge sodium relaxation rates at 15.2T have not been reported in preclinical models. Observed trends of lower tissue sodium in animals with lymphangiogenesis may be related to enhanced lymphatic functional clearance networks, which will be explored in further studies.Conclusion
We acquired sodium 23Na UTE MRI at 15.2T and used non-linear fitting techniques to estimate sodium 23Na-relaxation times and tissue sodium content in a unique animal model of controlled lymphatic growth. Animals with lymphangiogenesis demonstrated lower skin sodium content, while relaxation times in the skin and muscle were similar in this preliminary study.Acknowledgements
Funding was provided by the American Heart Association Innovative Project Award (AHA IPA 19IPLOI34760518). All imaging experiments were performed at the Vanderbilt University Institute of Imaging Science Center for Small Animal Imaging.References
1. Machnik A, Wolfgang N, Jantsch J, et al. Macrophages regulate salt-dependent volume and blood pressure by a vascular endothelial growth factor-C-dependent buffering mechanism. Nat. Med 2009; 15(5):545-552.
2. Wiig H, Schröder A, Wolfgang N, et al. Immune cells control skin lymphatic electrolyte homeostasis and blood pressure. J Clin Invest 2013; 123(7):2803-2815.
3. Kwon S, Agollah GD, Chan W, and Sevick-Muraca EM. Altered lymphatic function and architecture in salt-induced hypertension assessed by near-infrared fluorescence imaging. J Biomed Opt 2012. 17(8):089802.
4. Kopp C, Linz P, Dahlmann A, et al. 23Na magnetic resonance imaging-determined tissue sodium in healthy subjects and hypertensive patients. Hypertension 2013; 61(3):635-640.
5. Lammoglia GM, Van Zandt CE, Galvan DX, et al. Hyperplasia, de novo lymphangiogenesis, and lymphatic regression in mice with tissue-specific, inducible overexpression of murine VEGF-D. Am J Physiol Heart Circ Physiol 2016; 311:H384-H394
6. Rooney WD and Springer CS. A comprehensive approach to the analysis and interpretation of the resonances of 3/2 from living systems. NMR Biomed 1991; 4:209-226
7. Gudbjartsoon H and Patz S. The Rician Distribution of Noisy MRI Data. Magn. Reson. Med. 1995; 34(6):910-914
8. Bull TE. Nuclear magnetic relaxation of spin-3/2 nuclei involved in chemical exchange. J. Magn. Reson 1972; 8:344-353.
9. Boada FE, Christensen JD, Huang-Hellinger et al. Quantitative in vivo tissue sodium concentration maps: the effects of biexponential relaxation. MRM 1994; 32:219-223.
10. Schepkin VD, Brey WW, Gor’kov PL and Grant SL. Initial in vivo rodent sodium and proton MR imaging at 21.1T. Magn. Reson. Imaging 2010; 28:400-407.
11. Madelin G, Jerschow A, Regatte RR. Sodium relaxation times in the knee join in vivo at 7T. NMR Biomed 2011; 25(4):530-537
Figures