1277
2D 23Na imaging using half-VERSE pulses1Medical Physics in Radiology, German Cancer Research Center (DKFZ), Heidelberg, Germany, 2Faculty of Physics and Astronomy, University of Heidelberg, Heidelberg, Germany, 3Institute of Radiology, University Hospital Erlangen, Friedrich‐Alexander‐Universität Erlangen‐Nürnberg (FAU), Erlangen-Nürnberg, Germany, 4Physikalisch-Technische Bundesanstalt (PTB), Braunschweig and Berlin, Germany, 5Faculty of Medecine, University of Heidelberg, Heidelberg, Germany
Synopsis
In this work, a 2D radial 23Na sequence with half-VERSE pulses was developed to reduce SAR and achieve ultra-short TEs. Simulations and measurements of the slice profiles showed good agreement between full- and half-VERSE pulses with a maximal deviation in the FWHM of 7%.
In measurements, the TEmin was reduced from 1.41ms to 0.1ms by the use of half- instead of full-VERSE pulses. This resulted in an SNR gain of up to 18% in phantom, 7% in brain and 26% in calf measurements.
Last, rapid single-slice 23Na images (2.9x2.9x12mm3) were obtained in a clinically feasible acquisition time of 2:56min.
Introduction
23Na imaging was found to yield information additional to that provided by 1H MRI1. Even though 3D measurements are commonly conducted in 23Na MRI, certain applications benefit from 2D imaging, such as cardiac MRI with higher in-plane resolutions2.The slice-selective pulses used in 2D imaging are limited by SAR and maximum coil voltage constraints, which both can be addressed by the use of Variable-Rate Selective Excitation (VERSE) pulses2,3.
Another issue of conventional selective excitations are the long TEs, which are (for sinc/VERSE pulses) determined by half the pulse duration, the gradient ramp-down and the time required to rewind half the slice-selection gradient: $$$TE_{min}=\frac{\tau}{2}+T_{rampdown}+T_{rewind}$$$. Due to the short 23Na relaxation times, reduction of TE yields an increased SNR, which can be realized by the use of half pulses4.
In this work, a 2D 23Na sequence is presented, combining a VERSE routine for reduction of the SAR and peak voltage with half pulses to shorten the minimum TE.
Methods
A spoiled 2D radial sequence with VERSE excitation pulses was implemented. Here, the VERSE (also denoted as full-VERSE) pulses are constructed by processing a sinc pulse with a VERSE routine, as implemented in previous works5. After excitation, a slice-selection rewinder is applied, followed by a density-adapted readout gradient4, a rewinder in read direction and a simultaneous spoiling gradient, dephasing the magnetization over 4π in slice direction. A schematic sequence diagram is shown in Figure 1.To reduce the minimum TE, half-VERSE pulses were implemented, constructed by truncating the full-VERSE RF pulse and the corresponding slice-selection gradient after their first half. The duration of the half-pulse is doubled to keep the pulse duration and FA constant. Since the RF half-pulse ends at its maximum (i.e. at isodelay), only the ramp-down momentum must be rewound, which allows TEs below 0.1ms.
Repeating the sequence N times with varying readout directions enables homogenous sampling of the k-space. After a 1s pause, allowing recovery of the magnetization towards thermal equilibrium, the same N spokes are acquired a second time with an inverted orientation of the slice-selection gradient. Combination of the two sets results in N measured spokes in k-space, allowing use of the same reconstruction for both the VERSE and the half-VERSE sequence, which was performed using a NUFFT operator5 after application of a Hamming filter.
The theoretical slice profiles of the full-VERSE and half-VERSE pulses were compared using Bloch simulations (τ=1024µs, bandwidth-time-product (BWTP)={2.7,5}, T1=64ms, T2*=55ms, FA=35°, κ=0.5).
All measurements were performed on a 7T research system (Magnetom 7T, Siemens Healthcare) and a cylindrical phantom containing 0.9% NaCl was used. Six vials with Agar concentrations between 2% and 7% were inserted into the phantom, covering a range of relaxation times T1=35-50ms, T2s*=4-11ms, T2l*=25-40ms7. The slice profiles were measured (FA=35°, TE=5ms, TR={25,150}ms, slice thickness=56mm), which was enabled by inserting phase-encoding gradients8 in the sequence. The final profile was determined by averaging the signal in the center of each slice, subtracting the mean noise floor and then normalizing the profile to its maximum.
A 2D measurement (parameters in Figure 3) was conducted in the phantom to investigate the SNR gain due to the half-VERSE pulses using9:
$$$SNR=\sqrt{2-\frac{\pi}{2}}*\frac{mean(signal)}{std(noise)}$$$.
Further, the SNR increase was investigated in the brain and calf of two healthy volunteers (parameters in Figure 4). In the head measurements, the SNR was determined in the brain tissue under exclusion of CSF. For calf measurements, muscle tissue was selected, omitting bone and vessels.
Finally, another in vivo measurement was performed in the human calf with a shorter scan duration of TA=2:56min.
Results
Good agreement between the simulated slice profiles of half- and full-VERSE pulses was found as well as to the measured profiles (Figure 2). Slice profile FWHMs of simulations and measurements agree within 7%.In the 2D measurements (Figure 3), the use of half- instead of full-VERSE pulses allowed a reduction of the minimum TE from 1.41ms to 0.1ms.
A similar SNR for full- and half-pulses was found in compartments with long relaxation times (e.g. Compartment 2), while the SNR improvement by the half-VERSE pulse increased with shorter relaxation times, peaking at an SNR gain of 18% for an Agar concentration of 7%.
Figure 4 shows a representative head and calf measurement conducted with the half-VERSE sequence. SNR gains of 3% and 6% compared to the full-VERSE sequence were found in brain tissue for the two volunteers, while the SNR increases in calf tissue were 17% and 26%.
In Figure 5, the general applicability of the presented 2D 23Na half-VERSE sequence is shown for short TAs.
Discussion & Conclusion
A novel 2D sodium sequence using half-VERSE pulses was developed, which allowed reduction of TE from 1.41ms to 0.1ms compared to a full-VERSE sequence and therefore resulted in SNR improvements up to 26%. Lower SNR gains in brain tissue compared to calf may be linked to potentially longer relaxation times10, CSF contributions in the brain or minor slice profile alterations. Nevertheless, a gain in the SNR by use of half-VERSE pulses was found in all measurements. Further, 2D measurement of the calf muscle was possible in 2:56min (2.9x2.9x12mm3), allowing rapid single-slice mapping of 23Na in clinically feasible scan time.Acknowledgements
No acknowledgement found.References
1 Mark E Ladd, Peter Bachert, Martin Meyerspeer, Ewald Moser, Armin M Nagel, David G Norris, Sebastian Schmitter, Oliver Speck, Sina Straub, Moritz Zaiss; Pros and cons of ultra-high-field MRI/MRS for human application; Prog Nucl Magn Reson Spectrosc; 2018 Dec;109:1-50
2 Konstandin S, Schad LR. Two-Dimensional Radial Sodium Heart MRI Using Variable-Rate Selective Excitation and Retrospective Electrocardiogram Gating with Golden Angle Increments. Magn Reson Med. 2013; 70:791–799
3 Conolly S, Nishimura D, Macovski A. Variable-Rate Selective Excitation. J Magn Reson. 1988; 78:440-458
4 Konstandin S, Nagel AM, Heiler PM, Schad LR. Two-Dimensional Radial Acquisition Technique With Density Adaption in Sodium MRI. Magn Reson Med. 2011; 65:1091–1097
5 Schmitter S, Bock M, Johst S, Auerbach EJ, Ugurbil K, Van de Moortele PF. Contrast Enhancement in TOF Cerebral Angiography at 7 T Using Saturation and MT Pulses Under SAR Constraints: Impact of VERSE and Sparse Pulses Magn Reson Med. 2012; 68:188–197
6 Fessler JA, Sutton BP. Nonuniform Fast Fourier Transforms Using Min-Max Interpolation. IEEE Transactions on Signal Processing 2003;51:560-574
7 Fabian J. Kratzer, Sebastian Flassbeck, Sebastian Schmitter, Tobias Wilferth, Arthur W. Magill, Benjamin R. Knowles, Tanja Platt, Peter Bachert, Mark E. Ladd, Armin M. Nagel; 3D sodium (23Na) magnetic resonance fingerprinting for time-efficient relaxometric mapping. Magn Reson Med. 2021; 86: 2412– 2425
8 Kratzer FJ, Flassbeck S, Nagel AM, Schmitter S, Bachert P, Ladd ME, Behl NG. 23Na Imaging using VERSE Pulses in a Density Adapted Stack-of-Stars Sequence at 7T. In proc. UHF Workshop of ISMRM 2019
9 Hákon Gudbjartsson and Samuel Patz, The Rician Distribution of Noisy MRI Data, Magn Reson Med. 1995 Dec; 34(6): 910–914
10 Guillaume Madelin, and Ravinder R. Regatte: Biomedical Applications of Sodium MRI In Vivo, Journal Of Magnetic Resonance Imaging, 38:511–529 (2013)
Figures
Figure 1: Schematic plots of RF-pulses (a1), gradient-pulses (a2) as well as sequence diagrams for the full-VERSE (b1) and half-VERSE (b2) sequence. A reduced TEmin is achieved by the use of the half-VERSE pulse compared to the full-VERSE pulse since the pulse ends at its maximum and only the ramp-down must be rewound. The dashed blue line indicates the change from measuring the first to measuring the second half of the half-VERSE sequence, in which inverted Gz are used. Between these sets, the sequence is paused for 1 s to allow relaxation towards thermal equilibrium.
Figure 2: Bloch simulations of slice profiles shown in (a) are calculated for full- and half-VERSE pulses using BWTPs of 2.7 and 5. Measured slice profiles (FA = 35deg, TR (short/long)=25ms/150ms, TE (half/full)= 5ms, slice thickness = 56mm, 16 partitions, 200% partitions oversampling) are illustrated in (b) and (c) for BWTPs of 2.7 and 5.0. Overall, good agreement between the simulations and the measurements is found. Quantification of profile deviations are displayed in tables below plots. Simulations were performed using single pulses, hence no TR applies.
Figure 3: A 2D phantom measurement using the half-VERSE sequence is shown in (a), conducted using: TE=0.1ms, TR=20ms, BWTP=2.7, TA=800s, FA=40deg, 2.9x2.9x12mm3. Two circular ROIs were used for SNR calculation. The signal ROI was translated over compartments 1 through 7. Increasing SNR gain with higher Agar concentrations is observed, due to the shorter relaxation times (b).
Figure 4: Representative head (a) and calf (b) measurements conducted with the half-VERSE sequence: TE=0.1ms, TR=20ms, TA=13:21min, FA=40deg, BWTP=2.7, 2.9x2.9x12mm3. (c) Signals along dashed line in (b) for full- and half-VERSE. (d) SNR results for half- and full-VERSE excitation. Images with full-VERSE pulses were measured using identical parameters except TE=1.41ms, which is the minimum TE for the full-VERSE sequence. The SNR was evaluated in brain and calf tissue. SNR of half-VERSE pulses versus full-VERSE pulses increased by 3% and 7% in the head and 17% and 26% in the calf.
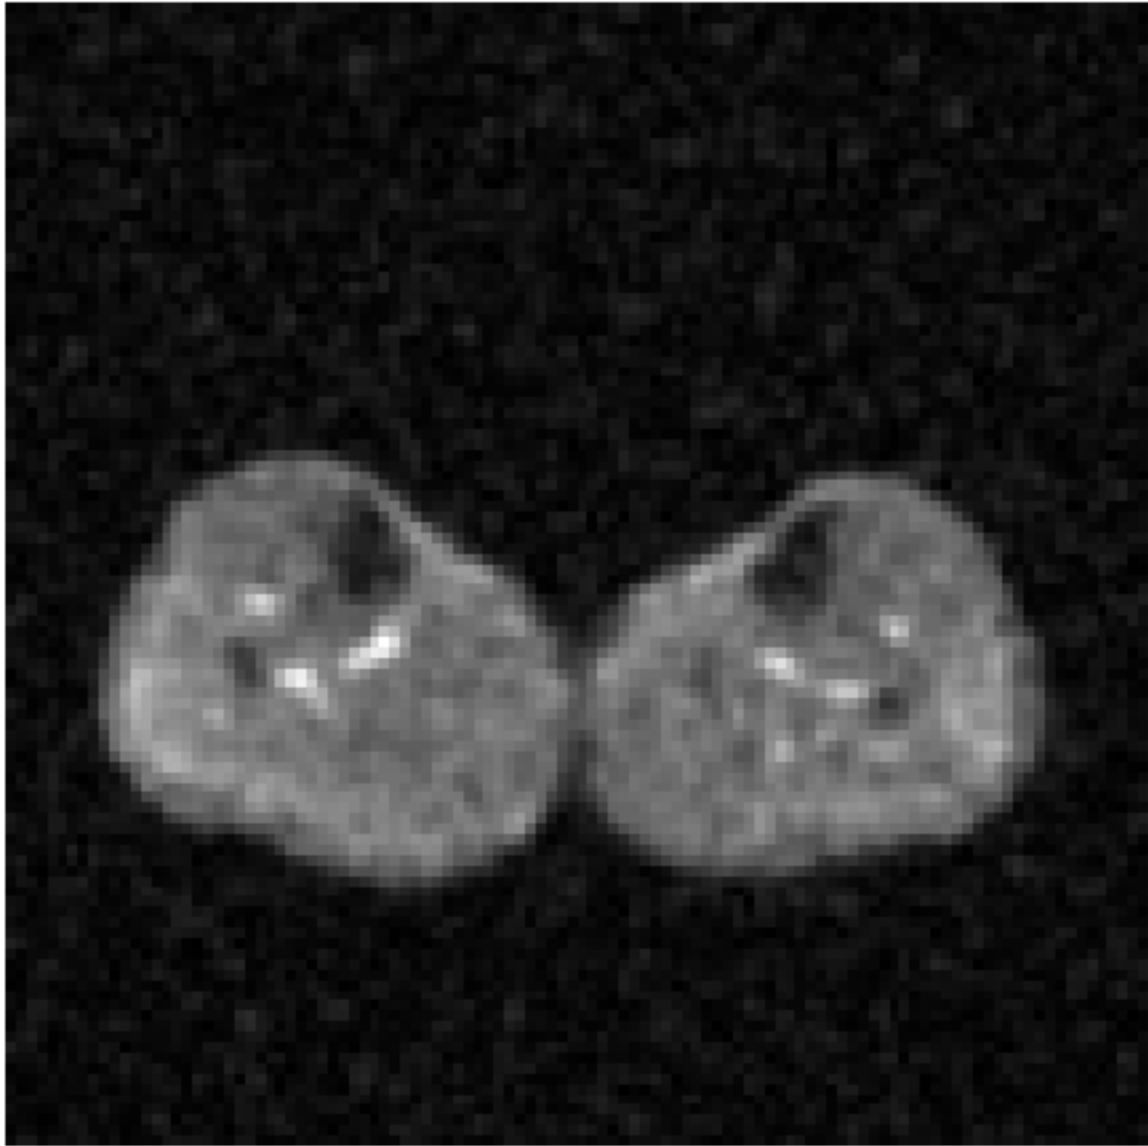
Figure 5: In vivo measurement in the calves of a healthy volunteer using half-VERSE pulses with a short TA=2:56min (FA=46deg, TE=0.1ms, TR=25ms, 2.9x2.9x12mm3, BWTP=2.7), demonstrating the potential of the proposed sequence for rapid acquisition of single-slice 2D 23Na images.