1276
Quantitative Sodium MRI of the Intervertebral Discs at 7T1Medical Physics in Radiology, German Cancer Research Center (DKFZ), Heidelberg, Germany, 2Faculty of Physics and Astronomy, Ruprecht Karl University of Heidelberg, Heidelberg, Germany, 3Radiology, German Cancer Research Center (DKFZ), Heidelberg, Germany, 4University Hospital Erlangen, Institute of Radiology, Friedrich-Alexander-Universität Erlangen-Nürnberg (FAU), Erlangen, Germany, 5Faculty of Medicine, Ruprecht Karl University of Heidelberg, Heidelberg, Germany
Synopsis
23Na-MRI offers the possibility for non-invasive quantification of the sodium concentration in-vivo. The obtained functional information can provide interesting insights into the degeneration state of the human intervertebral discs1 (IVDs). The presented work thus aimed to quantify the tissue sodium concentration (TSC) in the human intervertebral discs via 23Na-MRI at 7T and to compare the obtained concentrations for two healthy volunteers after the course of one year. The estimate average concentration for all IVDs of both volunteers was found to be (96.5±8.8)mM and (113.6±9.5)mM, respectively.
Introduction
Sodium MRI of the human intervertebral discs (IVDs) is a promising candidate for a non-invasive biomarker to assess the degeneration status of the IVDs, which is assumed to be linked to proteoglycans1. However, approaches measuring proteoglycan content are currently not established in clinical routine.To estimate the TSC in the IVDs we applied various correction methods that were first validated in phantom measurements. For a longitudinal comparison, the TSC measurements were repeated after approximately one year.
Methods
The TSC was determined in two healthy volunteers (female, age 26/31years, weight 65/85kg, measured head-first supine with the hands above the head). The data acquired for a previous abstract2 were reevaluated with respect to the IVDs. Additionally, new data were acquired with a new setup. To ensure reliable comparison, only the vial configuration was improved to increase the space and comfort for the volunteers. For the concentration determination, four external reference vials with NaCl solutions were positioned under the phantom (20mM/30mM/40mM/50mM) or under the back of the volunteer (20mM/40mM/60mM/120mM). For the recent scan, the reference vials were chosen to have an oval instead of a round cross section and were positioned lower within the coil (see Fig.2). All measurements were performed on a 7T whole-body MR system3 with a custom-built oval-shaped body coil4. For phantom investigations, a phantom filled with 35mM NaCl solution was measured. Density-adapted 3D radial sampling5 with a golden angle projection distribution6 was applied and to generate B1+ maps, the dual-flip angle method7 was used, resulting in a total acquisition time of about 80min. To correct for B1- inhomogeneities, B1- maps of the radiofrequency coil were simulated4 for the particular phantom setup and in a human voxel model8,9, scaled by 5% to better fit the volunteers’ anatomy, using the electromagnetic field simulation software CST10. The B1+ maps were Gauss-filtered (σ=10mm), while the image data were filtered with a Hamming filter. The quantitative in-vivo images were zero-filled with a zero-filling factor of two and the B1+ maps were zero-filled to generate the same voxel size as the quantitative images. T1 relaxation effects in the reference vials and phantom were corrected according to the FLASH equation. The concentrations in the phantom and IVDs were determined with a semi-automated segmentation tool developed in Matlab11 using the known concentration in the reference vials and a linear fit. For the evaluation, the five IVDs Th11/Th12 to L3/L4 were chosen as they were visible in all measurements and central enough to avoid strong B1 inhomogeneities close to the end rings of the birdcage coil. The regions of interest (ROIs) of the IVDs were segmented in axial view after rotating the image for each evaluated IVD to be parallel to the axial plane (see Fig.1). The ROI was then chosen to have a thickness of 4 pixels to take the IVD thickness of around 1cm12,13 into account.Results
The concentrations determined in the phantom can be found in Figure 3(c) and are visualized in Figure 3(a-b). The in-vivo concentrations for the evaluated IVDs vary between (92.0±20.7)mM and (170.7±46.5)mM. The mean concentrations for the volunteers are (96.5±8.8)mM and (113.6±9.5)mM, respectively. Between the first and second scan, the concentrations varied by a mean of 3.5% and 20.1% for determined Volunteer One and Two respectively.Discussion & Conclusion
23Na concentration quantification for the human IVDs at 7T with external reference vials was performed. Phantom measurements with the new setup showed concentration values closer to the ground truth than with the previous setup for the entire phantom and even for uncorrected data, indicating that the new positioning was in a region of the coil with more homogeneous transmit and receive field distributions (see Fig.2). Apart from this, both phantom measurements achieved similar results. After validating the utilized correction scheme in phantom measurements, the workflow was employed for in-vivo data, and the obtained TSC values for the IVDs are on the same order as the literature values measured at 3T14, ranging from 150mM to 300mM. The maximum values within the ROIs are also similar to those measured at 3T determined after registration to 1H data15. Choosing only the maximum value within the ROI can limit partial volume effects, which lead to an underestimation of the TSC, but is more susceptible to possible outliers.Registration of 23Na images with high-resolution hydrogen images would help to segment the IVDs, but so far the setup used does not allow for a 23Na/1H dual-nuclear measurement without repositioning the volunteer. As the vial concentrations for the in-vivo measurements were chosen to fit the expected range of investigated concentrations in the abdomen, the determined fit might deviate more in the regions of higher concentrations, which could increase the uncertainty of the determined concentration in the IVDs. Nevertheless the concentrations were reused to have a longitudinal comparison between both vial setups. In future investigations more measurements with the new setup and different vial concentrations (e.g. up to 300mM) could be performed to investigate the potentially improved accuracy of the determined TSC in the IVD with the new vial setup. A prospective longitudinal study in a larger cohort would enable the assessment of repeatability and thus the sensitivity to detect potential pathological changes.
Acknowledgements
References
1. Š. Zbýň et al. NMR Biomed. (2016). https://doi.org/10.1002/nbm.3280
2. A. Scheipers et al. Proc. Intl. Soc. Mag. Reson. Med. 30 (2021). Abstract: 0238.
3. MAGNETOM 7T, Siemens Healthcare GmbH, Erlangen, Germany
4. T. Platt et al. Magn. Reson. Med. (2018). https://doi.org/10.1002/mrm.27103
5. A. M. Nagel et al. Magn. Reson. Med. (2009). https://doi.org/10.1002/mrm.22157
6. R. W. Chan et al. Magn. Reson. Med. (2009). https://doi.org/10.1002/mrm.21837
7. E. K. Insko, L. Bolinger, J. Magn. Reson. (1993). https://doi.org/10.1006/jmra.1993.1133.
8. A. Christ et al. Phys. Med. Biol. (2010); 55:N23-N38.
9. P. A. Hasgall et al. IT’IS database for thermal and electromagnetic parameters of biological tissues, Version 2.6, www.itis.ethz.ch/database.
10. CST Studio Suite 2019/2020 (Dassault Systèmes, Vélizy-Villacoublay, France)
11. The MathWorks Inc., Natick, MA, USA
12. N. Roberts et al. J Magn Reson Imaging (1997). https://doi.org/10.1002/jmri.1880070517.
13. L. Twomey, J. Taylor, Acta Orthop. Scand. (1985). https://doi.org/10.3109/17453678508993043.
14. C. Wang et al. Spine (2010). https://doi.org/10.1097/BRS.0b013e3181b32d3b
15. C. Moon et al. Proc. Intl. Soc. Mag. Reson. Med. 19 (2011). Abstract: 3244.
16. Z. Shao et al. Spine (2002). https://doi.org/10.1097/00007632-200202010-00013
17. J. S. Pooni et al. Surg Radiol Anat. (1986). https://doi.org/10.1007/BF02427846Figures
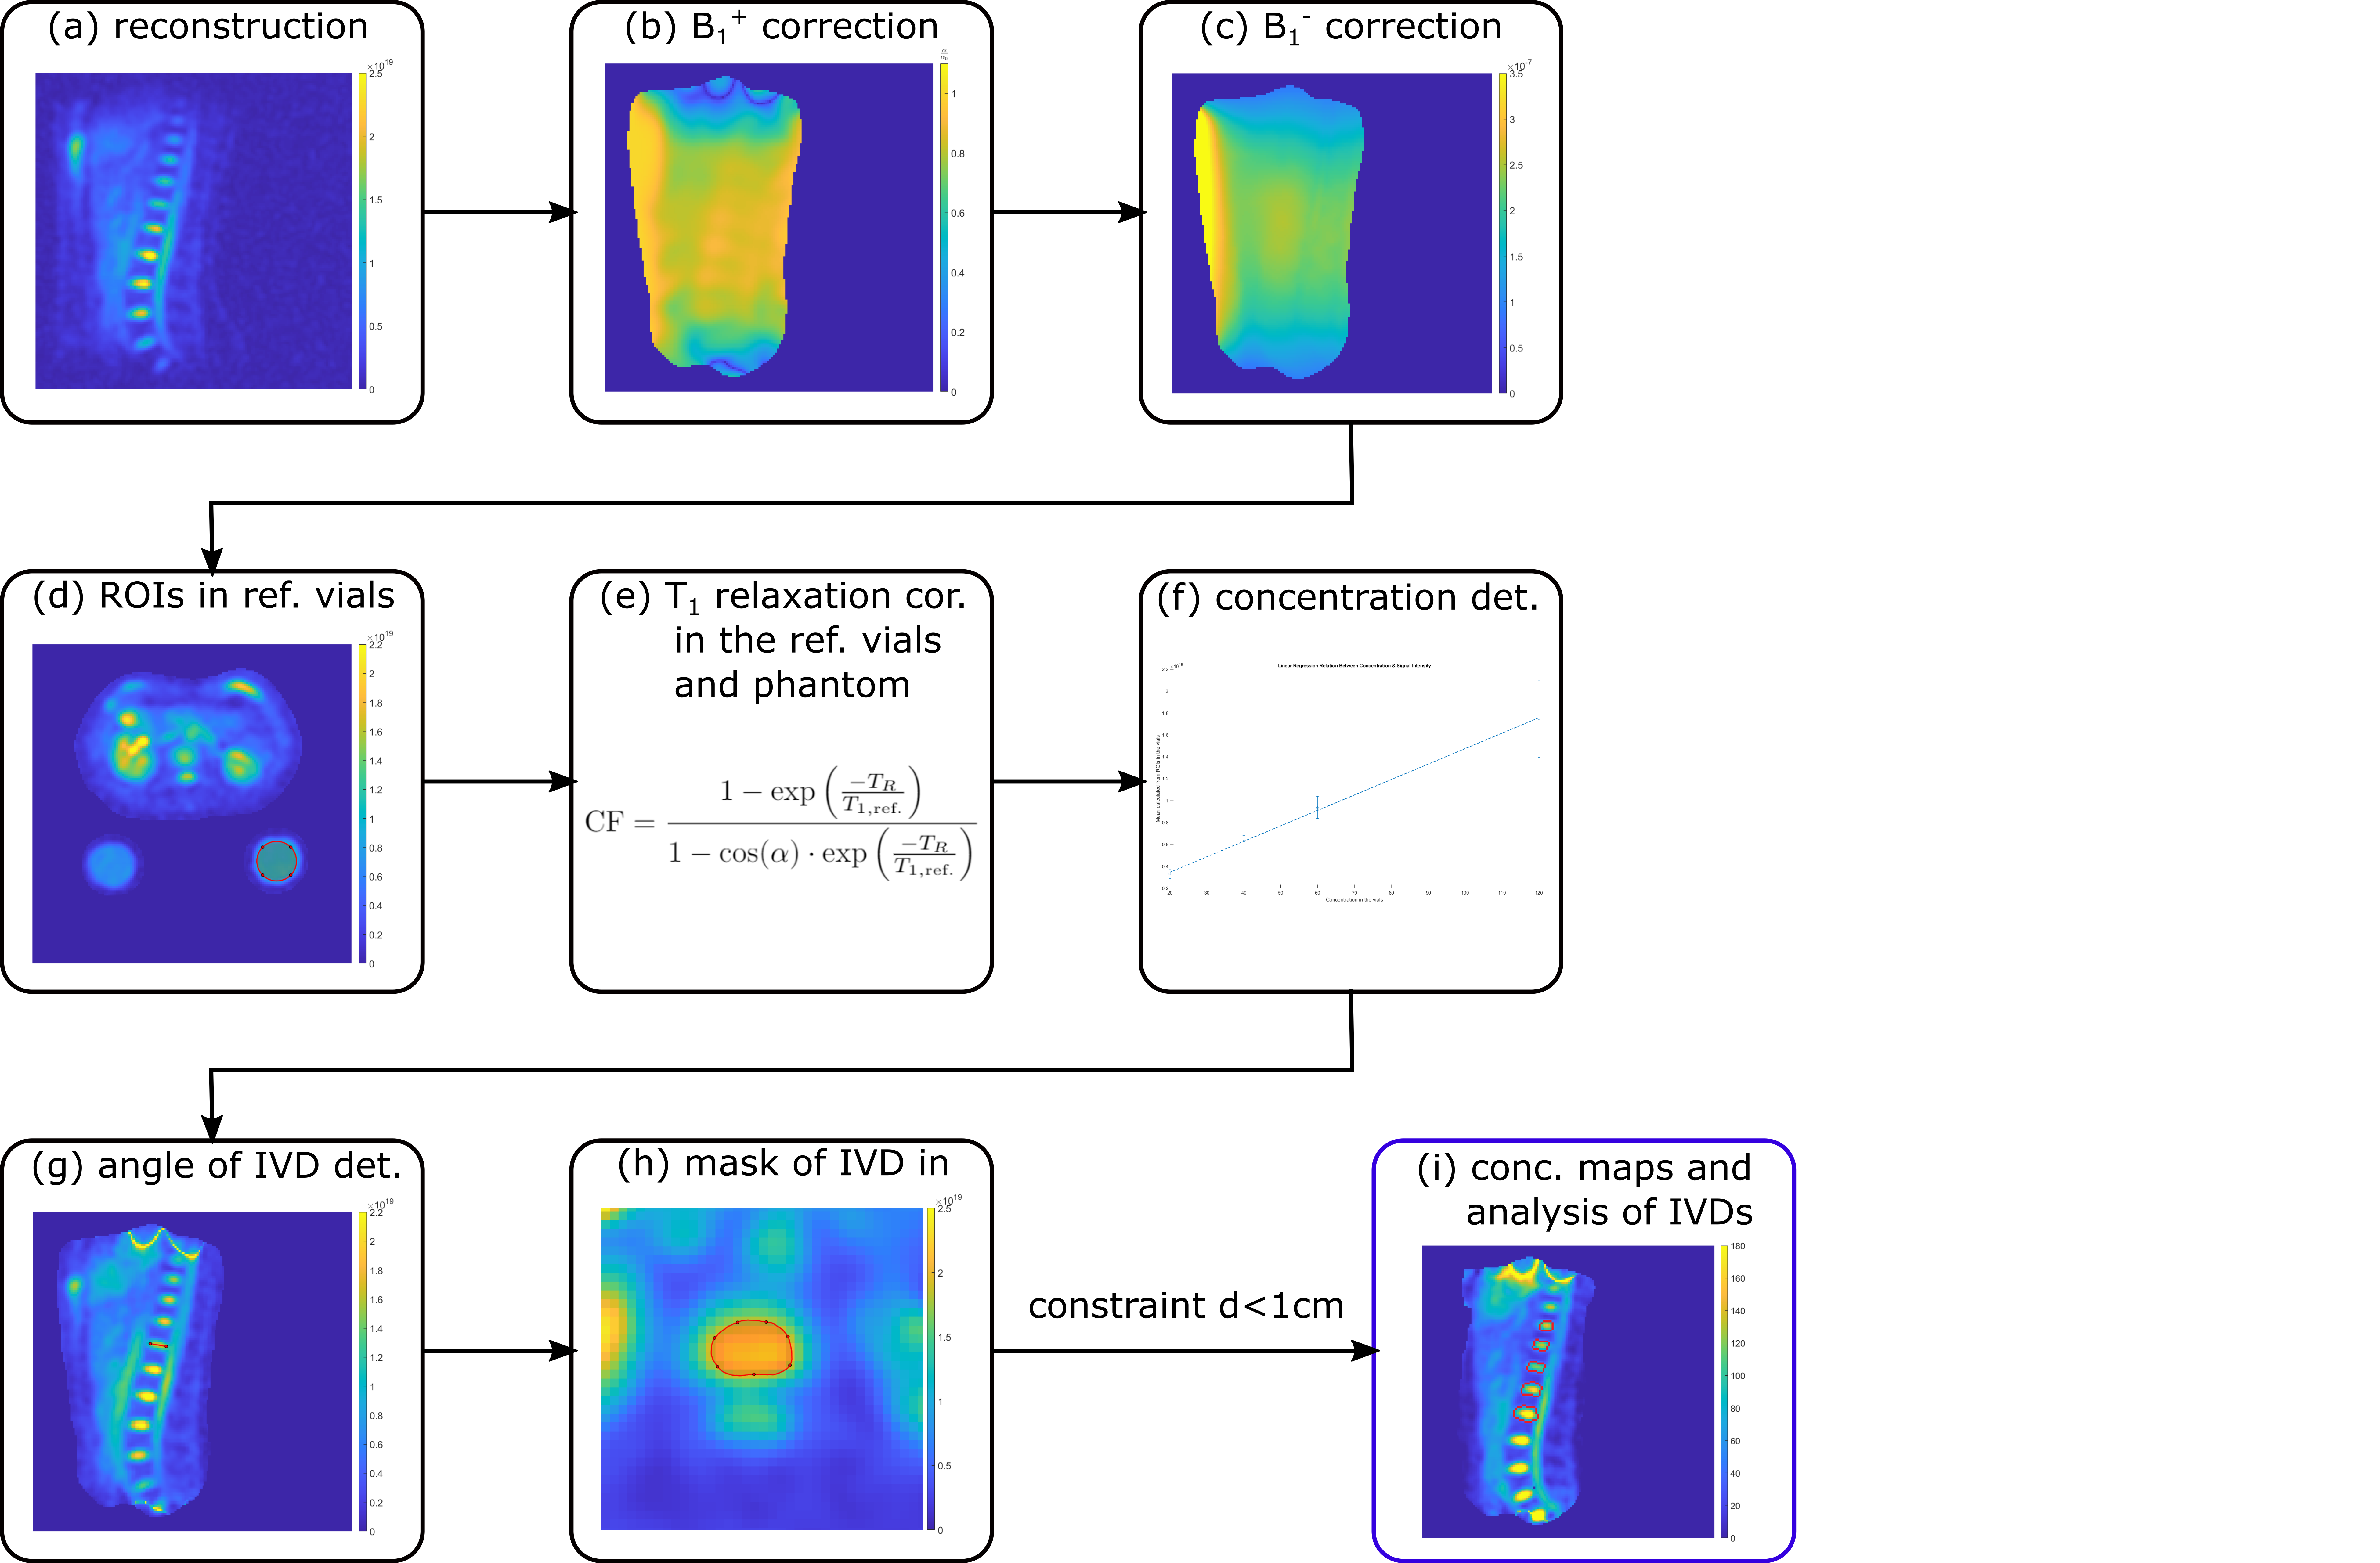
Fig. 1: A schematic of the workflow for quantitative abdominal 23Na MRI is depicted from the reconstruction (a) to the determination of the sodium concentration in the IVDs (i). Quantitative images were acquired with the following parameters: flip angle α=61°, TE/TR=1ms/150ms, nominal spatial resolution (Δx)3=(5mm)3, pulse duration tP=1.8ms, readout time tRO=5ms, number of projections nProj=16300. B1+ maps were acquired with the dual-flip angle method7 (α=45°/90°, TE/TR=1.55ms/150ms, (∆x)3=(10mm)3, tP=3ms, tRO=10ms, nProj=8200).
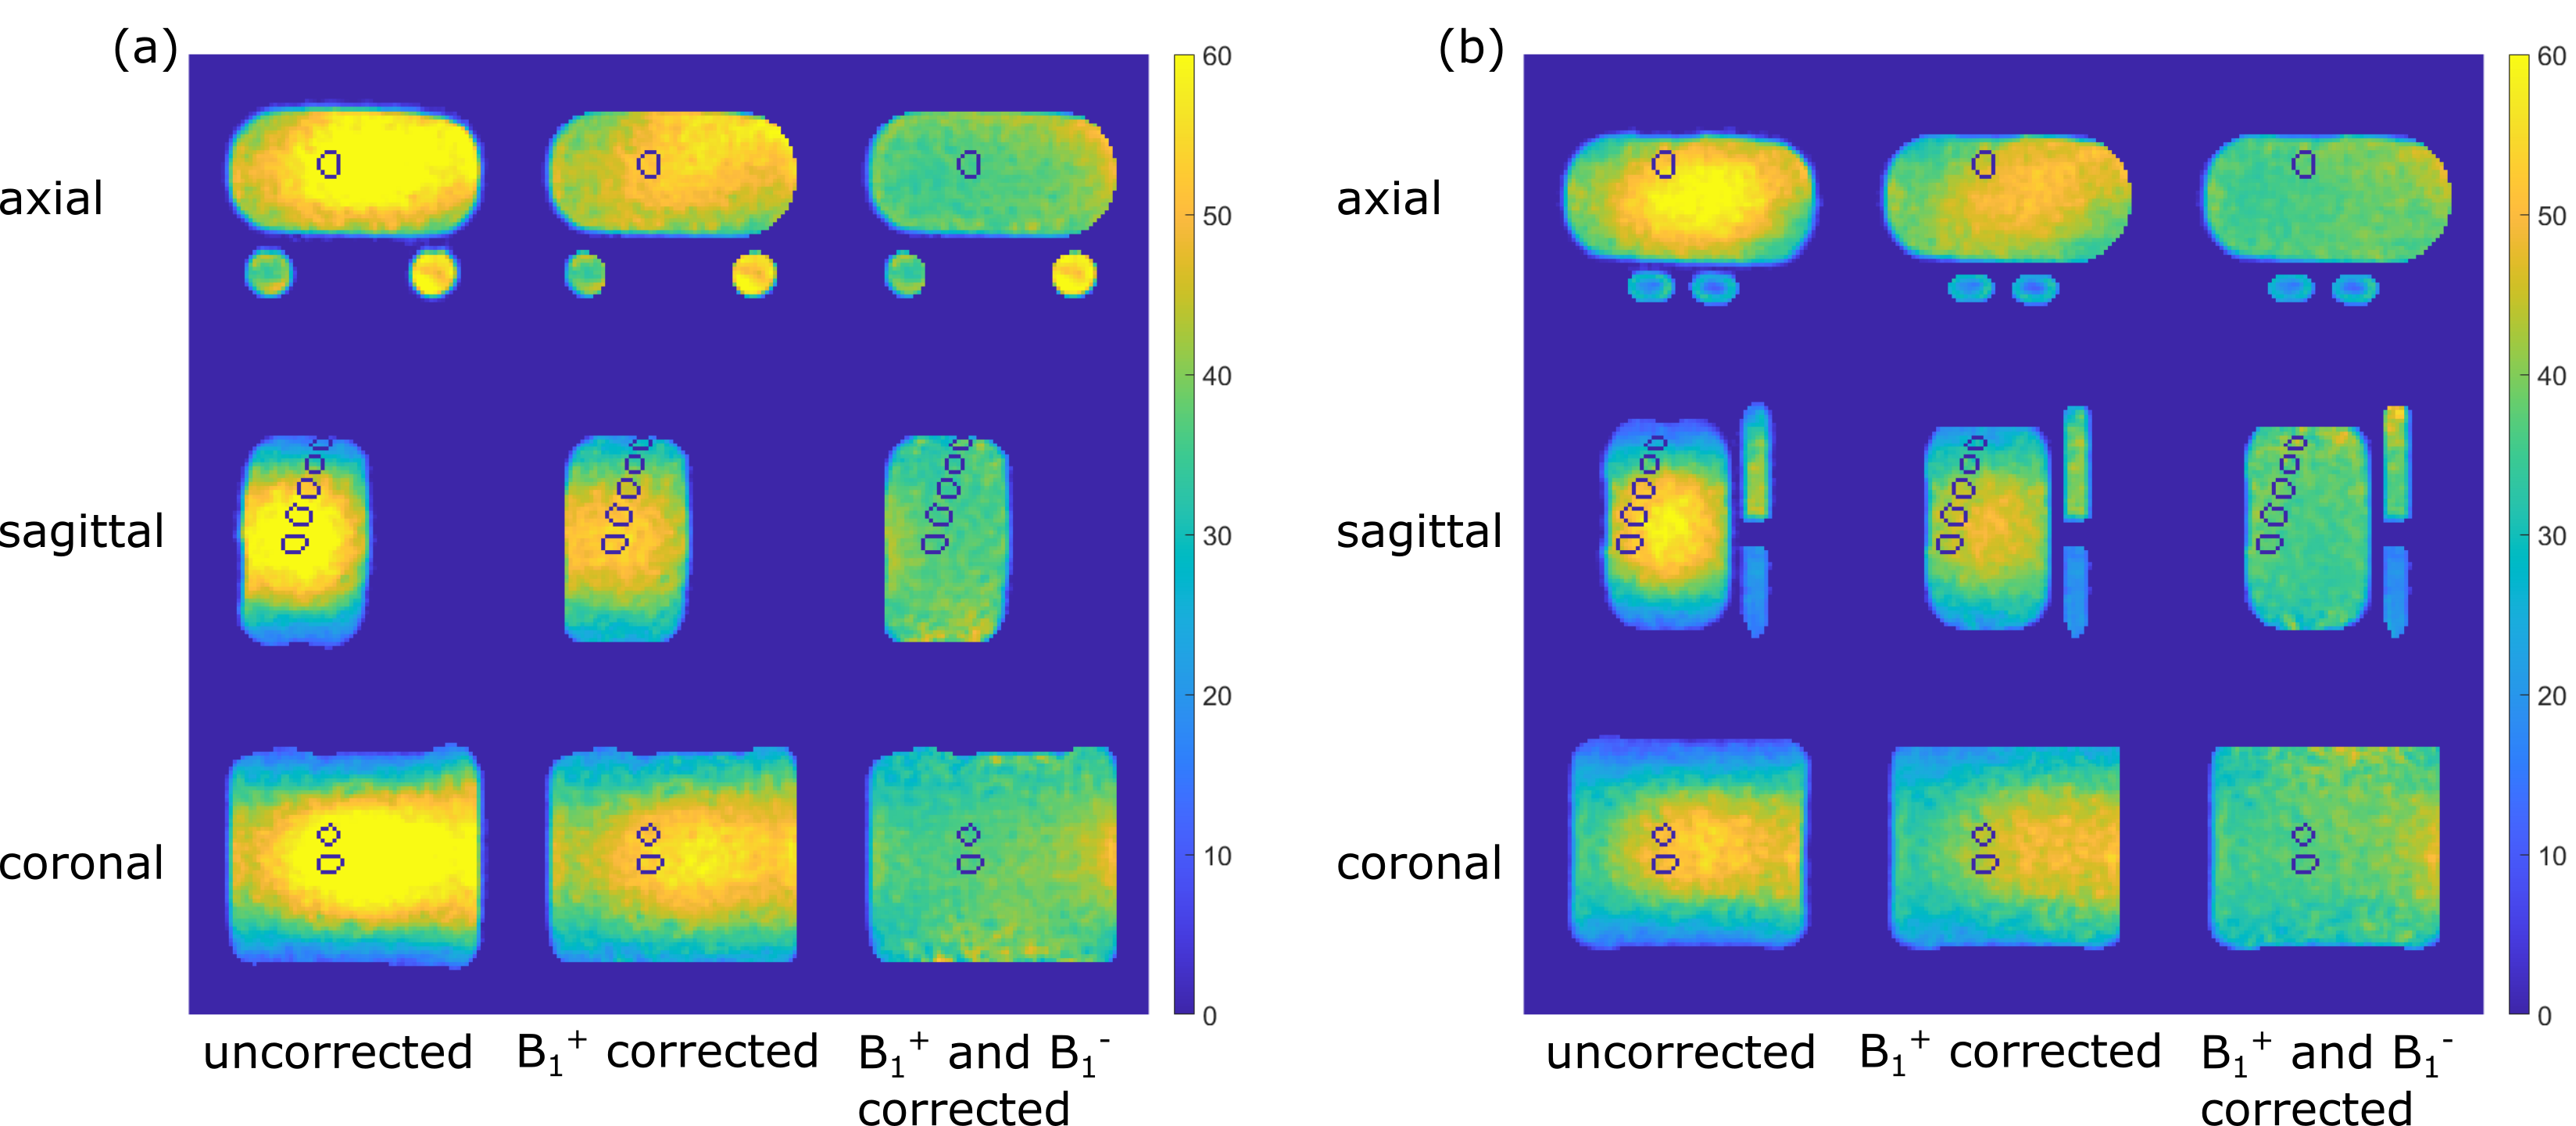
Fig. 2: Phantom data and positioning of the evaluated ROIs in all directions for (a) the initial setup with round vials and (b) the new setup with oval vials. Due to the generally lower positioning of the phantom for the second setup, the evaluated IVD-emulating ROIs are less central and thus slightly further from the ground truth.
Slices in each direction were chosen to have the IVD ROIs of the first measurement of Volunteer One visible.
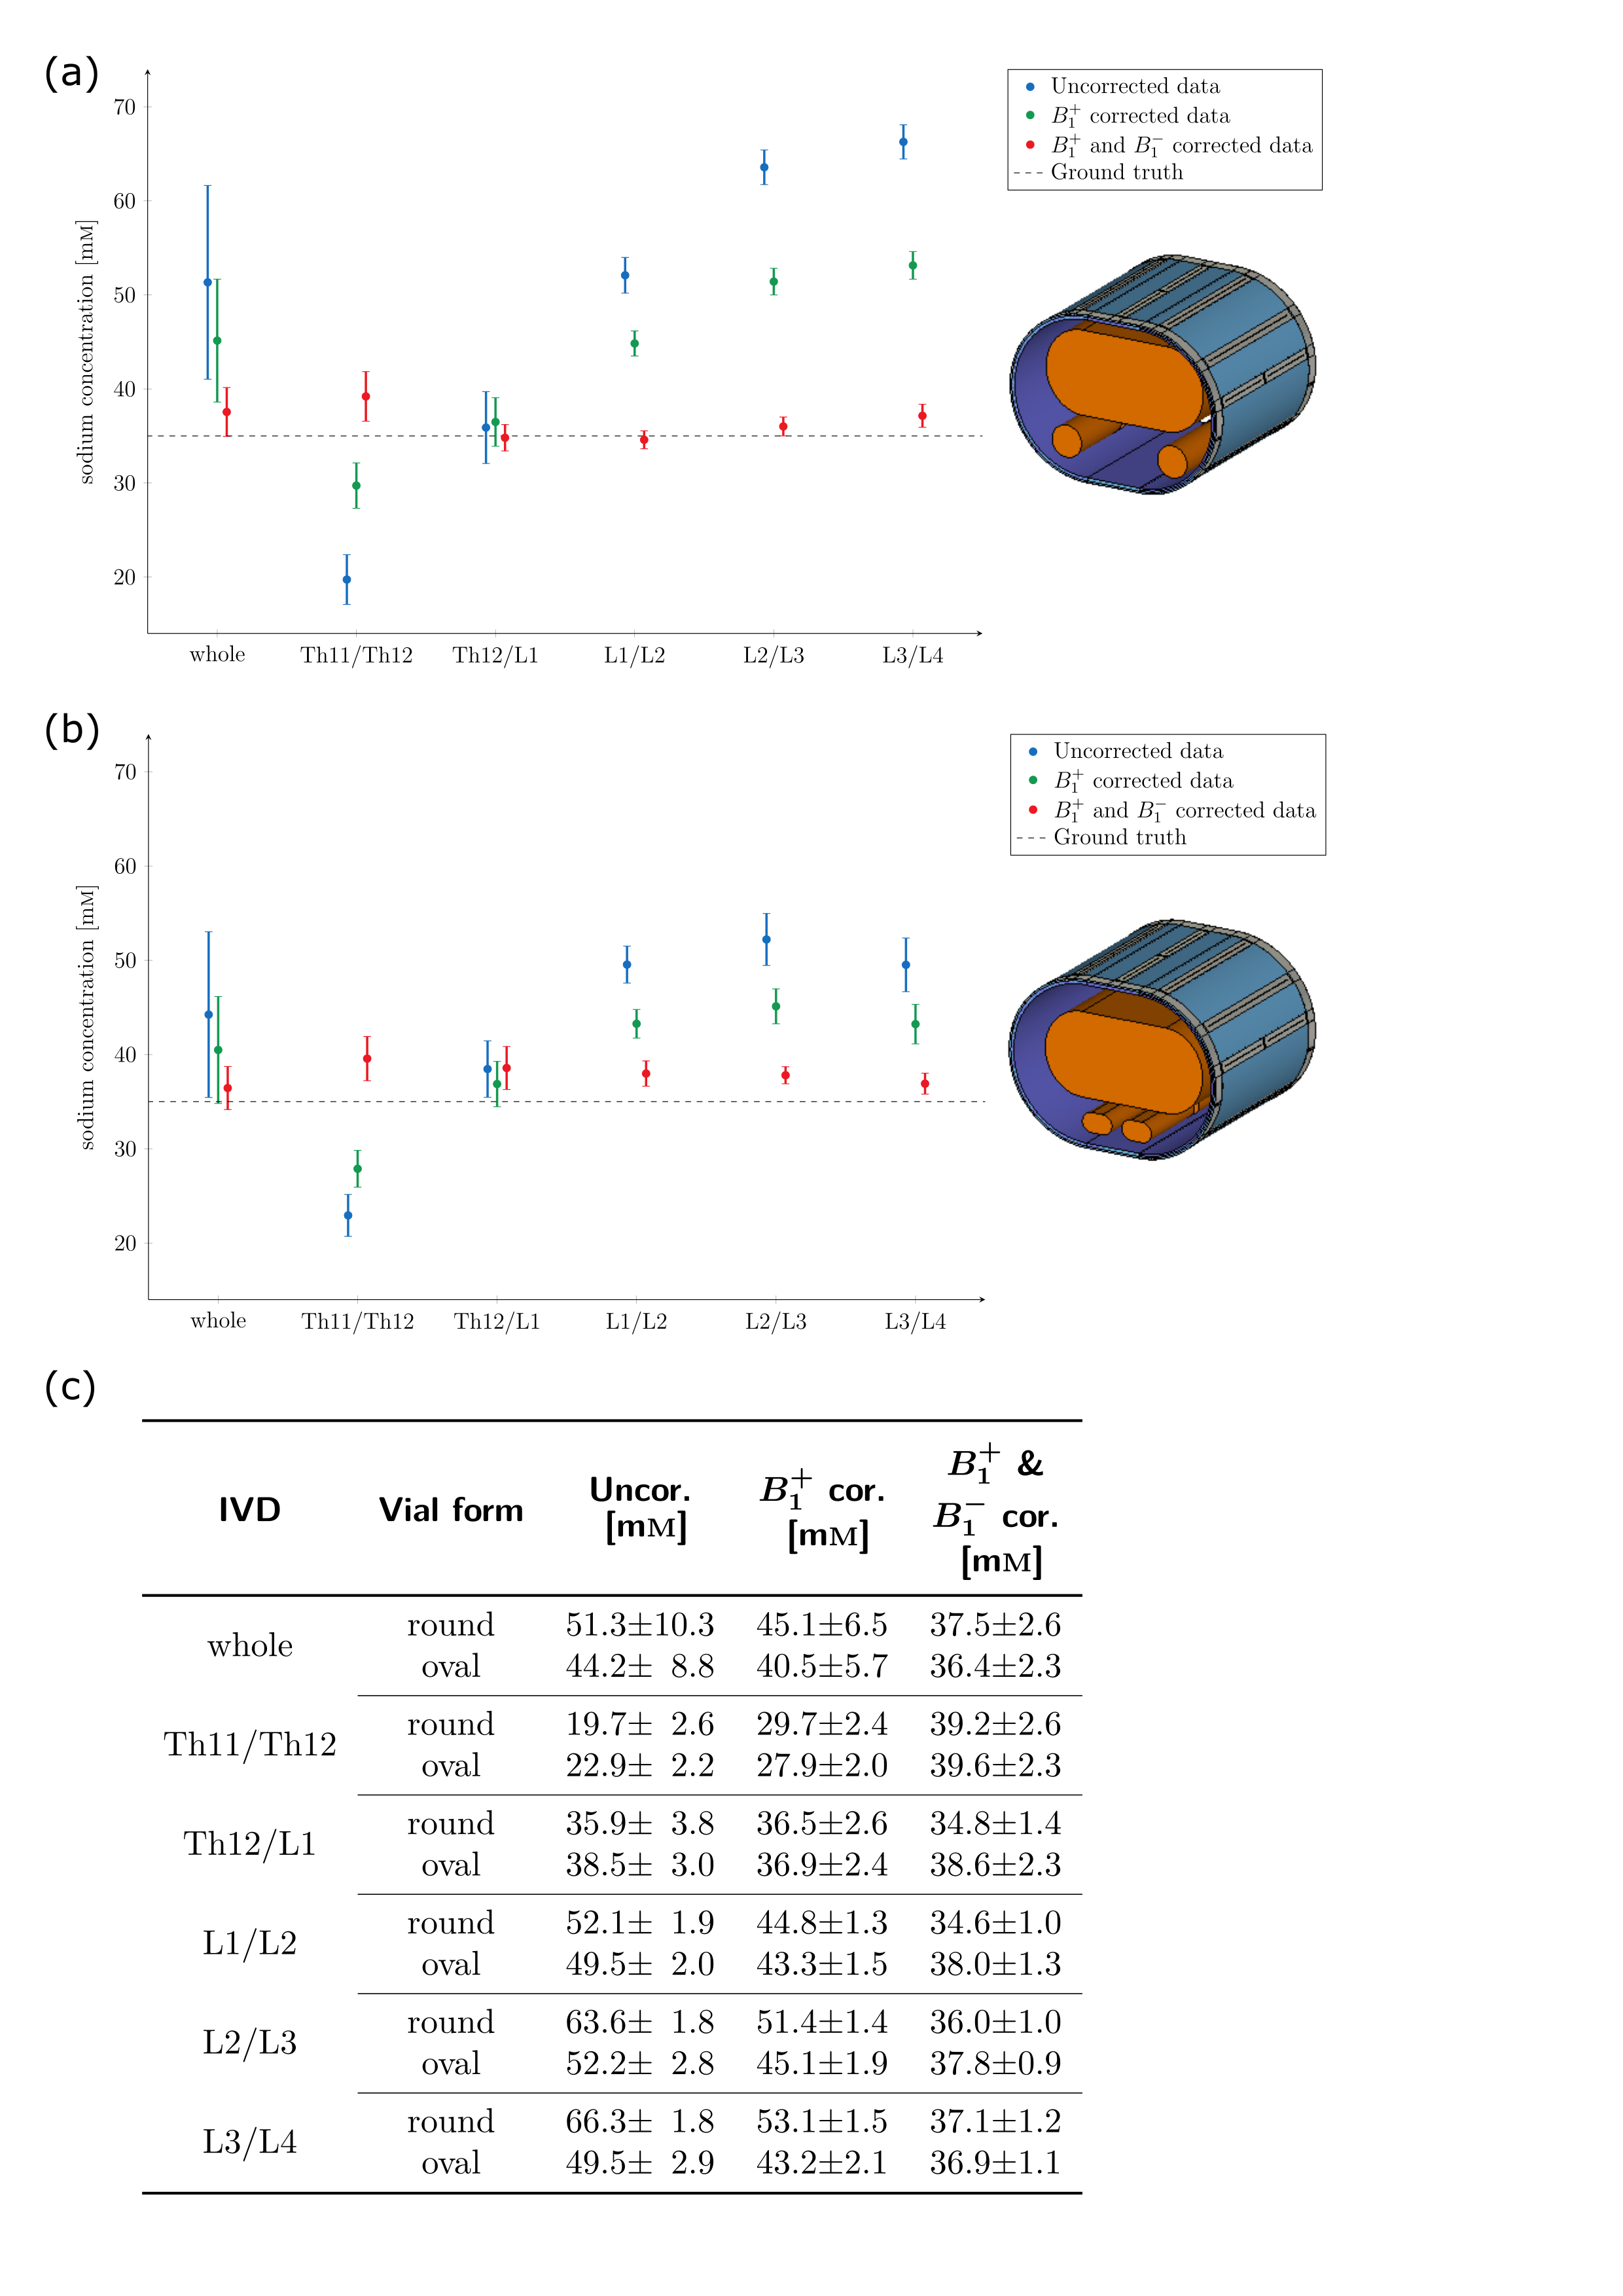
Fig. 3: Comparison of the phantom (35mM) measurements with the (a) round reference vials and the (b) oval reference vials. The concentrations for the data without correction as well as after B1+ field correction (using the measured B1+ map) and after both B1+ field (measured) and B1- field (simulated) correction. The concentration in the whole phantom ROI as well as in the IVD ROIs of the first measurement of Volunteer One are plotted and can also be found in the table in (c).
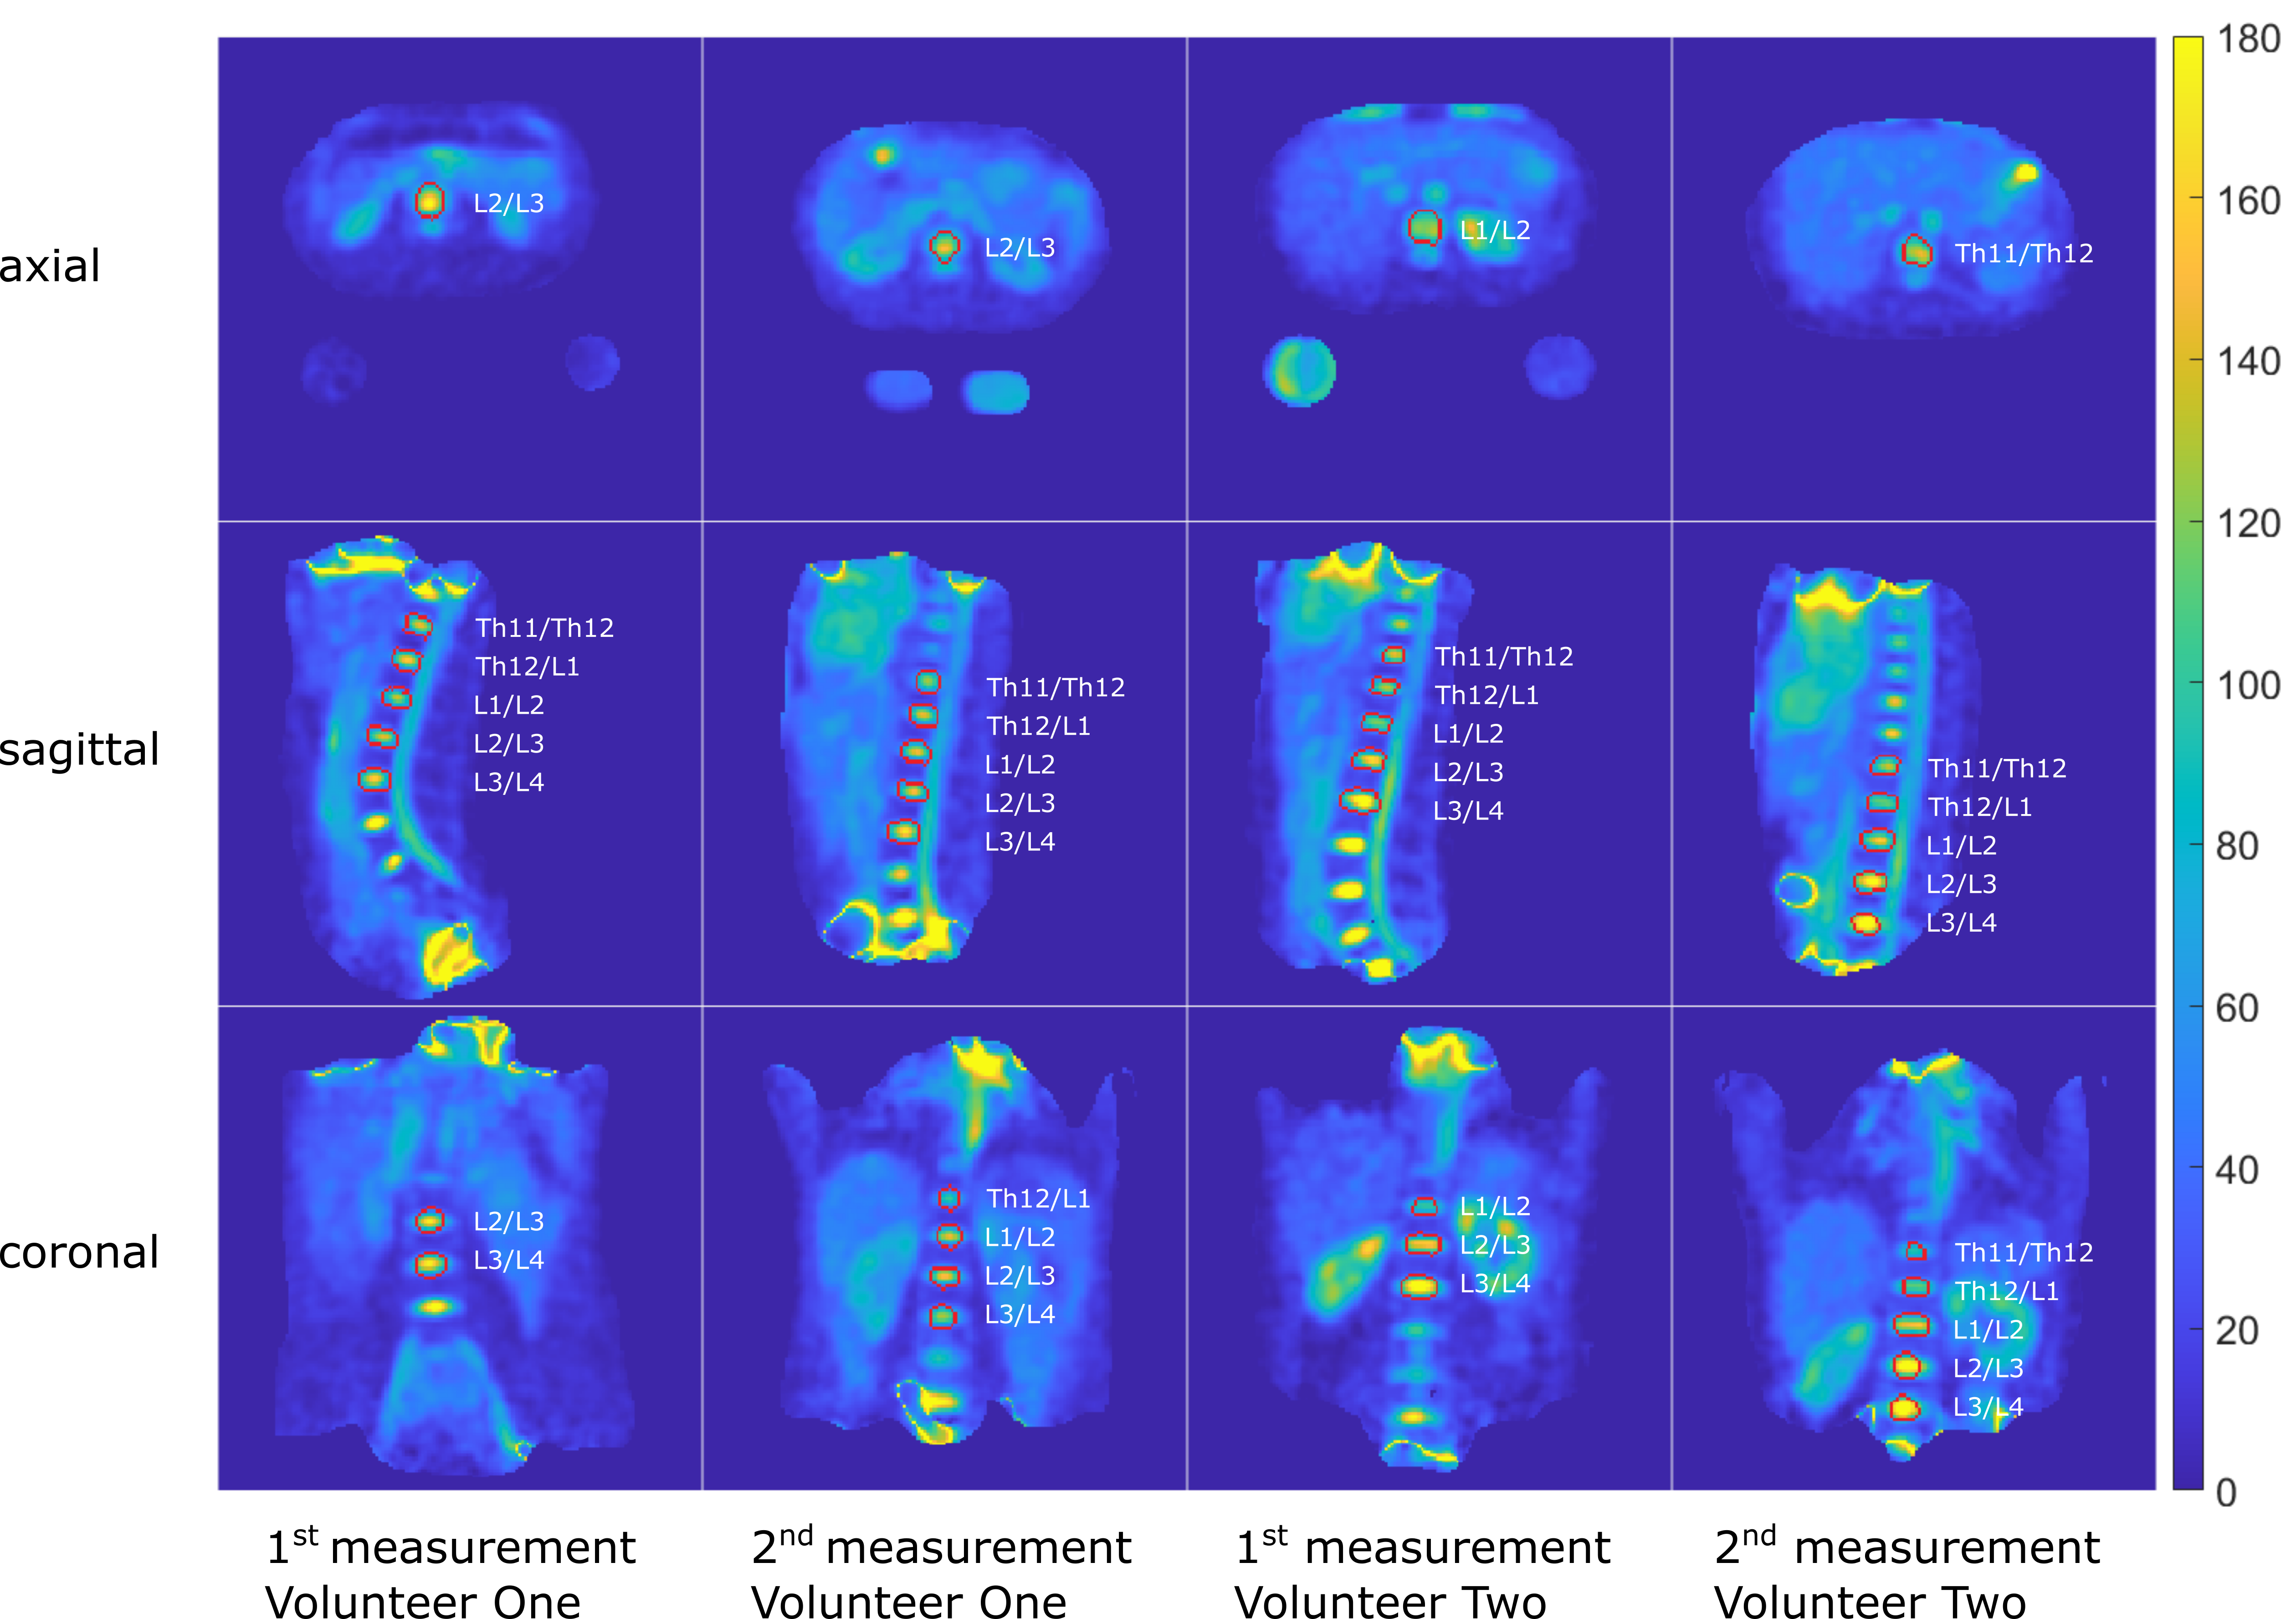
Fig. 4: Quantitative 23Na concentration in the human torso at 7T for two measurements per volunteer. Slices in each direction for each measurement were chosen to have the IVD visible. The evaluated IVD ROIs are bordered in red.
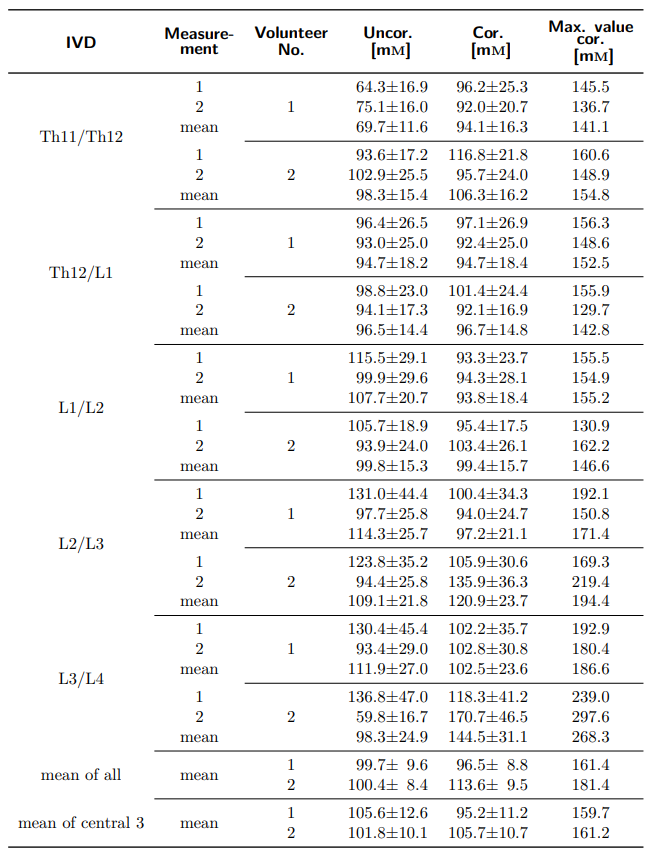
Tab. 1: Comparison of determined concentrations for the evaluated IVDs for two measurements per volunteer for no correction and B1+ and B1- corrected data. The maximum of each evaluated ROI after B1+ and B1- correction is also reported for comparison with a previous abstract15. Measurement 1 was performed with the setup with round reference vials and measurement 2 was performed with the oval reference vials.