1275
Repeatability of simultaneous 3D 1H MRF/23Na MRI in brain at 7T1Center for Biomedical Imaging, Department of Radiology, New York University School of Medicine, New York, NY, United States, 2Vilcek Institute of Graduate Biomedical Sciences, NYU Langone Health, New York, NY, United States, 3Centre for Advanced Imaging, The University of Queensland, Brisbane, Australia, 4ARC Training Centre for Innovation in Biomedical Imaging Technology, The University of Queensland, Brisbane, Australia
Synopsis
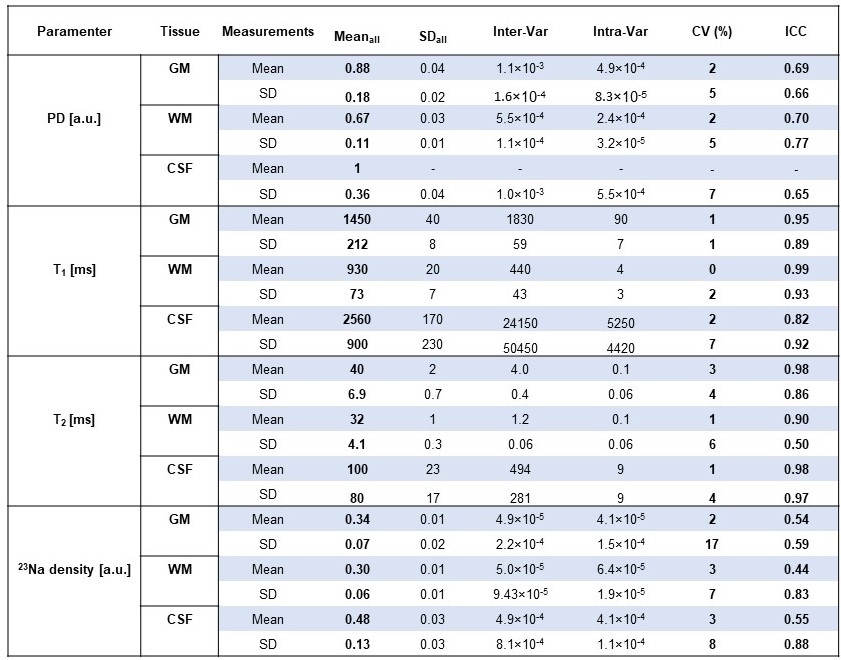
In this work, we assess the repeatability of proton density, T1, T2 and sodium density maps measured with simultaneous 3D 1H MRF/23Na MRI in the brain at 7T. We scanned seven healthy subjects three times each. The coefficients of variation (CV) were in the range 1-3% for mean values in GM, WM and CSF, and the intra-class correlation (ICC) was in range 0.44-0.99.
Introduction
Sodium (23Na) MRI can reveal valuable metabolic information1 to complement structural proton MRI or MR fingerprinting (MRF). A technique to simultaneously acquire 23Na MRI and 1H MRF data was demonstrated recently2, 3. In this work, we assessed the repeatability of proton density (PD), T1, T2 maps simultaneously acquired with a normalized sodium density image using 3D 1H MRF/23Na MRI3 in the brain at 7T.Methods
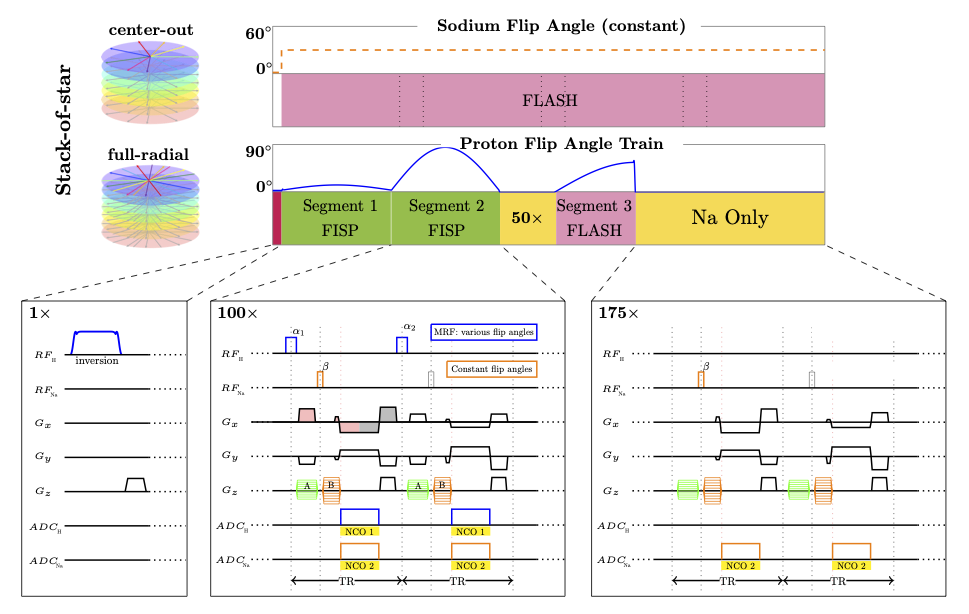
Seven healthy volunteers (3 men, 4 women, mean age=35.7±8.2 years) were scanned three times in two sessions within a week. In the first session, the volunteers were scanned twice, with a short break between the scans. In the second session, the volunteers were scanned once.The simultaneous 3D 1H MRF/23Na MRI sequence3 is based on a stack-of-stars sampling scheme4. Each TR (7.5ms), a non-selective 1H pulse is applied, followed by one simultaneous readout for both nuclei (Fig.1). The images from both nuclei have the same slice thickness. The frequency encoding gradient moments are distributed such that we acquire a full radial trajectory for 1H while acquiring a center-out readout for 23Na, which allows for a factor ~2 between the 23Na and 1H resolutions since the ratio of their gyromagnetic ratios is ~4.
The proton flip angle (FA) train starts with an adiabatic inversion, followed by 275 non-selective excitations of variable FA (Fig. 1). The first segment (TR 1-100) includes FA up to 20°. The second segment (TR 101-200) contains FA up to 90°. A 50-TR delay is inserted to recover magnetization before a 3rd segment (TR 251 ~ 325), with FA train up to 60°. A short delay (TR 326 ~ 500) is then added before the next inversion.
On the sodium side, a non-selective pulse with a constant FA = 30° is applied at every other TR to reduce SAR and obtain a larger effective gradient spoiling moment for sodium (effective TR = 15 ms). The sodium acquisition continues throughout the whole scan without interruption (see Fig. 1).
The 3D simultaneous 1H MRF/23Na MRI sequence parameters were: FOV 240×240×168 mm3, 1H 160×160×56 / 23Na 84×84×56 matrix, 1H 1.5×1.5×3 mm3 / 23Na 2.85×2.85×3 mm3 resolution, 1H TR = 7.5 ms / 23Na TR = 15 ms, 1 slab, 6 shots per slab, total scan time 21 min.
All experiments were performed at 7T (MAGNETOM, Siemens, Erlangen, Germany) in accordance with the relevant institutional and national guidelines for informed consent from the subjects, using a 16-channel-Tx/Rx dual-tuned coil5 developed in-house.
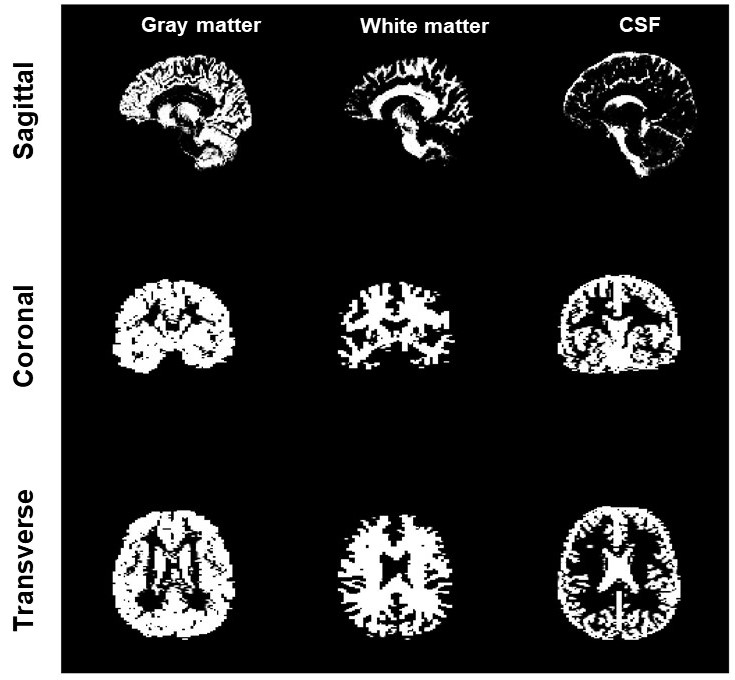
The images were reconstructed offline in MATLAB (Mathworks, Natick, MA, USA). All images from each volunteer were co-registered and segmented in grey matter (GM), white matter (WM), and cerebral spinal fluid (CSF) with SPM 12 (UCL, London, UK)6. Then, we calculated the mean value and standard deviation (SD) of the PD, T1, T2, and 23Na density for each tissue and scan. The PD was normalized by the value of the CSF and the 23Na density by the mean eyes intensity.
For the statistical analysis, we estimated the intra-subject variance (the variance between results from scans of the same subject) and the inter-subject variance (the variance between results from different subjects) of each measure (mean and SD). Then, we computed the coefficient of variation7 (CV) as the square root of the intra-subject variance (intra-var) expressed as percentage of the mean, and the intra-class correlation8 (ICC) as the inter-subject variance (inter-var) divided by the sum of the intra and inter variances. The CV is considered an indicator of the utility of a measure for detecting within-subject changes over time. An ideal set of measurements has a CV equal to 0%. The ICC is a measure of the repeatability of the method, it has values between 0 and 1, where higher values are associated with more repeatable measurements.
Results & Discussion
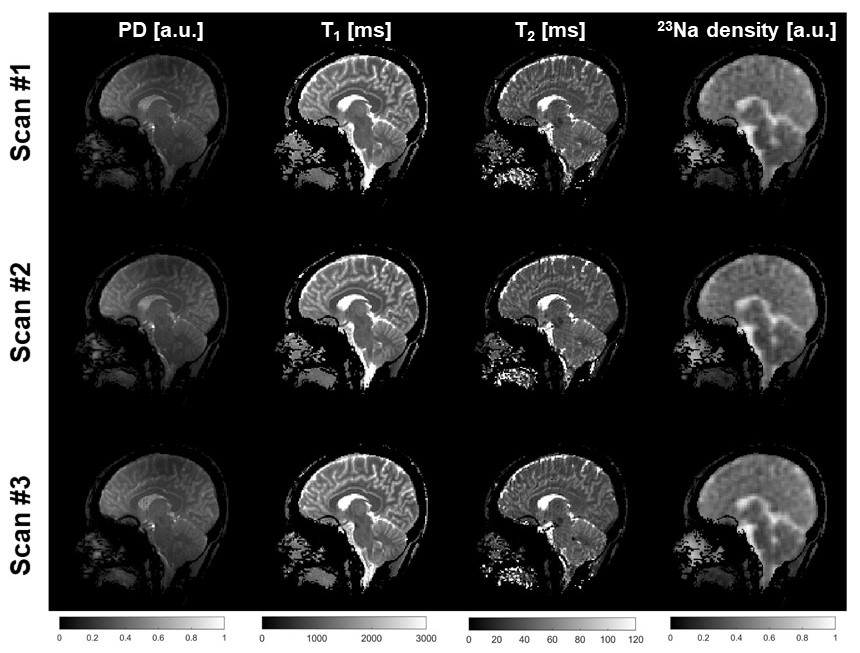
Fig. 2 shows the 1H maps and 23Na images from the 3 scans of subject 1 and Fig. 3 shows the brain segmentation for subject 1. Finally, Table 1 summarizes the results of the statistical analysis.The CV was lower than 10% in 23 of the 24 statistical results (mean and SD of all 4 measurements in 3 brain regions). The ICC was higher than 0.8 for 11 of the 12 T1 and T2 measurements, in the range of 0.65 and 0.77 for the PD measurements and in the range of 0.44 and 0.88 for the 6 23Na density. Hence, the method is highly repeatable for T1 and T2 measurements, while it is less robust for PD and 23Na density. This can be due to T1 and T2 were calculated from a dictionary, making these measurements more robust under noisy conditions9, while PD and sodium density relied on local normalization for each scan (which make these maps more sensitive to B0 and B1 inhomogeneities).
Conclusion
In this work, we assessed the repeatability of PD, T1, T2, and 23Na density measured from simultaneous 3D 1H MRF/23Na MRI acquisition over 21 scans of 7 different subjects in the brain at 7T. The overall repeatability was good, where the estimated CV were lower than 10% for 23 of the 24 statistical results and the ICC higher than 0.6 in 20 of the 24 statistical results.Acknowledgements
The research reported in this publication was supported by the NIH/NIBIB grant R01 EB026456, and performed under the rubric of the Center for Advanced Imaging Innovation and Research, a NIBIB Biomedical Technology Resource Center (P41 EB017183).References
1. Madelin G, & Regatte R R. Biomedical applications of sodium MRI in vivo. Journal of Magnetic Resonance Imaging, 2013;38:511-529.
2. Yu, Z., Madelin, G., Sodickson, D. K., & Cloos, M. A. Simultaneous proton magnetic resonance fingerprinting and sodium MRI. Mag. Res. in Med. ,2020, 83(6), 2232-2242.
3. Yu, Z., Dergahyova, O., Sodickson, D. K., Madelin, G., & Cloos, M. A. Optimized simultaneous 3D proton MRF and sodium MRI. 2021 ISMRM&SMRT virtual conference & exhibition.
4. Block KT, Chandarana H, Milla S, et al. Towards Routine Clinical Use of Radial Stack-of-Stars 3D Gradient-Echo Sequences for Reducing Motion Sensitivity. J Korean Soc Magn Reson Med. 2014;18(2):87-106. doi:10.13104/jksmrm.2014.18.2.
5. Wang, B, Zhang, B., Yu, Z., Ianniello C., Lakshmanan K., Paska, J., Madelin, G., Cloos, M. & Brown, R.. A radially interleaved sodium and proton coil array for brain MRI at 7T. NMR Biomed. 2021, e4608.
6. Ashburner J, Barnes G, Chen CC, Daunizeau J, Flandin G, et al., SPM12 Manual The FIL Methods Group (and honorary members), 2015.
7. Brown C.E., Coefficient of Variation. In: Applied Multivariate Statistics in Geohydrology and Related Sciences. Springer, Berlin, Heidelberg.1998.
8. Wolak M, Fairbairn D, Paulsen Y, Guidelines for estimating repeatability, Methods Ecol Evol 2012, 3 (1): 129–137.
9. Ma D, Gulani V, Seiberlich N, Liu K, Sunshine J, Duerk J & Griswold M, Magnetic resonance fingerprinting, 2013, 495 187-193.
Figures