1274
Correction of CSF Partial Volume Bias in 23Na Magnetic Resonance Fingerprinting1Medical Physics in Radiology, German Cancer Research Center (DKFZ), Heidelberg, Germany, 2Center for Biomedical Imaging, New York University, New York, NY, United States, 3Center for Advanced Imaging Innovation and Research, New York University, New York, NY, United States, 4Physikalisch Technische Bundesanstalt (PTB), Braunschweig and Berlin, Germany, 5Institute of Radiology, University Hospital Erlangen, Friedrich-Alexander-Universität Erlangen Nürnberg (FAU), Erlangen, Germany
Synopsis
This work investigates the bias in the quantified relaxation times due to partial volume contributions of CSF for 23Na magnetic resonance fingerprinting (MRF) and reference methods. In simulations, a CSF contribution of only 10% resulted in an overestimation of 17% (31%) in T2l* in brain tissue for MRF (the reference). Further, a simple approach for CSF bias correction for 23Na MRF is proposed. This reduced the average absolute T1 deviation in brain tissue from 15% to 4%. The deviation in T2l* (T2s*) was reduced from 17% (35%) to 9% (5%). Finally, the correction was applied to in vivo MRF data.
Introduction
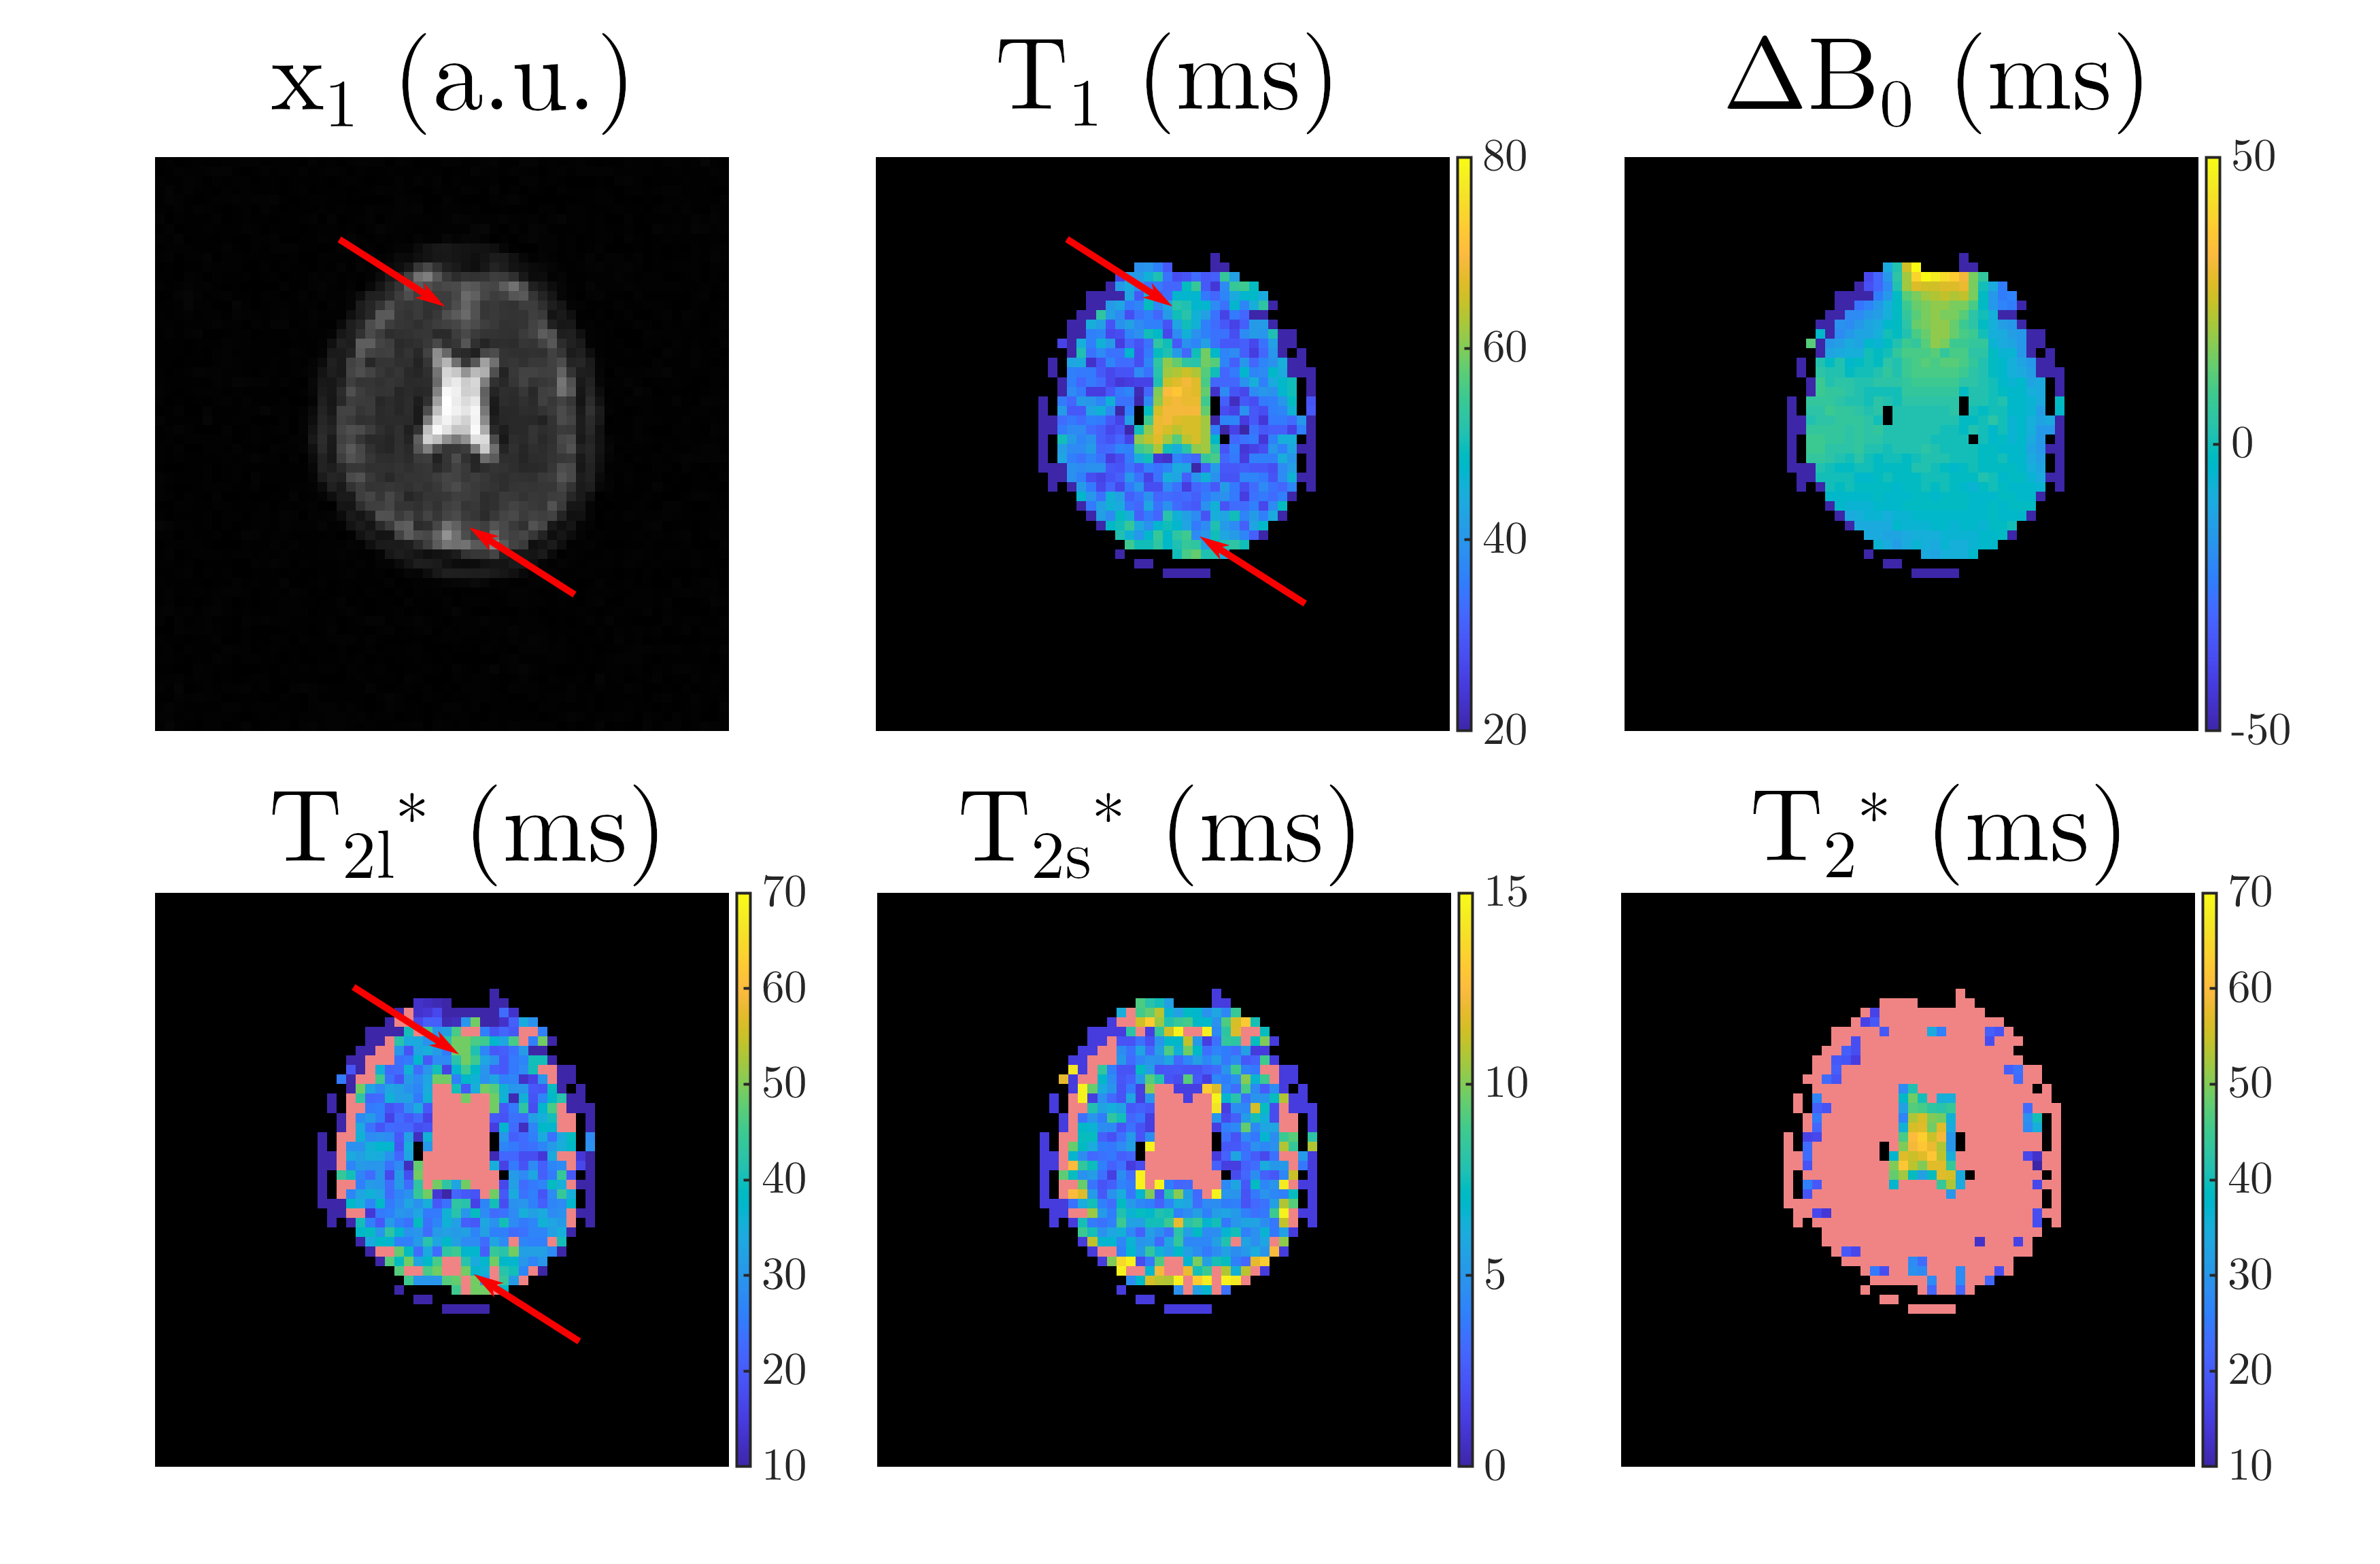
Sodium (23Na) relaxation times were found to be altered in several diseases1-3, which motivates 23Na MR relaxometry. We recently proposed using magnetic resonance fingerprinting (MRF) for simultaneous mapping of T1, T2l*, T2s*, T2* and ΔB04. However, the large voxel volumes commonly applied in 23Na MRI make partial volume (PV) effects likely to occur. Especially at the borders between brain tissue and cerebrospinal fluid (CSF), a bias in the quantified tissue parameters due to CSF signal contributions is expected. As an example, Figure 1 shows the brain relaxation parameter maps obtained with 23Na MRF in a healthy volunteer. Red arrows indicate areas where a bias of the quantified parameters due to CSF contributions appears to be especially likely.Hence, the aim of this work was to investigate how potential CSF contributions alter the quantified relaxation times for the MRF framework and reference methods.
Further, an approach for CSF bias correction in the MRF framework is proposed.
Methods
A simulation study was conducted to estimate the parameter bias in the MRF framework introduced by the presence of CSF. Here, a WM-simulating fingerprint (T1=40ms,T2l*=30ms,T2s*=4.8ms) was combined with a CSF fingerprint (T1=60ms,T2*=T2l*=T2s*=50ms) with varying weights (1%-100%; 1% steps). The apparent relaxation parameters were then reconstructed by matching the signals to the dictionary. Since the dictionary contains parameter combinations with bi- and monoexponential transverse relaxation, this approach intrinsically determines the relaxation model that better matches the data.As a reference, similar simulations were performed for an inversion recovery (IR) and an FID signal curve. The theoretical signal evolutions were calculated via
$$S(TE)=0.6exp(-TE/T_{2s}^*)+0.4exp(-TE/T_{2l}^*) [1]$$
and
$$S(TI)=1-2exp(-TI/T_1). [2]$$
Here, 20 TI (TE) samples were equidistantly distributed between 5ms (0.5ms) and 250ms (50ms). Again, the signal evolutions of CSF and WM were summed with varying weight. Next, the relaxation models [1] and [2] were fitted to the data. For transverse relaxation, both a bi- and a monoexponential relaxation model were applied and the differentiation was based on the goodness of the fit R2. Here, T2s* (T2l*) was constrained to a range of 1ms (10ms) to 20ms (90ms).
Next, a PV correction (PVC) was implemented to decrease the CSF bias in the MRF results as inspired by5,6, applicable to both simulations and measurements: First, temporary MRF results are reconstructed4,7 and the relaxation parameters of CSF are determined in the center of the ventricles. In the simulations, the CSF parameters are input parameters and therefore known. Next, the following procedure is performed in all biexponential (tissue dominated) voxels:
1. Extract ΔB0 from the temporary MRF results
2. Construct sub-dictionary containing all entries with this ΔB0 value
3. Identify the dictionary entry with the CSF relaxation parameters
4. Add the CSF fingerprint with varying weight (0%-100%; 5% steps) to each dictionary entry
5. Normalize each entry using the L2-norm
6. Find the best match within the new dictionary.
This approach was tested in the PV simulation data for the noiseless case. Next, 30 simulations were conducted in the presence of complex Gaussian noise and the resulting parameters were averaged. The noise level was adjusted such that the standard deviation in T1 of 100 WM simulations was approximately 10% of the input T1.
Finally, the CSF correction was applied to the in vivo data shown in Figure 1.
Results
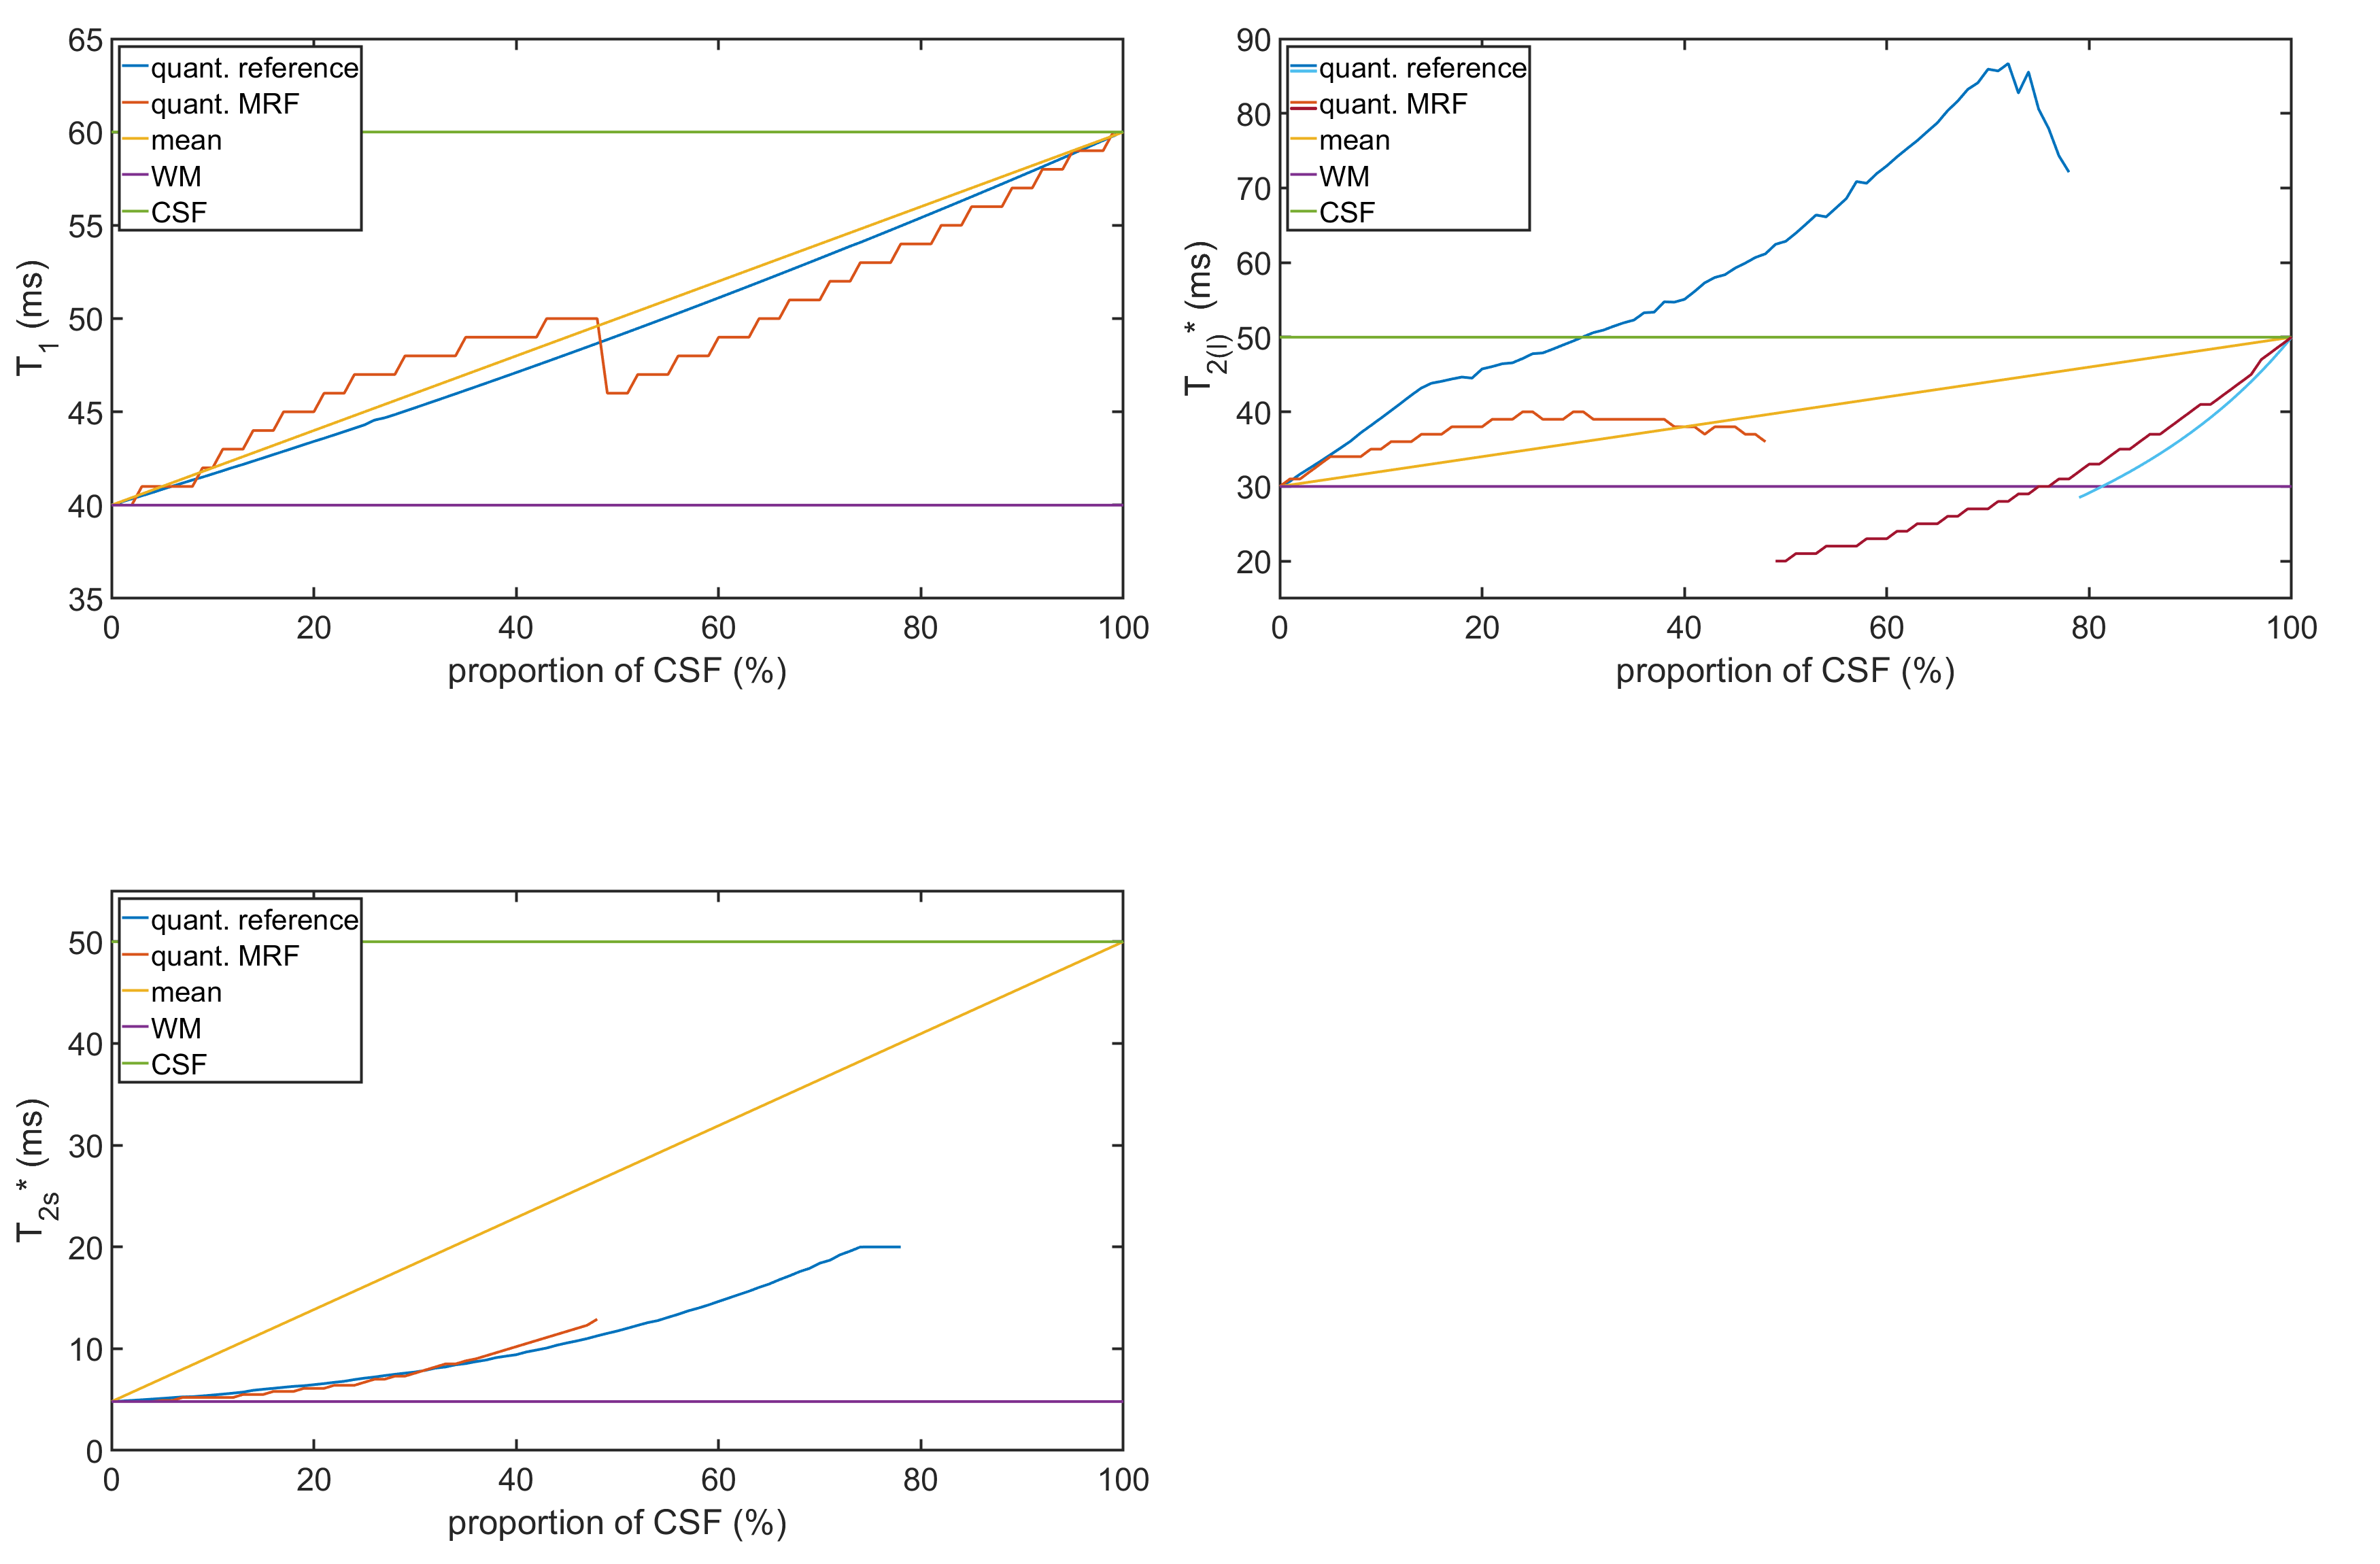
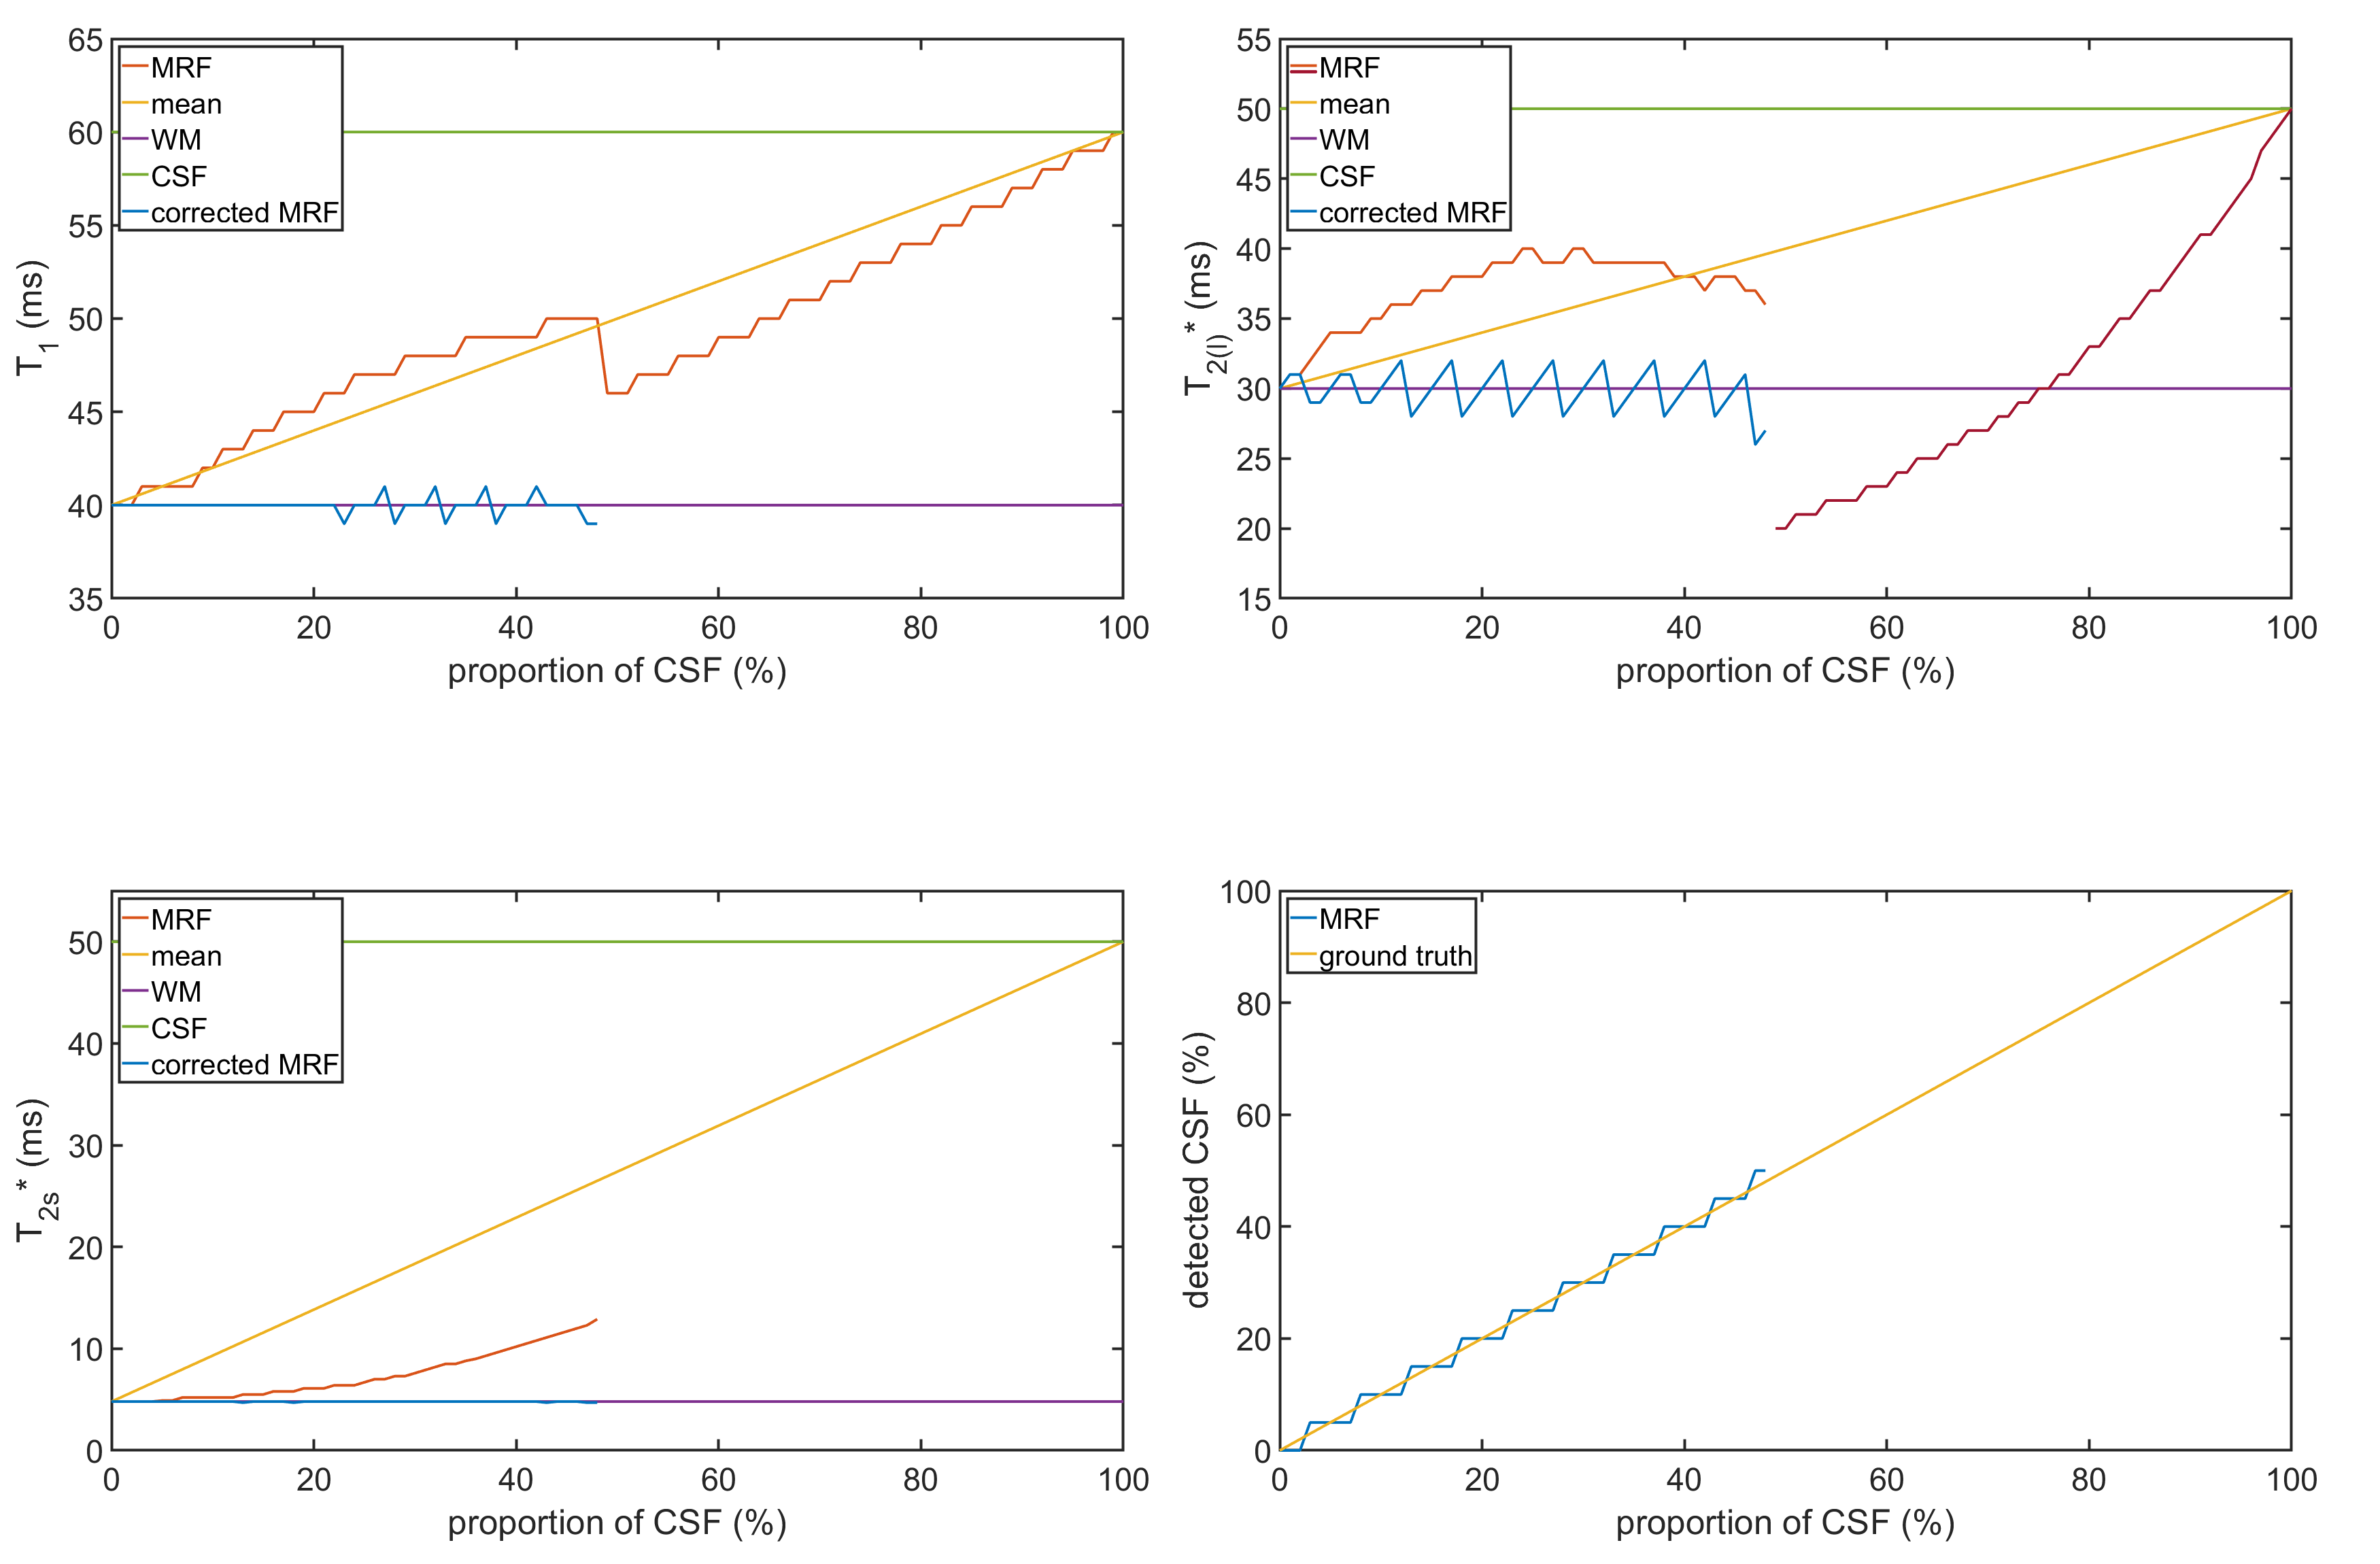
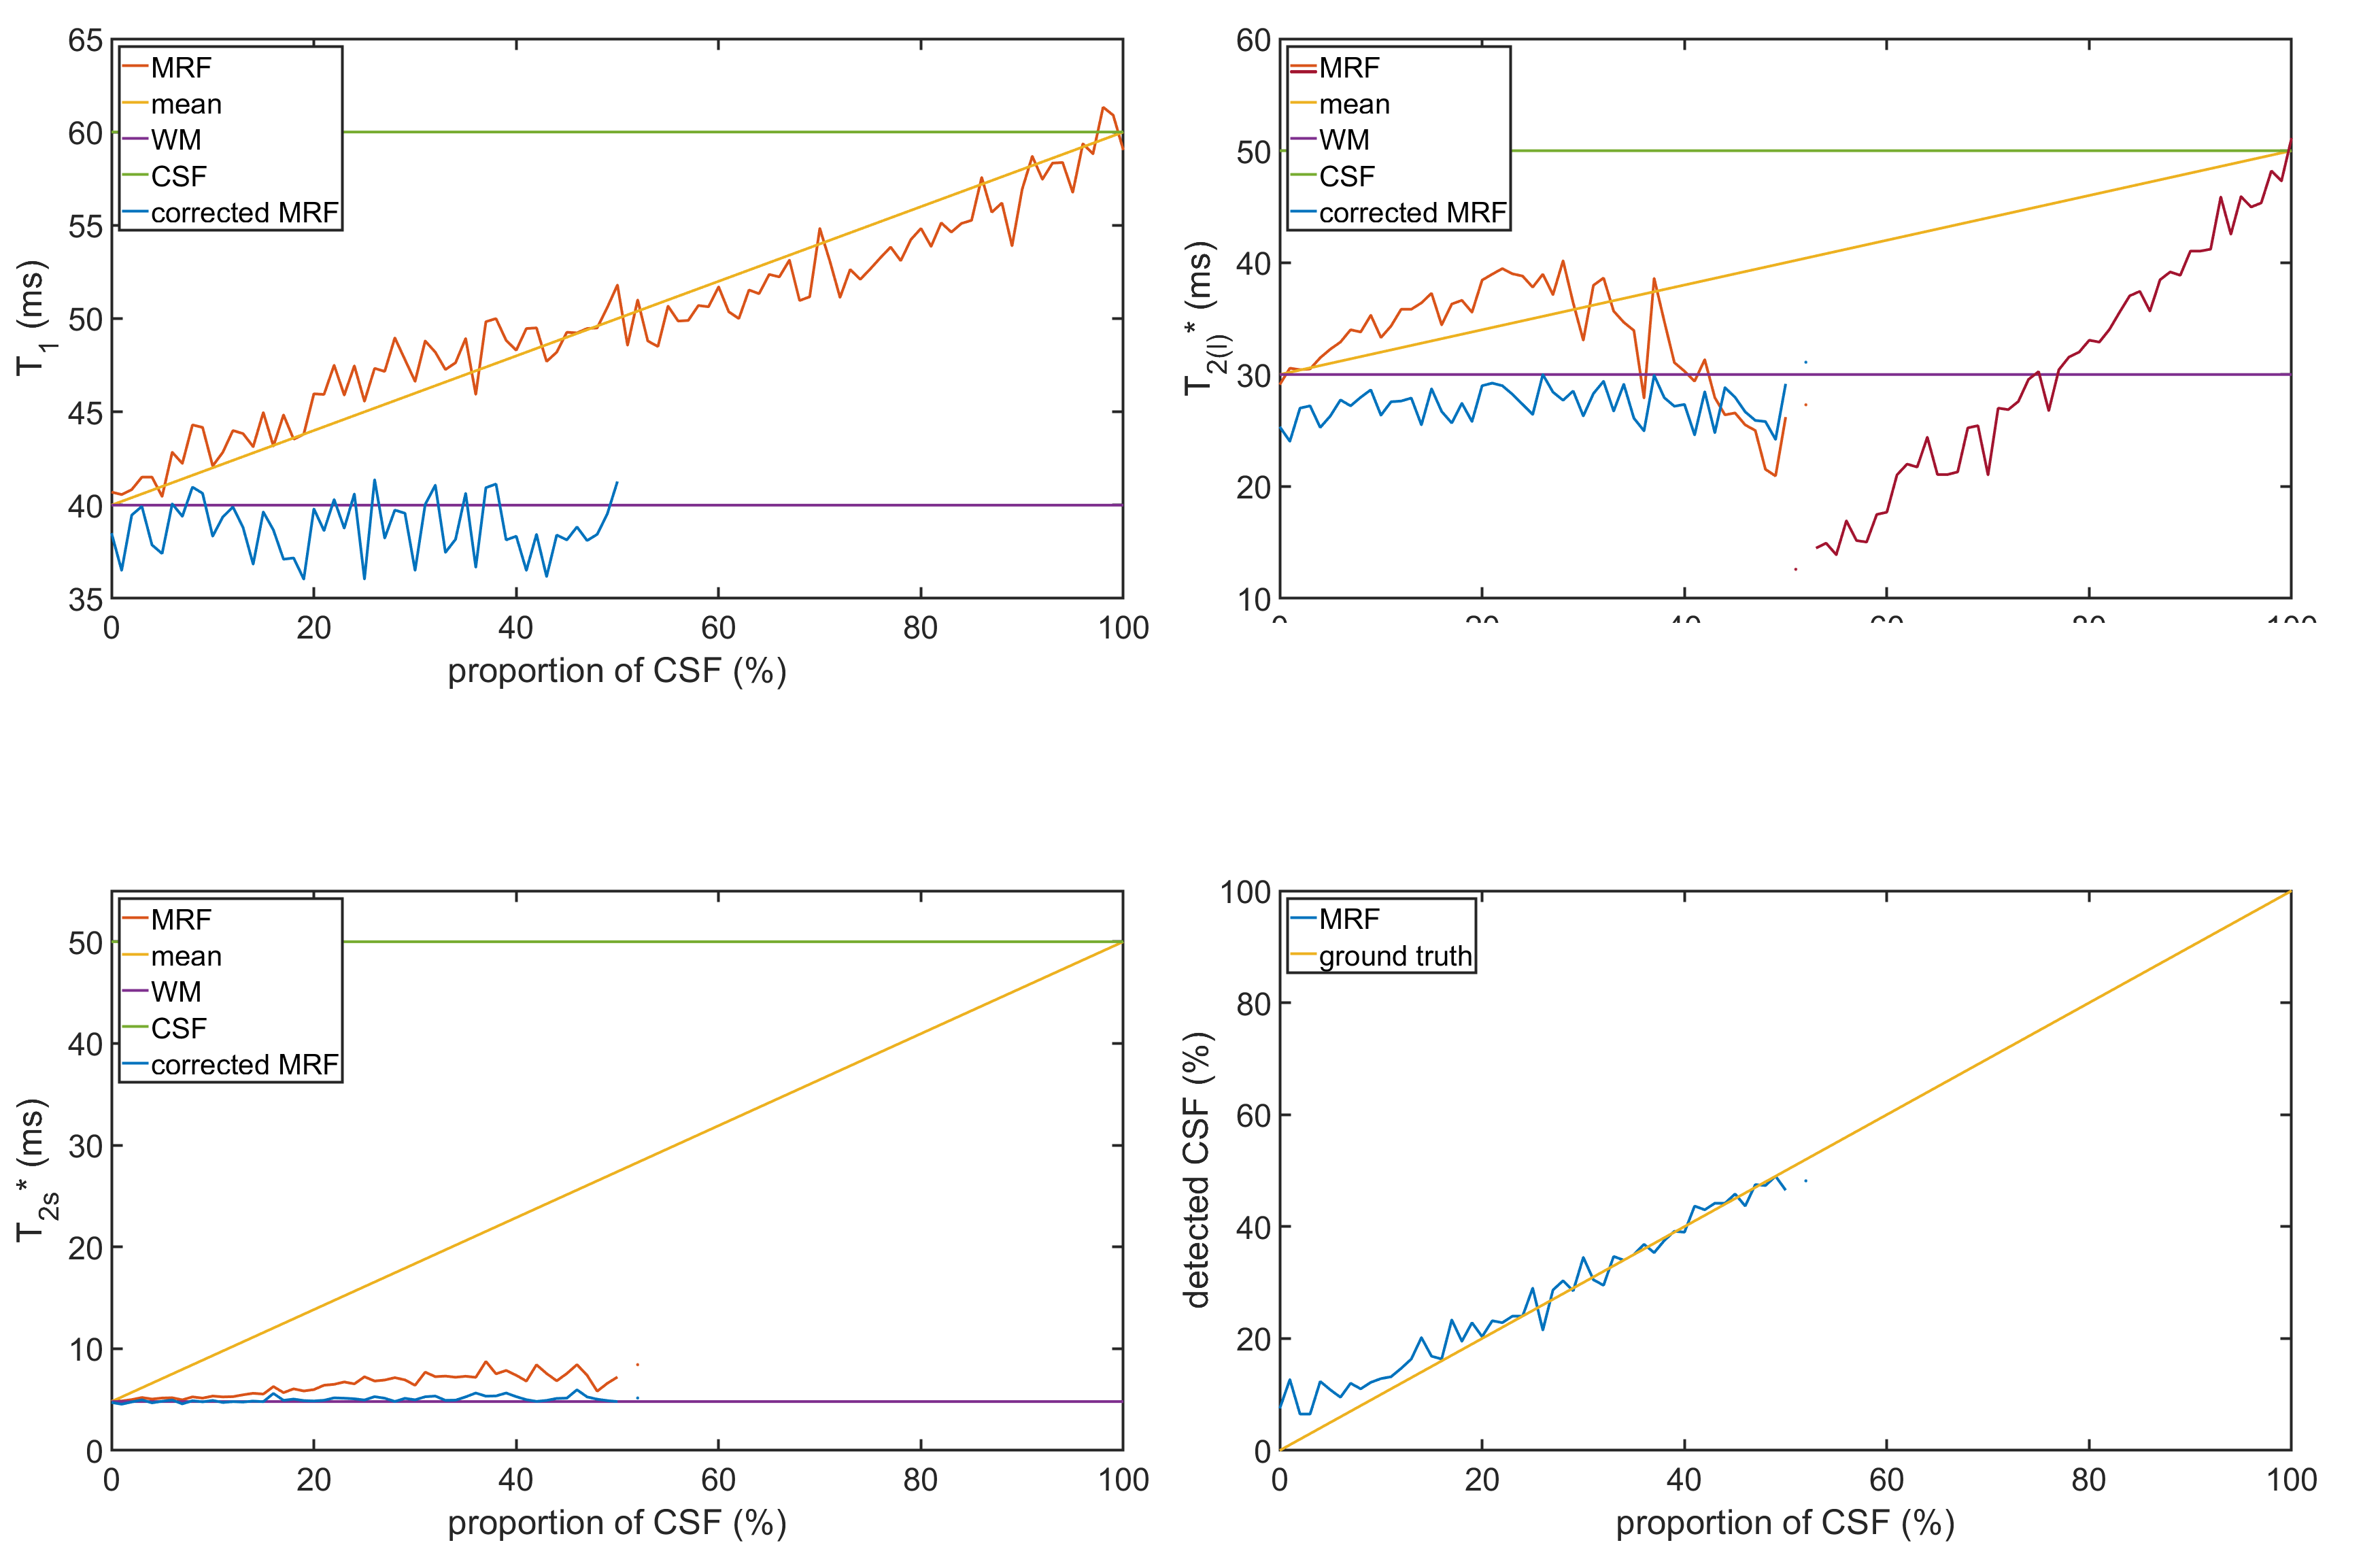
The reconstructed relaxation parameters from the noise-free PV simulations are illustrated in Figure 2. The MRF approach detected a biexponential relaxation for 0%-48% CSF contribution and a monoexponential decay otherwise. The reference FID determined biexponential relaxation for CSF contributions up to 78%. For 10% and 20% CSF, MRF overestimated T2l* by 17% and 27% with respect to the WM input, whereas the reference deviated by 31% and 53%. For CSF contributions above 30%, the reference determined T2l* values larger than both T2,CSF* and T2l,WM*. In T2s*, MRF found deviations of 8% and 27% for 10% and 20% CSF, whereas the reference deviated by 13% and 35%.The results of the noise-free MRF simulation after PVC are illustrated in Figure 3. The input parameters of WM were well recovered with a maximal deviation of 1ms in T1, -4ms in T2l* and 0.1ms in T2s*. In presence of noise (Figure 4), the average absolute difference in the uncorrected T1 was 15%, while the corrected T1 differed by 4%. For the T2l*, the uncorrected (corrected) deviation was 17% (9%) and for T2s* a deviation of 35% (5%) was found.
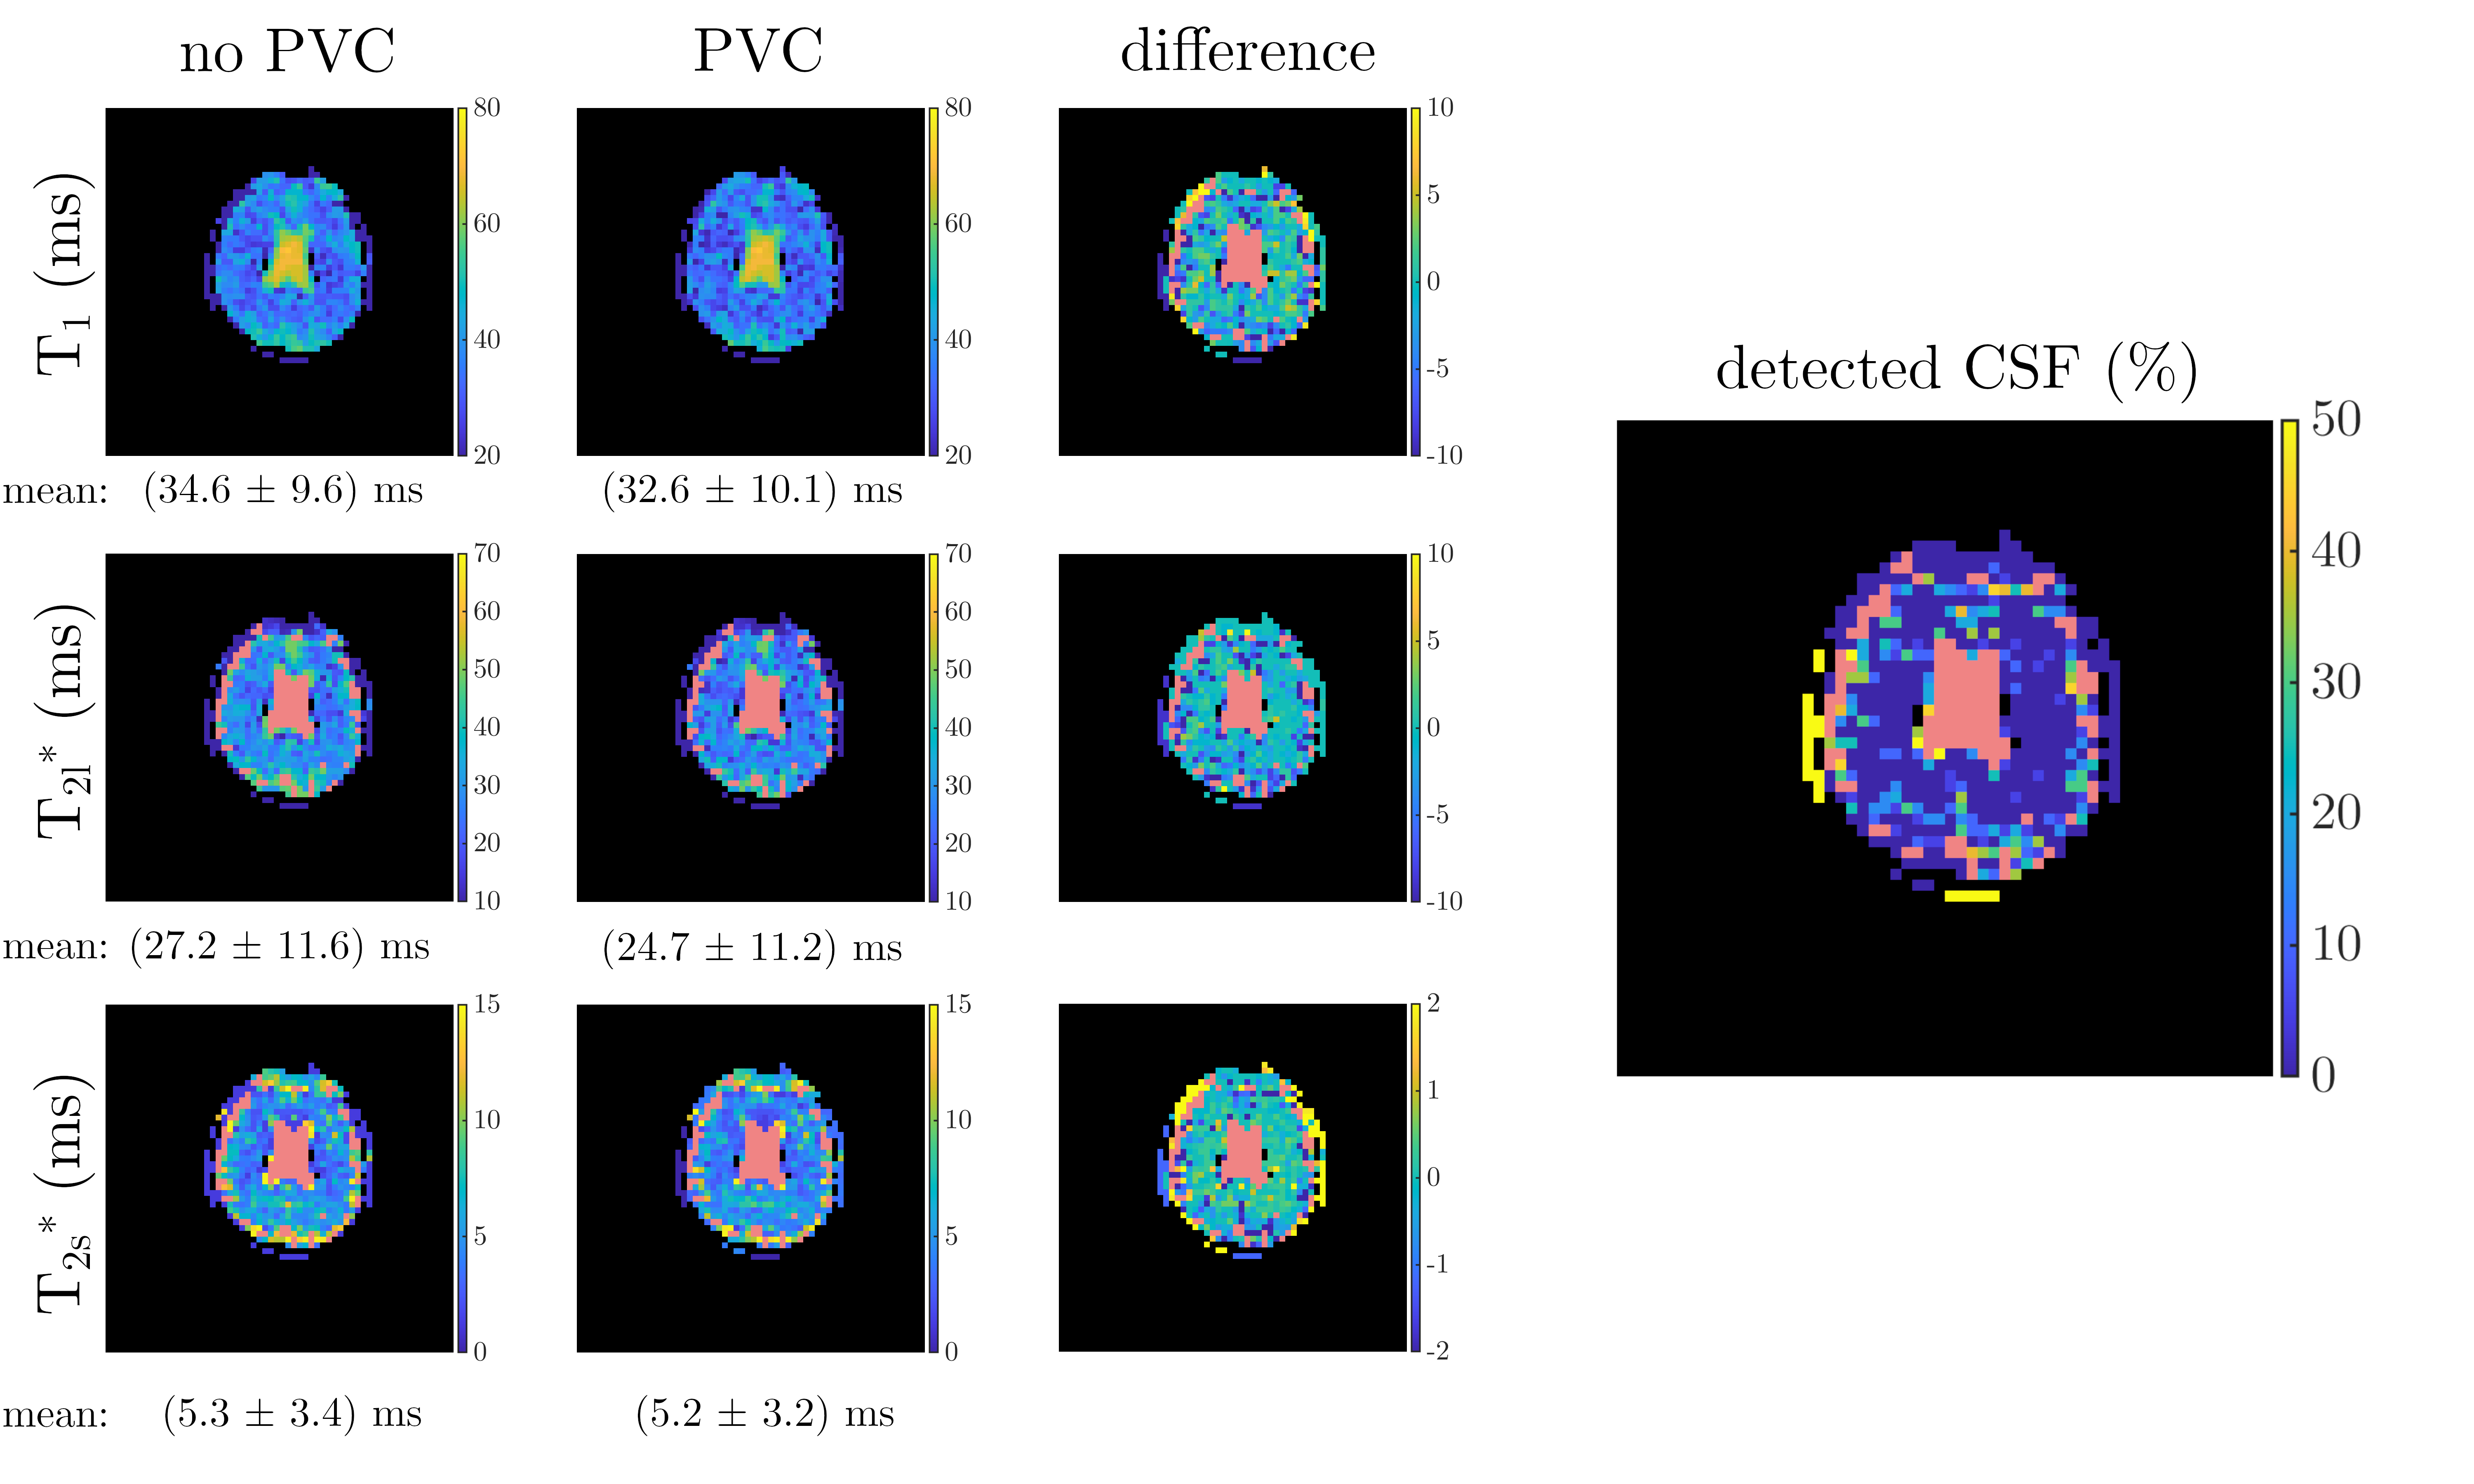
The results of the PV-corrected in vivo measurement are shown in Figure 5, where all relaxometric parameters in brain tissue were reduced after PVC.
Discussion and Conclusion
The findings of this work suggest that PV contributions of CSF can lead to a high bias in relaxometric parameters and that a PVC might be useful in 23Na relaxometric measurements.We propose a simple approach to correct for CSF bias that could be applied similarly to IR and FID techniques. However, this approach allows only correction for CSF contributions as the separation of arbitrary tissues is computationally much more expensive and might require higher SNR6.
Nevertheless, in simulations the PVC reduced the CSF bias in brain tissue parameters in all cases and lowered the quantified relaxation times in the in vivo measurement as expected.
Acknowledgements
References
1. Kline RP, Wu EX, Petrylak DP, Szabolcs M, Alderson PO,
Weisfeldt ML, Cannon P, Katz J. Rapid in vivo monitoring of chemotherapeutic
response using weighted sodium magnetic resonance imaging. Clin Cancer Res
2000;6(6):2146-2156.
2. Nagel AM, Bock M, Hartmann C, Gerigk L, Neumann JO, Weber MA, Bendszus M, Radbruch A, Wick W, Schlemmer HP, Semmler W, Biller A. The potential of relaxation-weighted sodium magnetic resonance imaging as demonstrated on brain tumors. Invest Radiol 2011;46(9):539-547.
3. Nagel AM, Amarteifio E, Lehmann-Horn F, Jurkat-Rott K, Semmler W, Schad LR, Weber MA. 3 Tesla sodium inversion recovery magnetic resonance imaging allows for improved visualization of intracellular sodium content changes in muscular channelopathies. Invest Radiol 2011;46(12):759-766.
4. Kratzer FJ, Flassbeck S, Schmitter S, Wilferth T, Magill AW, Knowles BR, Platt T, Bachert P, Ladd ME, Nagel AM. 3D sodium (23Na) magnetic resonance fingerprinting for time-efficient relaxometric mapping. Magn Reson Med 2021;86(5):2412-2425.
5. Gilles A, Nagel AM, Madelin G. Multipulse sodium magnetic resonance imaging for multicompartment quantification: Proof-of-concept. Sci Rep 2017;7(1):17435.
6. Tang S, Fernandez-Granda C, Lannuzel S, Bernstein B, Lattanzi R, Cloos M, Knoll F, Asslaender J. Multicompartment Magnetic Resonance Fingerprinting. Inverse Probl. 2018; 34:094005. doi: 10.1088/1361-6420/aad1c3.
7. Asslander J, Cloos MA, Knoll F, Sodickson DK, Hennig J, Lattanzi R. Low rank alternating direction method of multipliers reconstruction for MR fingerprinting. Magn Reson Med 2018;79(1):83-96.
Figures