1273
End-to-End Scan Parameter Optimization for Improved Myelin Water Imaging1Electrical Engineering and Computer Science, University of Michigan, Ann Arbor, MI, United States, 2Biomedical Engineering, University of Michigan, Ann Arbor, MI, United States
Synopsis
Optimization techniques can be used to design scan parameters for quantitative imaging. The Cramér-Rao Lower Bound (CRLB) is often used for such designs, but it only characterizes unbiased estimators. We propose an end-to-end approach to scan design that optimizes scan parameters with a particular estimator in mind. We compare CRLB-based and end-to-end scan designs in the context of myelin water imaging. The end-to-end scan design results in lower estimation error in simulation and an in vivo myelin water fraction (MWF) map with improved contrast. The proposed end-to-end scan design approach is thus a promising alternative to using the CRLB.
Introduction
Quantitative MRI seeks to estimate parameters of interest from one or more MR images. Not all sets of images are created equal, however—some have more information than others about the parameters to quantify. Choosing scan parameters to maximize one’s ability to accurately and precisely estimate parameters of interest can be automated using optimization techniques. A common approach to optimizing scan parameters involves minimizing the Cramér-Rao Lower Bound (CRLB), a lower bound on the variance of unbiased estimates of parameters; the CRLB has been used for optimizing scan parameters for myelin water imaging1, for T1/T2 estimation2, in magnetic resonance fingerprinting3, and when estimating parameters using machine learning4,5. However, the CRLB characterizes only unbiased estimators; therefore, scan parameters optimized using the CRLB may be suboptimal when paired with a biased estimator (such as machine learning models).In this work, we introduce an alternative, end-to-end approach to scan parameter optimization that selects scan parameters to minimize the estimation error of the particular estimator used for parameter estimation. We demonstrate the improved performance gained from an end-to-end scan design for quantifying myelin water fraction (MWF) using a two-pool model.
Theory and Methods
To optimize a set of scan parameters $$$\mathbf{P}$$$, one can solve$$\mathrm{argmin}_{\mathbf{P}} \Phi(\mathbf{P}),$$
where $$$\Phi$$$ is a cost function to minimize. For a CRLB-based scan design, $$$\Phi$$$ computes an average CRLB over a distribution of non-scan parameters (e.g., tissue parameters, field map, etc.) that one expects to see when scanning. For the proposed end-to-end scan design, $$$\Phi$$$ computes the mean square error (MSE) of parameters estimated from simulated data with non-scan parameters drawn from the same distribution as for the CRLB-based design. Note that the end-to-end approach is tailored to a particular estimator and minimizes the same metric that is used to evaluate the estimator’s performance.
In this work, we focus on estimating MWF, the proportion of a voxel’s MR signal arising from water within myelin bilayers. To estimate MWF, we used PERK (parameter estimation via regression with kernels)4, a nonlinear estimator that is trained using simulated training data. We then de-biased the MWF estimates6.
We optimized the flip angles and tip-up phases of two sets of 18 steady-state small-tip fast recovery (STFR)7 scans: one using the CRLB (denoted dCRLB) and another using the end-to-end approach (denoted dE2E). Two of the 18 scans were fixed spoiled gradient recalled echo (SPGR) scans (equivalent to STFR without the tip-up RF pulse) with a TE offset (TR/TE1/TE2 = 13.1/4.0/6.3 ms, FA = 5°) used for separate B0 mapping. (We incorporated the B0 map when estimating MWF using PERK.) The remaining 16 STFR scans had fixed timing parameters (Tfree /Tg /TE = 8.0/2.8/4.0 ms, TR = Tfree + Tg). To compute the average CRLB for dCRLB and for generating validation and training data for PERK for dE2E, non-scan parameters were drawn from distributions covering tissue parameter values present in cerebral white matter (WM) and gray matter (GM). We used a two-compartment tissue model: one compartment representing myelin water, and another representing non-myelin water. We also modeled exchange between the two compartments. We computed the solution to the Bloch-McConnell equation8 using BlochSim.jl9 in the Julia programming language10. We initialized the two scan designs at the same starting point and ran the BFGS optimizer11 to local convergence.
We compared the two designs by generating noisy test data by simulating STFR scans using dCRLB and dE2E and with tissue parameters randomly drawn from wide WM/GM distributions. We also used a digital BrainWeb phantom12 with WM and GM tissue parameters fixed to typical values but varying MWF from top to bottom and varying off-resonance from left to right. Finally, we scanned a healthy volunteer with the two scan designs (32-channel head coil, 3D 1.1 mm isotropic, matrix size 200 × 200 × 8). Because of the high flip angles of dCRLB, we increased the timing parameters (of both designs) to Tfree /Tg /TE = 10.6/7.2/5.5 ms to reduce SAR. For each of these experiments, we compared the MWF estimates produced from the two scan designs.
Results
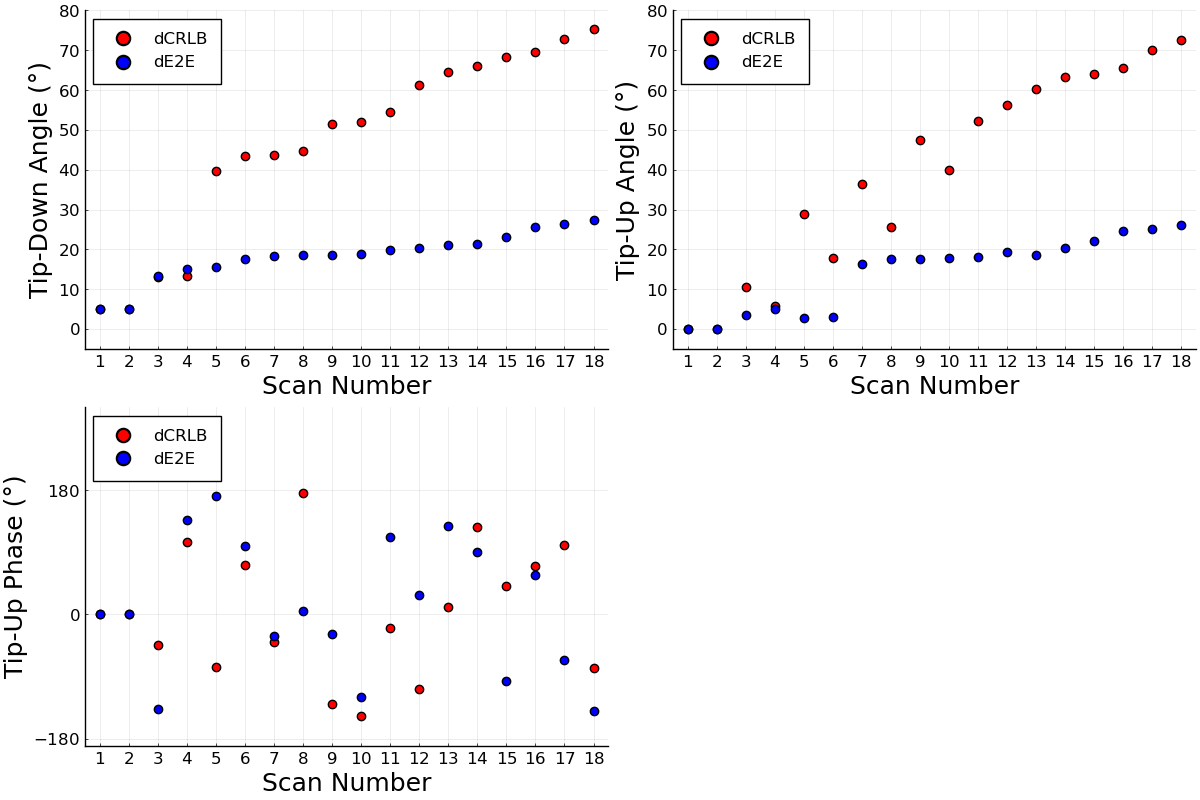
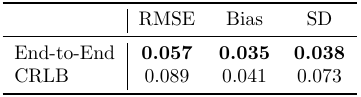
Figure 1 shows the parameters of the optimized scan designs dCRLB and dE2E.Table 1 compares the root MSE (RMSE), mean absolute bias, and standard deviation of MWF estimates in simulation. dE2E results in better values in all cases.
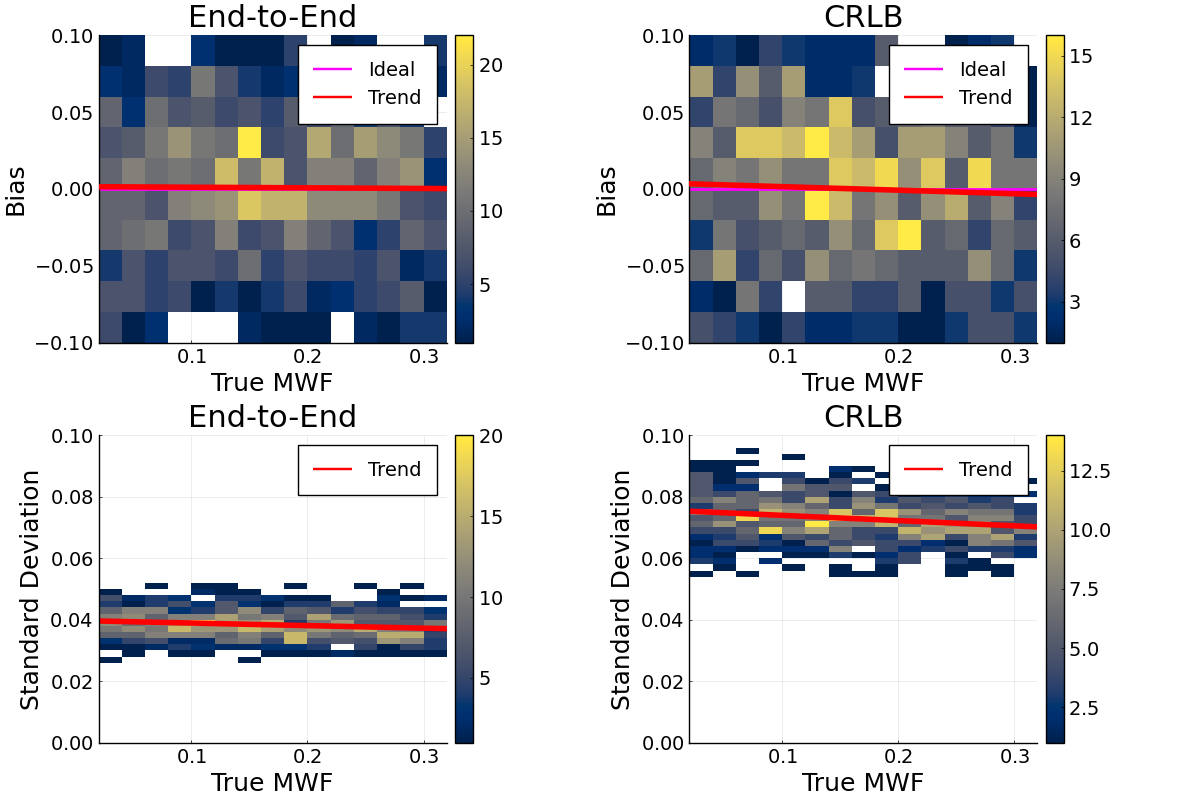
Figure 2 shows 2D histograms of bias and standard deviation of MWF estimates resulting from the two designs. While both result in unbiased MWF estimates on average, dE2E results in lower variation in the estimates.
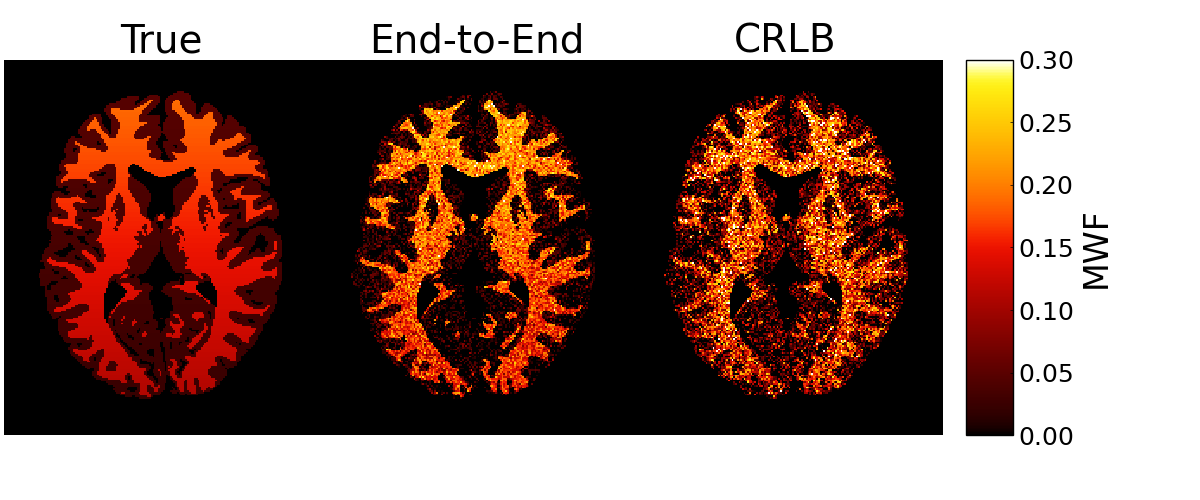
Figure 3 shows the BrainWeb MWF estimates. dE2E results in a cleaner image with better contrast between different MWF values.
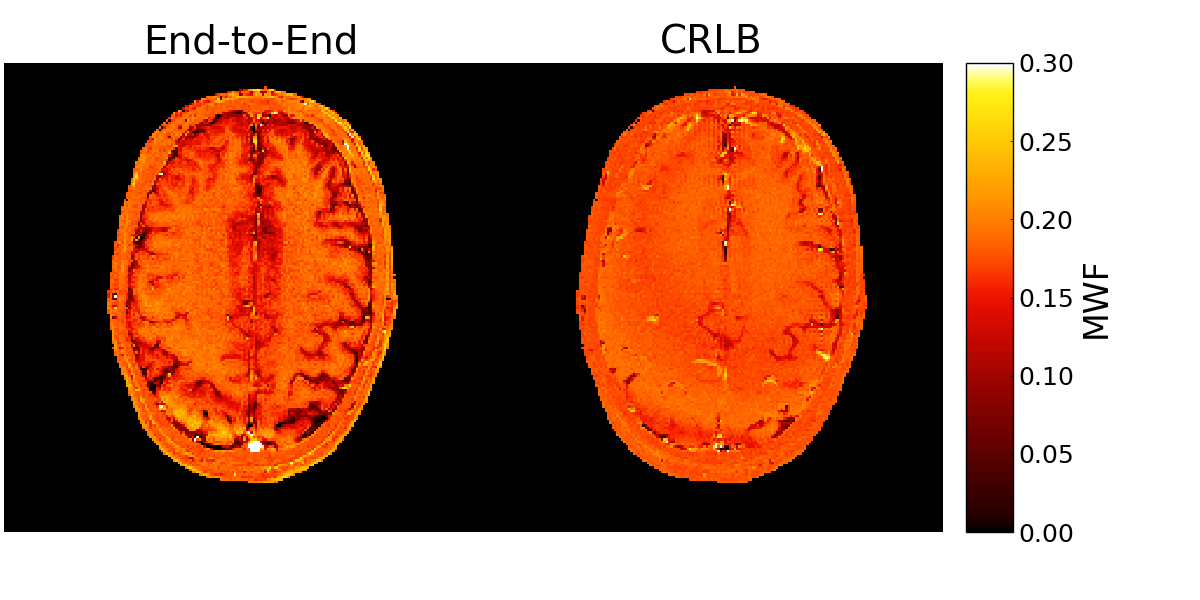
Figure 4 shows the in vivo MWF estimates. dE2E results in a better-looking MWF map with greater WM/GM contrast.
Discussion and Conclusion
We optimized two sets of scan parameters, one using the CRLB and another using the proposed end-to-end optimization. The two designs resulted in very different flip angles, and the experimental results show the superiority of dE2E over dCRLB.Future areas of research include modifying the end-to-end cost function to minimize a tradeoff between bias and variance, incorporating different types of scans into the scan design, and evaluating the proposed approach with patient data.
Acknowledgements
This work was supported in part by NIH grants R21 AG061839 and U24 NS120056 and by NSF grant IIS 1838179.References
[1] S. T. Whitaker, G. Nataraj, J-F. Nielsen, and J. A. Fessler. Myelin water fraction estimation using small-tip fast recovery MRI. Mag. Res. Med., 84(4):1977–90, October 2020.
[2] G. Nataraj, J-F. Nielsen, and J. A. Fessler. Optimizing MR scan design for model-based T1, T2 estimation from steady-state sequences. IEEE Trans. Med. Imag., 36(2):467–77, February 2017.
[3] B. Zhao, J. P. Haldar, C. Liao, D. Ma, Y. Jiang, M. A. Griswold, K. Setsompop, and L. L. Wald. Optimal experiment design for magnetic resonance fingerprinting: Cramér-Rao bound meets spin dynamics. IEEE Trans. Med. Imag., 38(3):844–61, March 2019.
[4] G. Nataraj, J-F. Nielsen, C. D. Scott, and J. A. Fessler. Dictionary-free MRI PERK: Parameter estimation via regression with kernels. IEEE Trans. Med. Imag., 37(9):2103–14, September 2018.
[5] A. Lahiri, J. A. Fessler, and L. Hernandez-Garcia. Optimizing MRF-ASL scan design for precise quantification of brain hemodynamics using neural network regression. Mag. Res. Med., 83(6):1979–91, June 2020.
[6] I. Kosmidis. Bias in parametric estimation: reduction and useful side-effects. WIREs Computational Statistics, 6(3):185–96, March 2014.
[7] J-F. Nielsen, D. Yoon, and D. C. Noll. Small-tip fast recovery imaging using non-slice-selective tailored tip-up pulses and radiofrequency-spoiling. Mag. Res. Med., 69(3):657–66, March 2013.
[8] H. M. McConnell. Reaction rates by nuclear magnetic resonance. J. of Chemical Phys., 28(3):430–31, March 1958.
[9] https://github.com/StevenWhitaker/BlochSim.jl
[10] J. Bezanson, A. Edelman, S. Karpinski, and V. B. Shah. Julia: A fresh approach to numerical computing. SIAM Review, 59(1):65–98, 2017.
[11] Patrick Kofod Mogensen and Asbjørn Nilsen Riseth. Optim: A mathematical optimization package for Julia. Journal of Open Source Software, 3(24):615, 2018.
[12] D. L. Collins, A. P. Zijdenbos, V. Kollokian, J. G. Sled, N. J. Kabani, C. J. Holmes, and A. C. Evans. Design and construction of a realistic digital brain phantom. IEEE Trans. Med. Imag., 17(3):463–8, June 1998.
Figures