1270
A comprehensive protocol for multiparametric brain MRI1Biomedical Engineering, Tel Aviv University, Tel Aviv, Israel, 2The Edmond and Lily Safra Center for Brain Sciences, The Hebrew University of Jerusalem, Jerusalem, Israel, 3Department of Medical Physics and Biomedical Engineering, University College London, London, United Kingdom, 4Aix Marseille University, CNRS, CRMBM, Marseille, France, 5Sagol School of Neuroscience, Tel Aviv University, Tel Aviv, Israel, 6Center for Advanced Imaging Innovation and Research (CAI2R), University Langone Medical Center, New York, Israel
Synopsis
The clinical utility of quantitative MRI (qMRI) techniques was demonstrated in numerous pathologies. This work investigated a range of qMRI pulse-sequences and processing methods with proven clinical applicability, aiming to establish a comprehensive and standard qMRI scan protocol for the brain. This multiparametric protocol provides a wide range of numeric maps (e.g., T1, T2, T2*, PD, M0, B1+, water and macromolecular fractions, susceptibility, mean diffusivity, and more) with whole-brain coverage, diverse set of clinical biomarkers, and the ability for stable longitudinal and multi-center investigations. Limitations and practical tips are provided for users interested in quantitative brain imaging.
Introduction
The field of quantitative MRI (qMRI) has been gaining increased attention in the last years. qMRI offers three main advantages: (1) quantitative parametric maps alongside traditional contrast-weighted images1; (2) higher sensitivity to subtle changes that are hard to detect visually2; (3) scalability of measured values (e.g. relaxation times) across different protocol implementations, scanners, and scan settings3.The clinical utility of qMRI was exemplified in many pathologies3, for example, infiltration inside and beyond the peritumoral edema of glioblastomas using T1 mapping4, evaluation of steatosis and iron overload in liver disease using susceptibility maps5, and pathological changes in Multiple Sclerosis patients using T22 and magnetization transfer related maps6. Choosing the optimal set of qMRI imaging techniques is not trivial, particularly in light of the many pulse sequences and processing methods available, and within the time limitations of a single scan session.
In this work, we investigated a range of qMRI pulse-sequences and processing methods, in order to establish a comprehensive and quantitative brain MRI protocol that offers accurate and reproducible values. The ensuing brain protocol produces a range of parametric maps, which can facilitate the use of quantitative MRI biomarkers in longitudinal and multi-center studies.
Methods
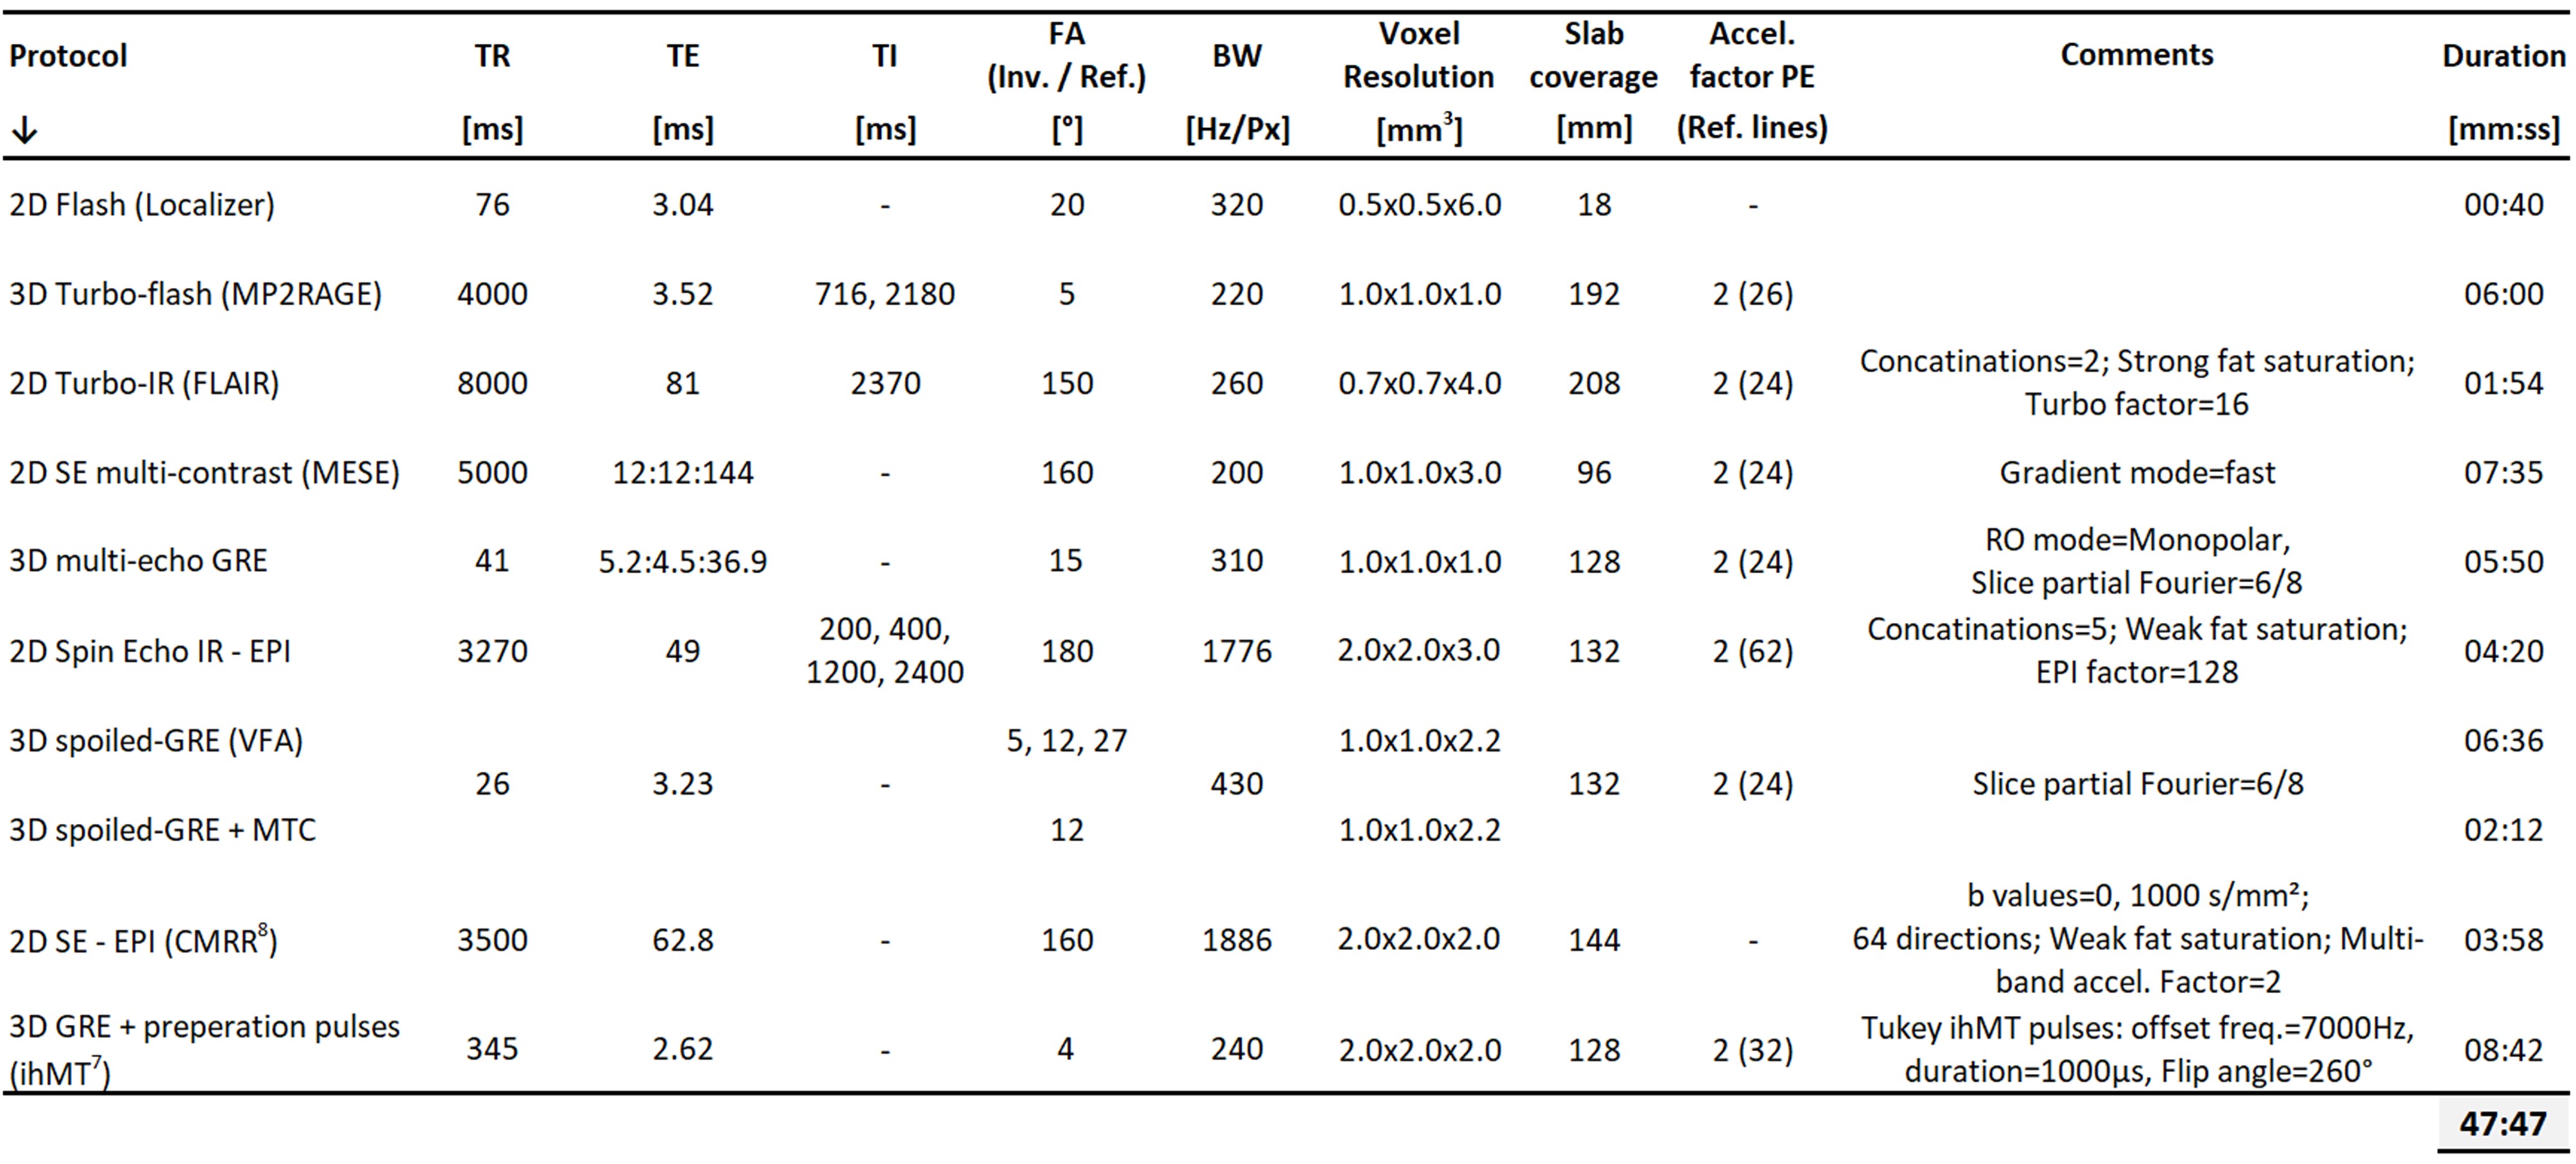
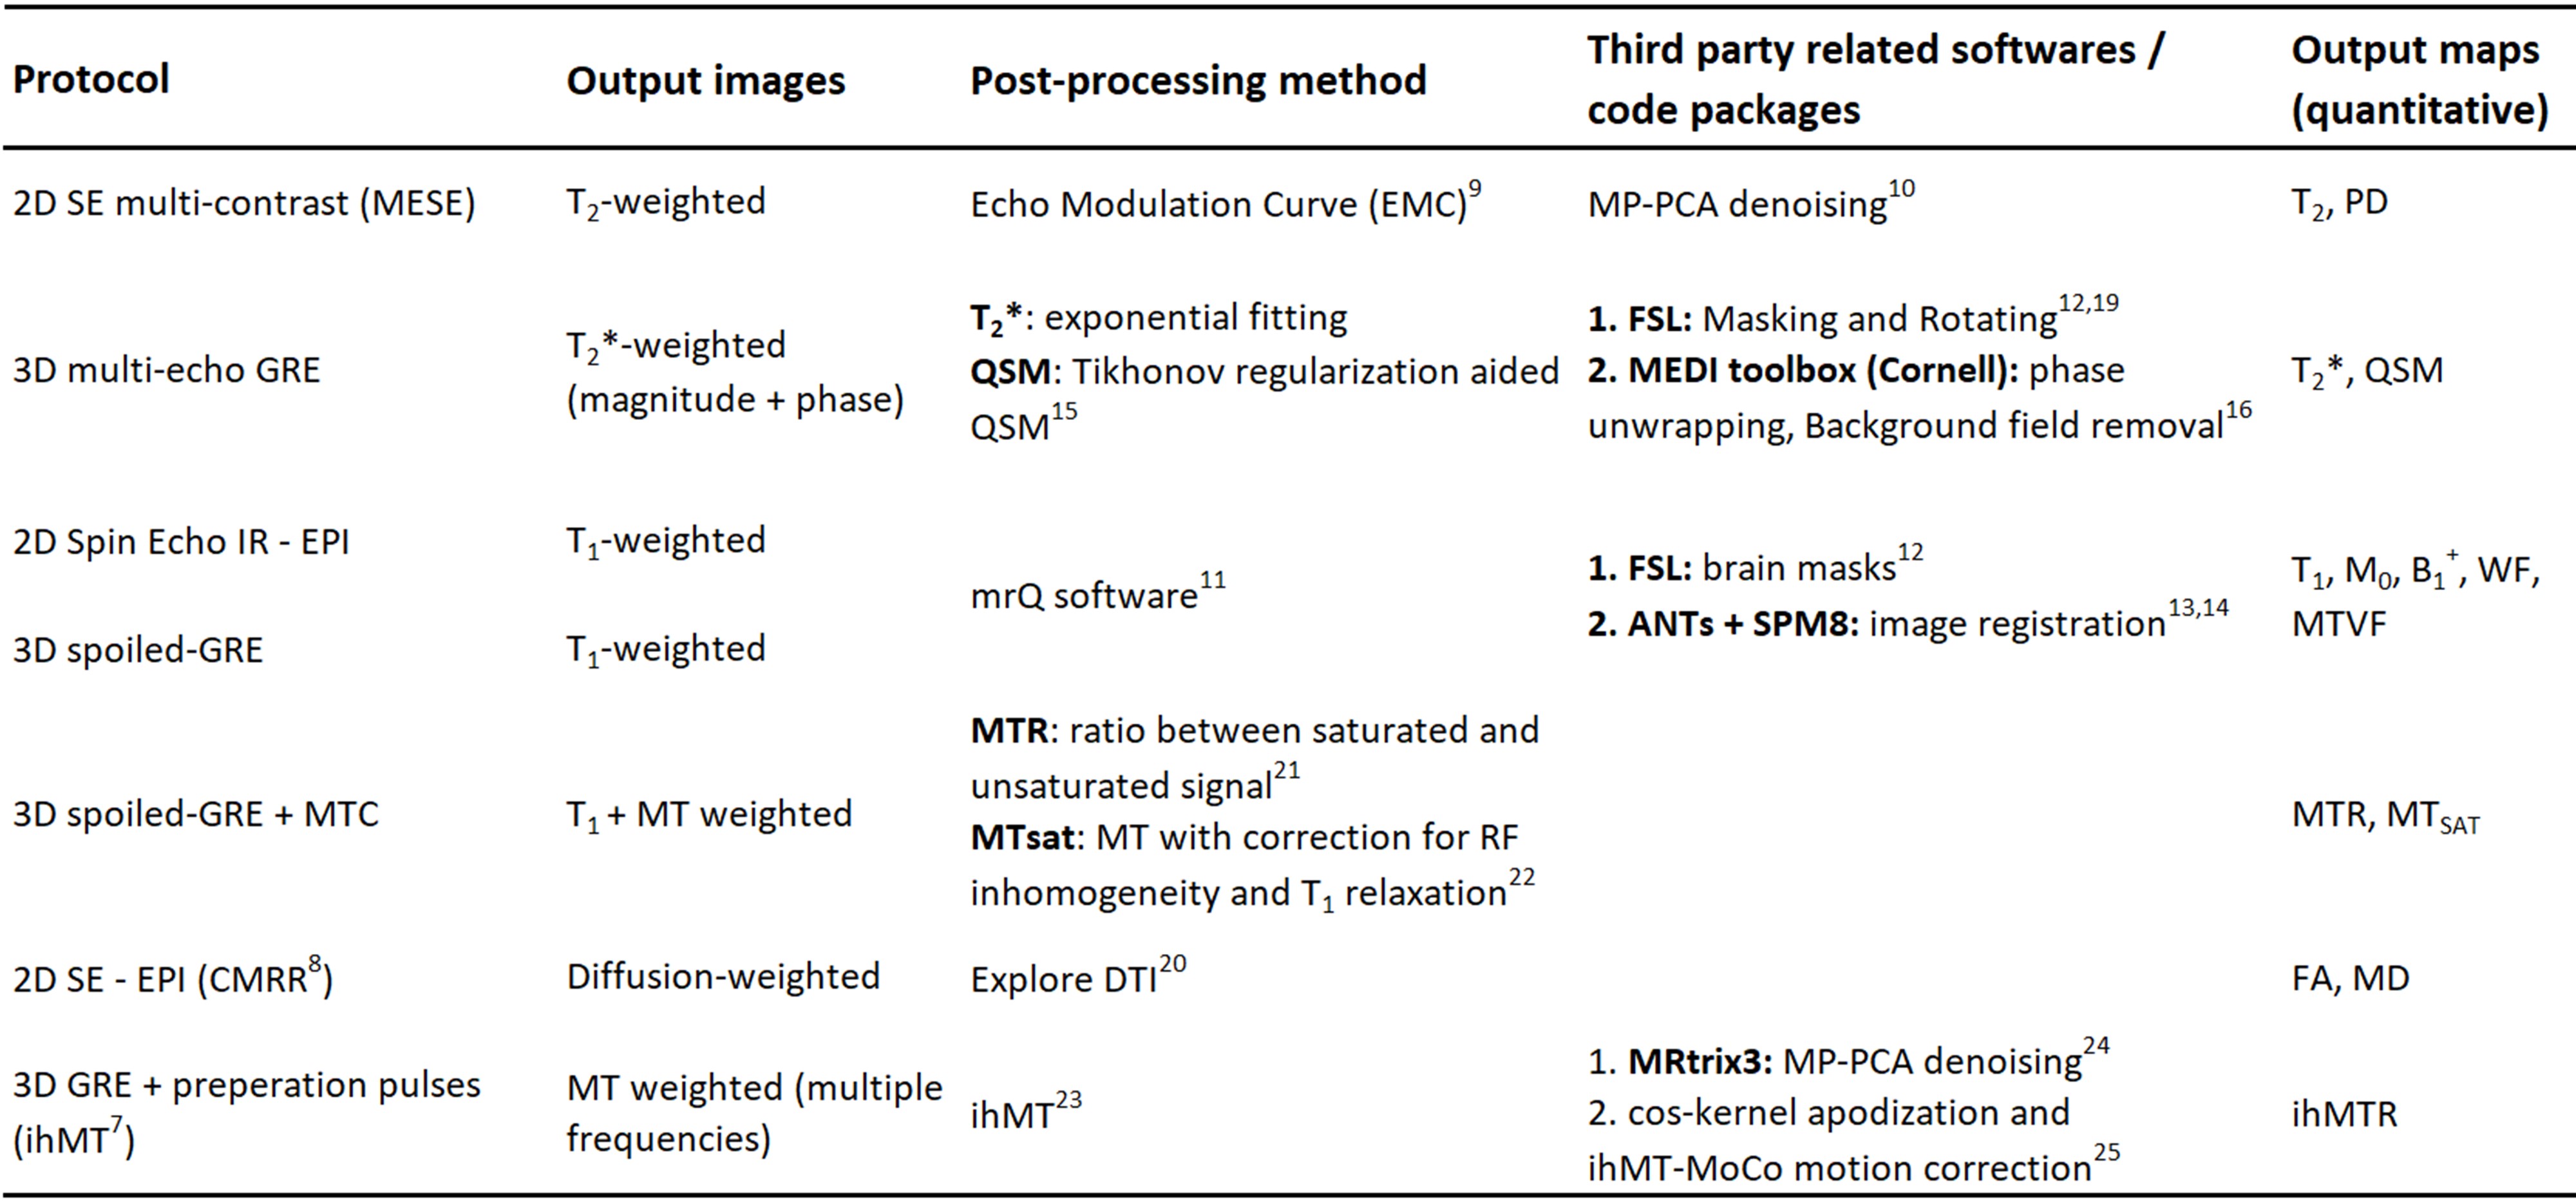
The qMRI brain protocol was designed to include commonly used contrast mechanisms, and optimized with respect to the experimental settings and postprocessing technique. The list of pulse sequences and scan settings is delineated in Table 1. It includes two anatomical scans: 3D-MP2RAGE and FLAIR, and the following pulse-sequences for qMRI: multi-echo spin-echo (MESE); 3D multi-echo gradient-echo (GRE); spin-echo echo planner imaging (SE-EPI); SE Inversion-recovery EPI; and, 3D-spoiled GRE (SPGR) with, and without, magnetization transfer (MT) preparation pulses. The inhomogeneous MT (ihMT) sequence implementation is described in Mchinda et al7. Multiband acceleration technique implemented in the Center for Magnetic Resonance Research (CMRR) was used for diffusion scans, with multiband factor of 28. The total nominal scan time was 47:47 min:sec.The list of pulse-sequences and processing methods used for each qMRI map is delineated in Table 2. These includes:
qT2, PD: T2 and PD maps were produced using the Echo Modulation Curve (EMC) platform9, after applying Marchenko-Pastur Principal Component Analysis (MP-PCA) denoising10.
qT2*: T2* fitting was based on a simple mono-exponential decay.
qT1, B1+, M0, WF, MTVF: T1 mapping was based on mrQ software package11. Postprocessing steps includes brain masking (FSL12), and linear and non-linear registrations (ANTs13 and SPM14, respectively). Based on the data acquired for mrQ, a transmitting field (B1+) map was generated, alongside tissue parameter maps- M0, water fraction (WF) and macromolecular tissue volume fraction (MTVF)11.
QSM: Quantitative Susceptibility Mapping calculations were based on the pipeline described by Karsa et al15. The reconstruction process included phase unwrapping and background field removal (MEDI toolbox16), FSL masking followed by noise-based mask erosion17 and tilt correction18,19.
MD, FA: Diffusion tensor imaging scans were analyzed using Explore DTI software20, producing the mean diffusivity (MD) and fractional anisotropy (FA) maps.
MTR, MTsat, ihMTR: MT ratio (MTR) maps were calculated as the ratio between SPGR data acquired with and without MT preparation pulse21. MTsat maps were reconstructed with inherent correction for RF inhomogeneity and T1 relaxation22. The inhomogeneous MTR (ihMTR) processing pipeline is described in23, and involves FSL masking, MP-PCA denoising (MRtrix324), and motion and Gibbs artifacts corrections (ihMT-MoCo and cosine apodization25).
To demonstrate the protocol utility, five healthy volunteers were scanned on a 3T whole-body scanner (Prisma, Siemens Healtheneers), using a 64-channals head coil, after obtaining an inform consent.
Results
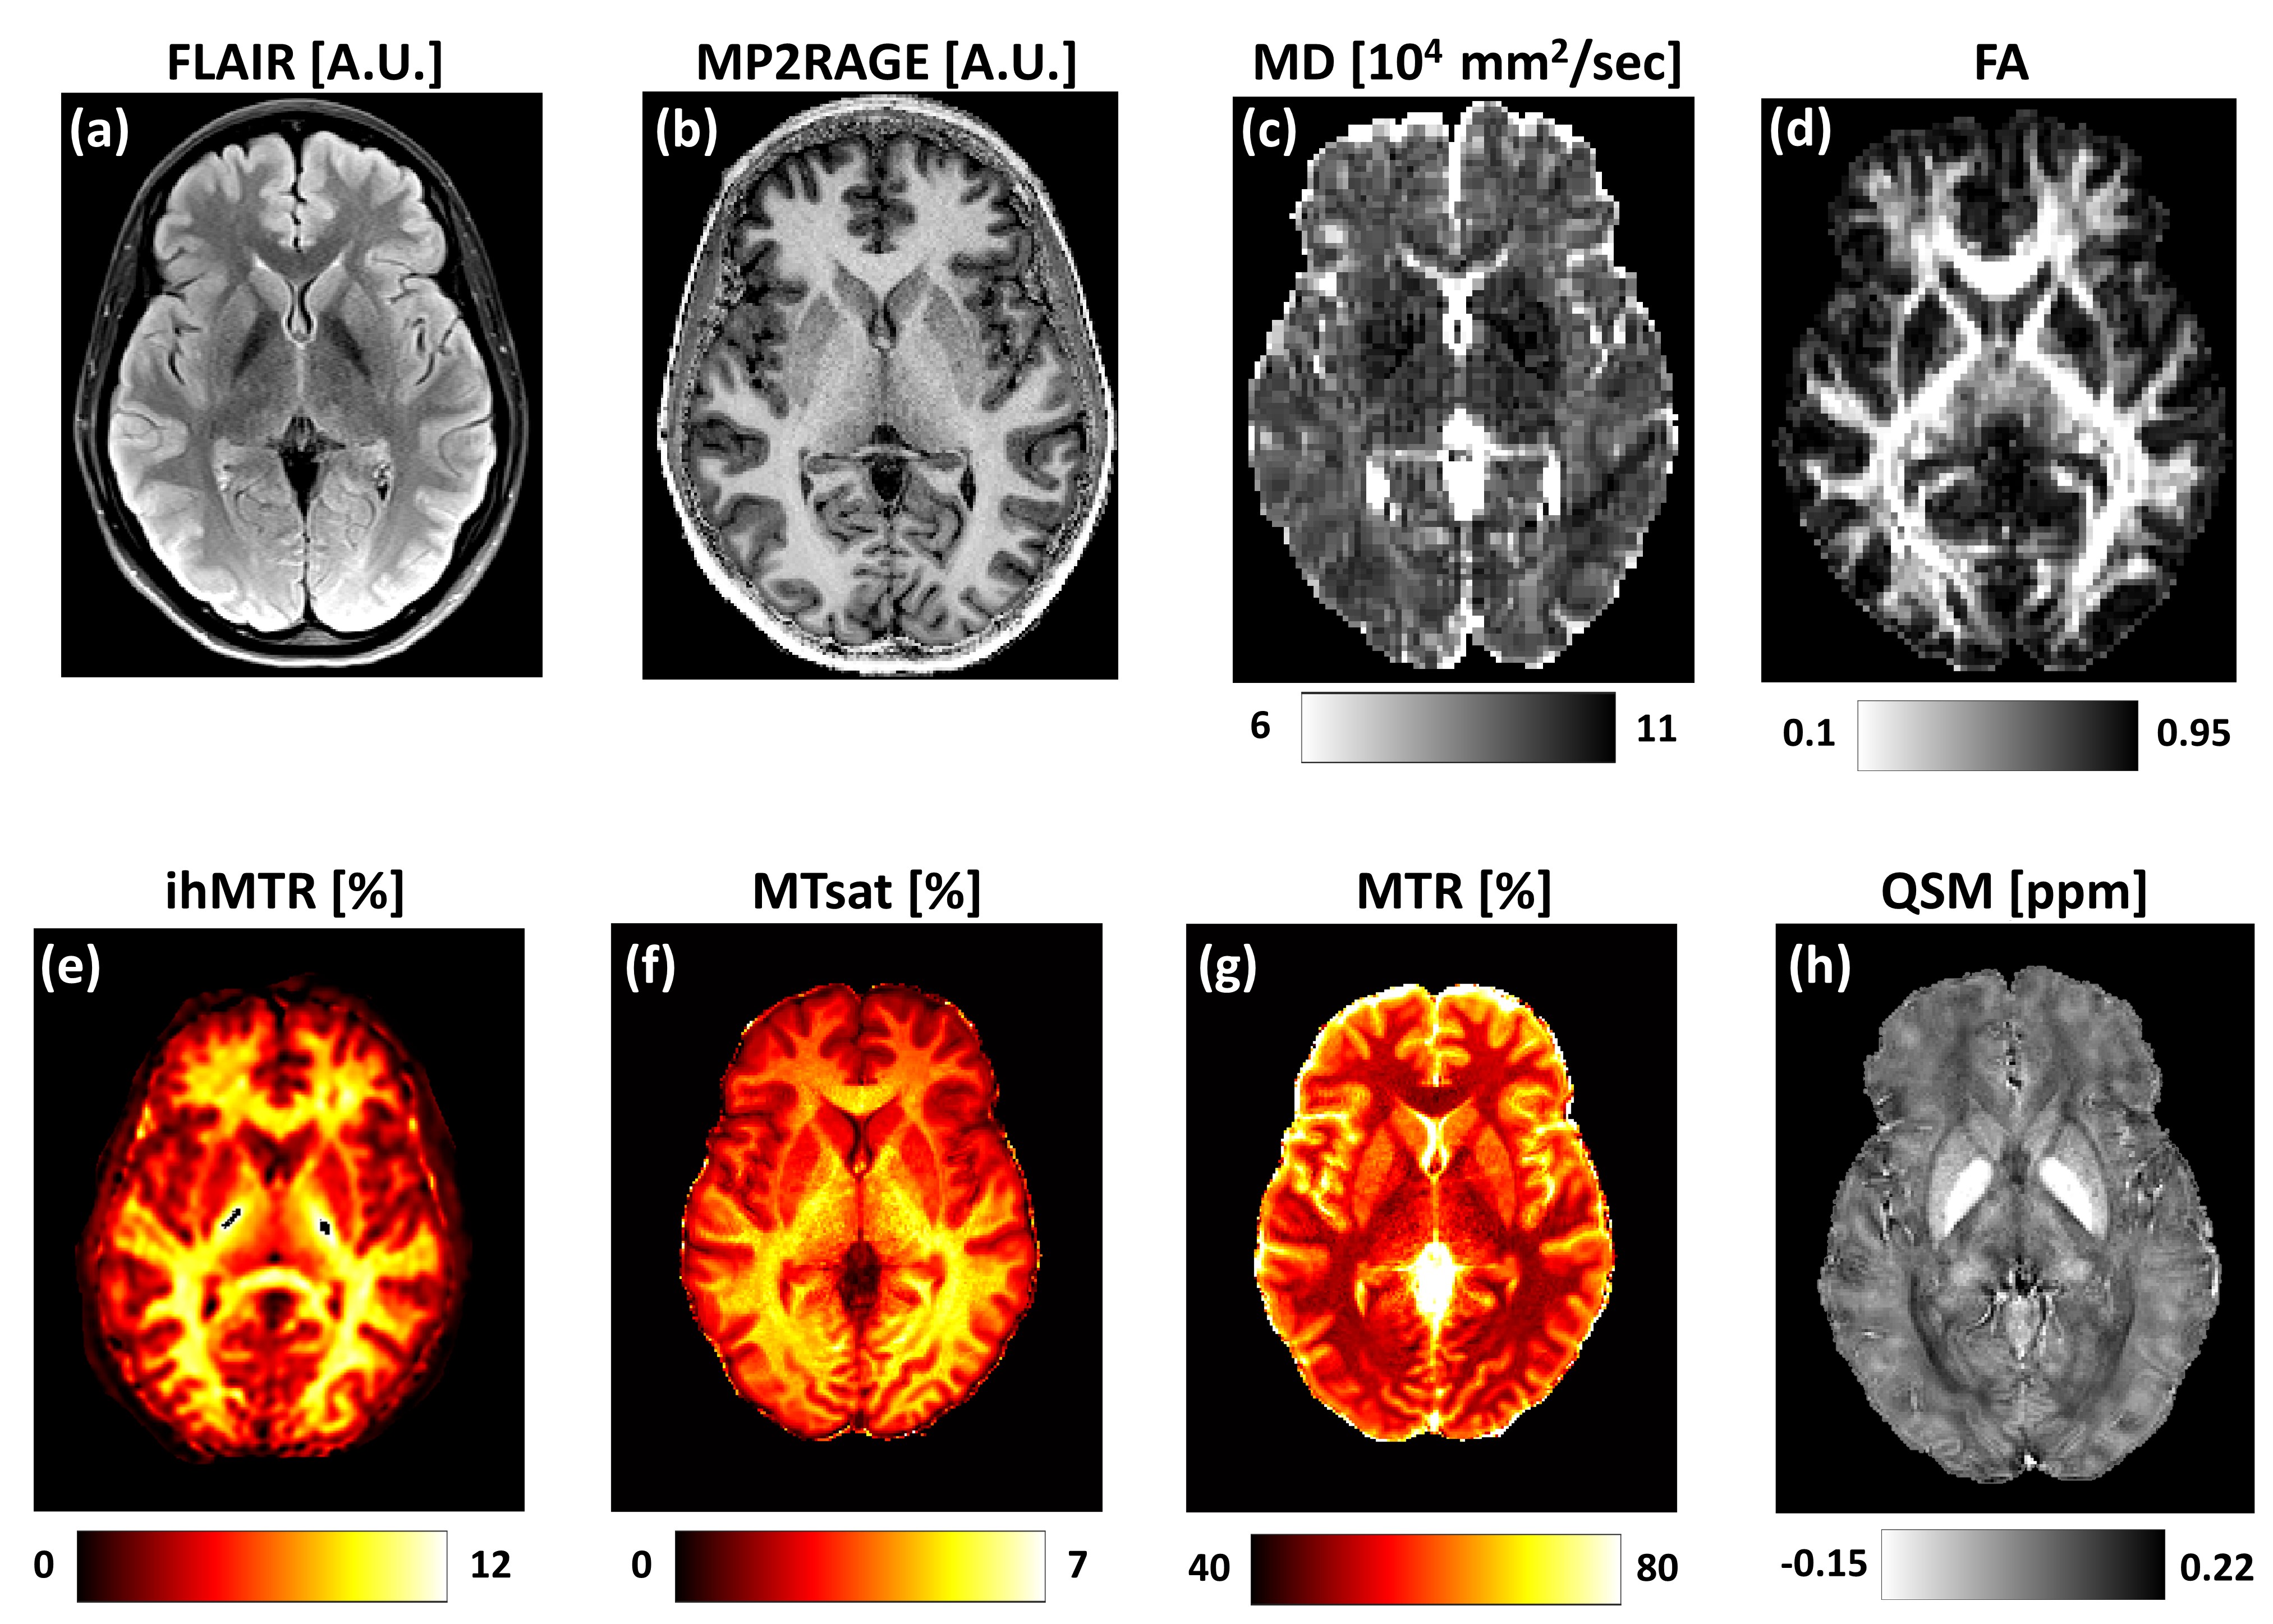
Representative contrast-weighted images and quantitative maps from a single volunteer (Female, 28 y/o) are shown in Figures 1 and 2.Figure 1 shows: (a-b) anatomical contrast-weighted FLAIR and MP2RAGE images; (c) mean diffusivity (MD); (d) fractional anisotropy (FA); (e) Magnetization transfer ratio (MTR); (f) MTsat; (g) inhomogeneous MTR (ihMTR); and (h) Quantitative susceptibility map (QSM).
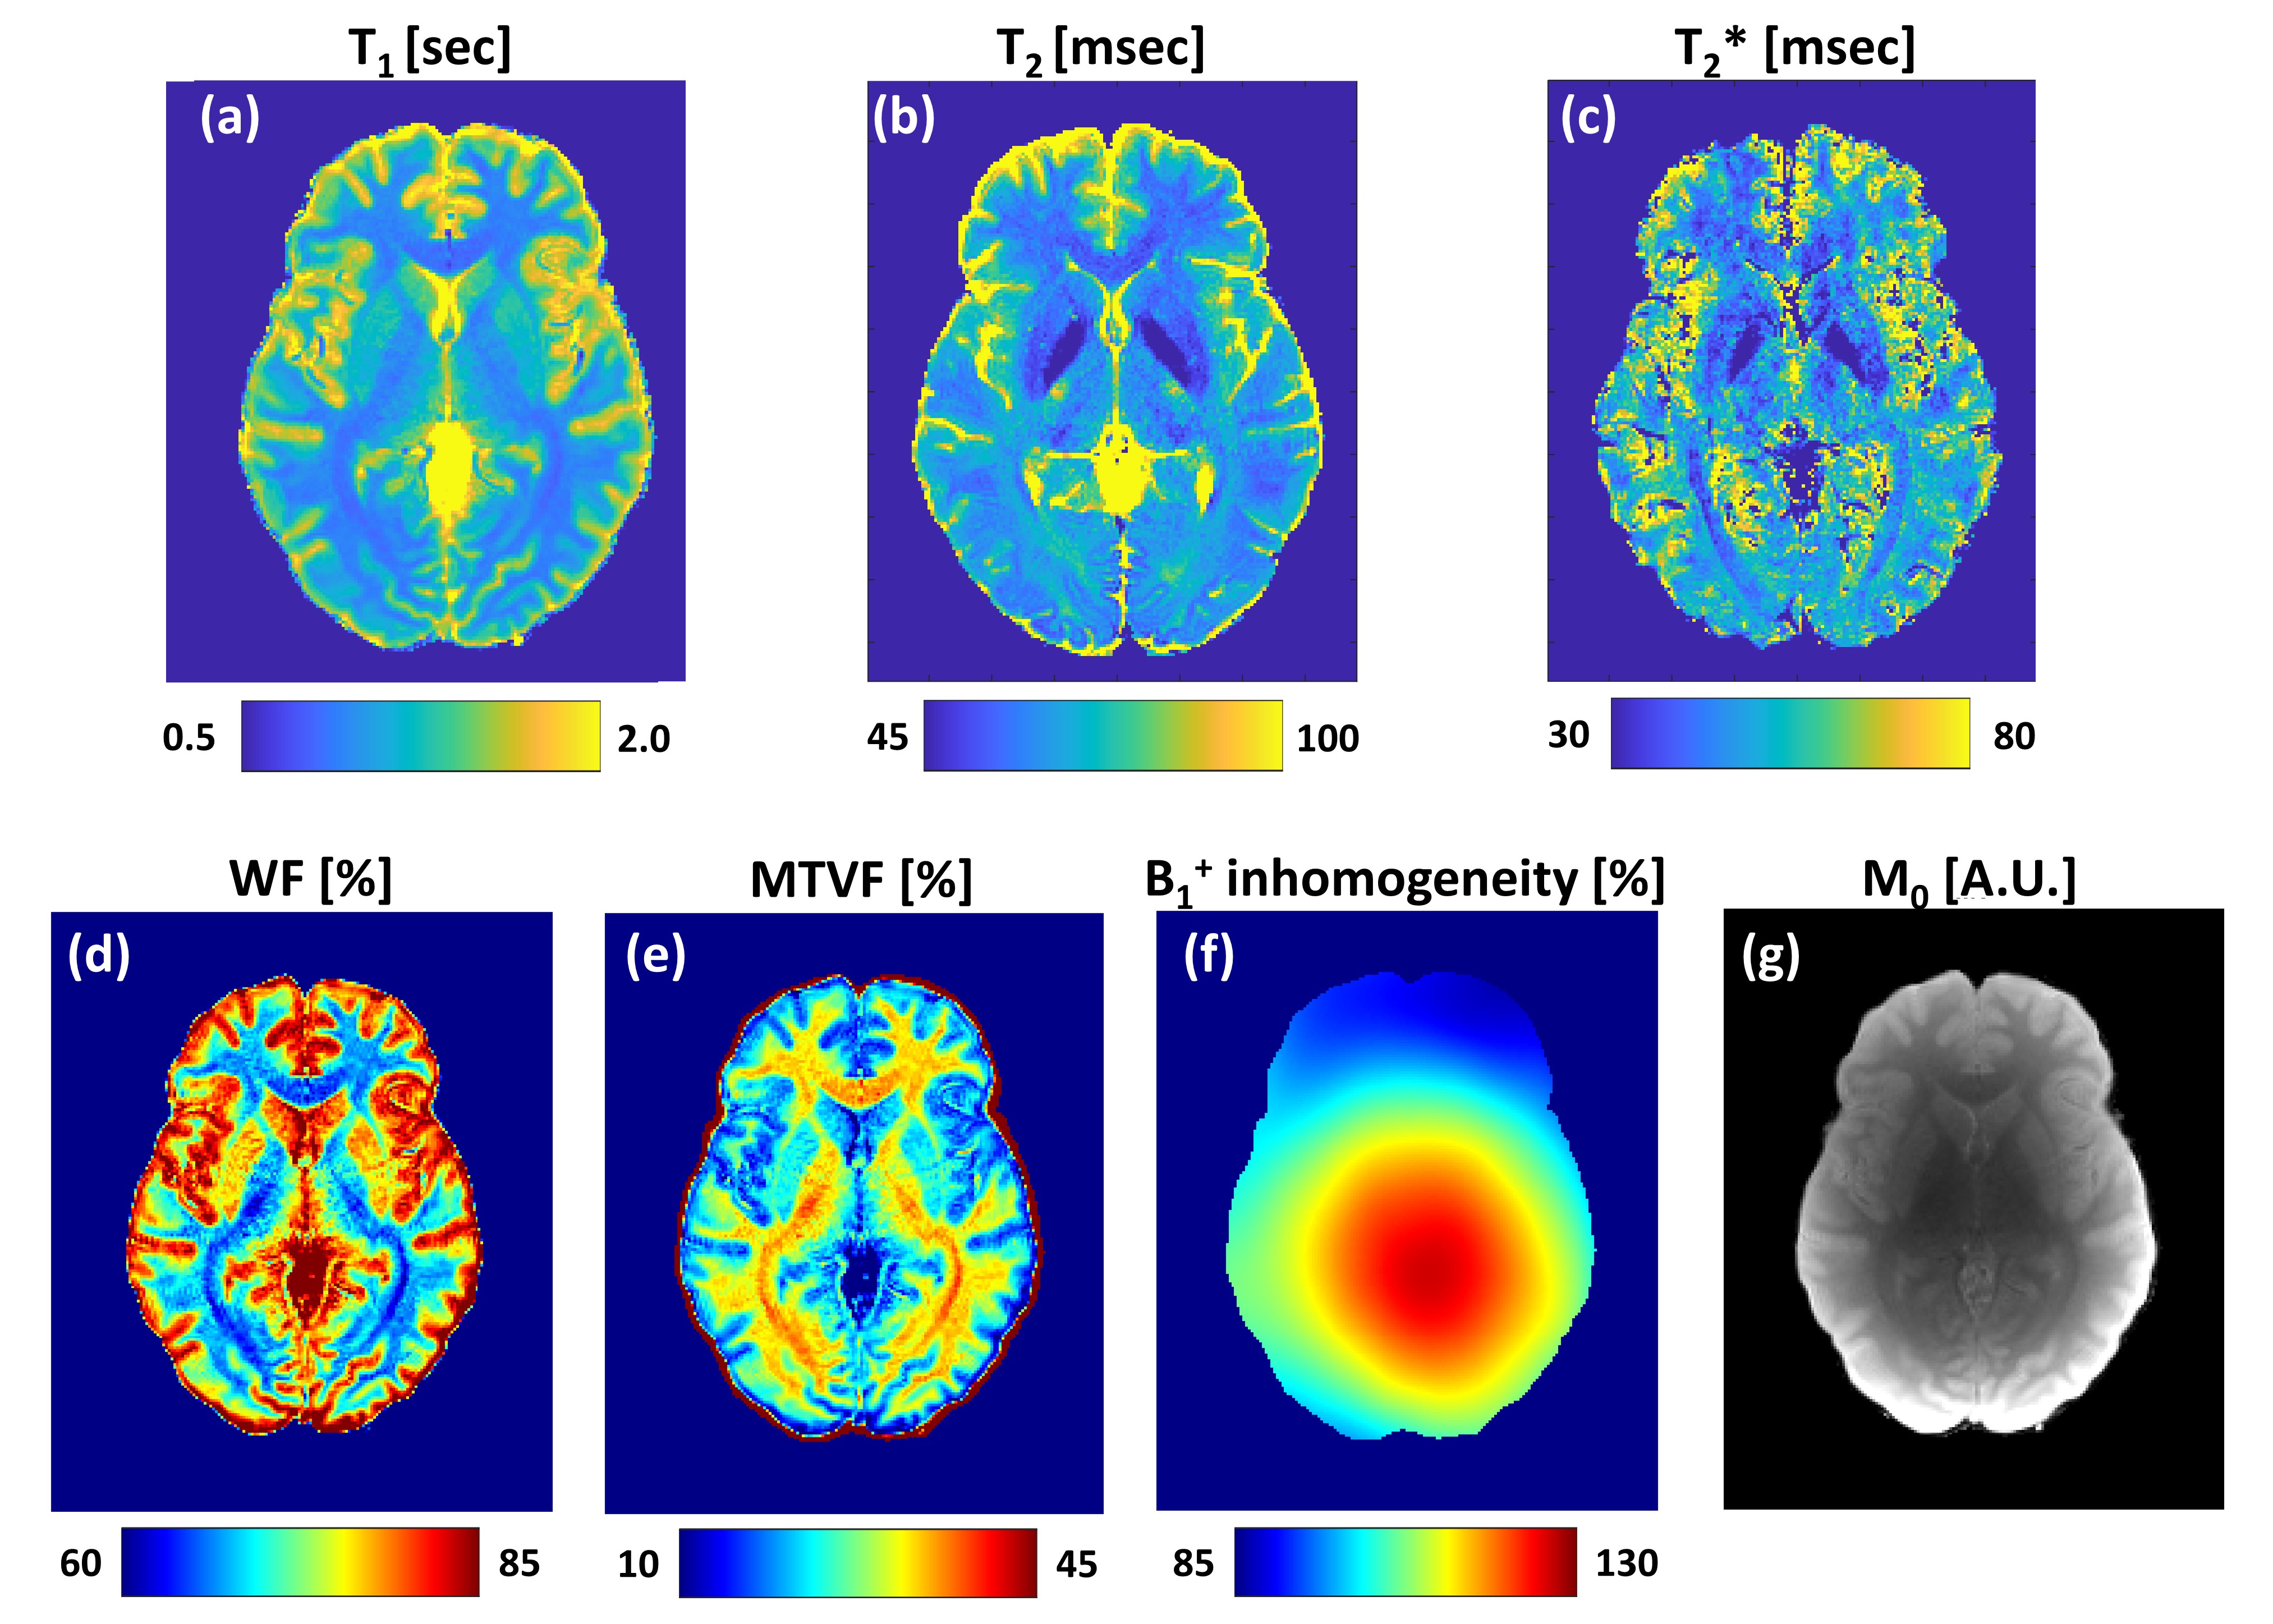
Figure 2 shows quantitative maps of: relaxation times (a) T1; (b) T2; (c) T2*; The tissue fractional volumes of: (d) water (WF) and (e) macromolecules (MTVF); (f) transmitting field, B1+, inhomogeneity; (g) M0 (i.e., the hadamard product of the receive‐coil sensitivity and the proton density).
Discussion and Conclusions
The clinical applicability of qMRI is continuously increasing, offering a diverse range of numeric biomarkers. Herein we present a comprehensive qMRI protocol for brain imaging. The set of pulse-sequences, scan parameters, and postprocessing techniques were all adjusted to produce optimal contrast and stable and reproducible values.The protocol produces a wide range of quantitative maps. Due to the long scan time, applying the entire protocol might be challenging. To accommodate shorter scan times, the protocol was design in a modular manner, allowing to acquire and reconstruct specific data and parametric maps. Further investigation of this protocol includes testing intra- and inter-subject variabilities.
The higher sensitivity and the reproducibility of qMRI data can facilitate longitudinal and multi-center investigations, and be utilized for many applications, including the investigation of pathologies in normal appearing WM and GM tissues, and the dependency of qMRI parameters on criterions such as age, sex, dominant hand, and more.
Acknowledgements
ISF Grant 2009/17References
[1] Blystad I, Warntjes JBM, Smedby O, Landtblom AM, Lundberg P, Larsson EM. Synthetic MRI of the brain in a clinical setting. Acta Radiologica. 2012;53(10):1158-1163. doi:10.1258/ar.2012.120195
[2] Shepherd TM, Kirov II, Charlson E, et al. New rapid, accurate T2 quantification detects pathology in normal-appearing brain regions of relapsing-remitting MS patients. NeuroImage: Clinical. 2017;14:363-370. doi:10.1016/j.nicl.2017.01.029
[3] Dowell NG, Wood TC, Wood TC. Quantitative MRI of the Brain. Principles of Physical Measurement, Second Edition. CRC Press; 2018. doi:10.1201/B21837-6
[4] Nöth U, Tichy J, Tritt S, Bähr O, Deichmann R, Hattingen E. Quantitative T1 mapping indicates tumor infiltration beyond the enhancing part of glioblastomas. NMR in Biomedicine. 2020;33(3). doi:10.1002/nbm.4242
[5] Uhrig M, Mueller J, Longerich T, et al. Susceptibility based multiparametric quantification of liver disease: Non-invasive evaluation of steatosis and iron overload. Magnetic Resonance Imaging. 2019;63:114-122. doi:10.1016/j.mri.2019.08.016
[6] Zhang L, Wen B, Chen T, et al. A comparison study of inhomogeneous magnetization transfer (ihMT) and magnetization transfer (MT) in multiple sclerosis based on whole brain acquisition at 3.0 T. Magnetic Resonance Imaging. 2020;70:43-49. doi:10.1016/J.MRI.2020.03.010
[7] Mchinda S, Varma G, Prevost VH, et al. Whole brain inhomogeneous magnetization transfer (ihMT) imaging: Sensitivity enhancement within a steady-state gradient echo sequence. Magnetic Resonance in Medicine. 2018;79(5):2607-2619. doi:10.1002/MRM.26907
[8] Multi-Band Accelerated EPI Pulse Sequences. Center for Magnetic Resonance Research, Department of Radiology, Minneapolis, MN, USA. Published 2016. https://www.cmrr.umn.edu/multiband/
[9] Does MD, Olesen JL, Harkins KD, et al. Evaluation of principal component analysis image denoising on multi‐exponential MRI relaxometry. Magnetic Resonance in Medicine. 2019;81(6):mrm.27658. doi:10.1002/mrm.27658
[10] Ben-Eliezer N, Sodickson DK, Block TK. Rapid and Accurate T2 mapping from Multi Spin Echo Data Using Bloch-Simulation-Based Reconstruction. Magnetic resonance in medicine. 2015;73(2):809-817. doi:10.1002/mrm.25156
[11] Mezer A, Yeatman JD, Stikov N, et al. Quantifying the local tissue volume and composition in individual brains with magnetic resonance imaging. Nature Medicine. 2013 19:12. 2013;19(12):1667-1672. doi:10.1038/nm.3390
[12] Smith SM. BET: Brain Extraction Tool FMRIB (Oxford Centre for Functional Magnetic Resonance Imaging of the Brain). www.fmrib.ox.ac.uk/˜steve
[13] Avants BB, Tustison NJ, Song G, Cook PA, Klein A, Gee JC. A reproducible evaluation of ANTs similarity metric performance in brain image registration. NeuroImage. 2011;54(3):2033-2044. doi:10.1016/J.NEUROIMAGE.2010.09.025
[14] Ashburner J. Computational anatomy with the SPM software. Magnetic Resonance Imaging. 2009;27(8):1163-1174. doi:10.1016/J.MRI.2009.01.006
[15] Karsa A, Punwani S, Shmueli K. An optimized and highly repeatable MRI acquisition and processing pipeline for quantitative susceptibility mapping in the head-and-neck region. Magnetic Resonance in Medicine. 2020;84(6):3206-3222. doi:10.1002/MRM.28377
[16] Cornell MRI research lab. Quantitative Susceptibility Mapping-MEDI toolbox. Published 2013. http://pre.weill.cornell.edu/mri/pages/qsm.html
[17] Karsa A, Punwani S, Shmueli K. The effect of low resolution and coverage on the accuracy of susceptibility mapping. Magnetic Resonance in Medicine. 2019;81(3):1833-1848. doi:10.1002/MRM.27542
[18] Kiersnowski O, Karsa A, Thornton J, Shmueli K. The Effect of Oblique Image Slices on the Accuracy of Quantitative Susceptibility Mapping and a Robust Tilt Correction Method. In: ISMRM & SMRT Annual Meeting & Exhibition 2021. https://index.mirasmart.com/ISMRM2021/PDFfiles/0794.html
[19] Smith SM, Jenkinson M, Woolrich MW, et al. Advances in functional and structural MR image analysis and implementation as FSL. NeuroImage. 2004;23(SUPPL. 1):S208-S219. doi:10.1016/J.NEUROIMAGE.2004.07.051
[20] Leemans A, Jeurissen B, Sijbers J, Jones DK. ExploreDTI: a graphical toolbox for processing, analyzing, and visualizing diffusion MR data. In: 17th Annual Meeting of Intl Soc Mag Reson Med. 2009:3537.
[21] Henkelman RM, Stanisz GJ, Graham SJ. Magnetization transfer in MRI: A review. NMR in Biomedicine. 2001;14(2):57-64. doi:10.1002/nbm.683
[22] Helms G, Dathe H, Kallenberg K, Dechent P. High-resolution maps of magnetization transfer with inherent correction for RF inhomogeneity and T1 relaxation obtained from 3D FLASH MRI. Magnetic Resonance in Medicine. 2008;60(6):1396-1407. doi:10.1002/MRM.21732
[23] ihMT protocol. GitHub repository: https://github.com/lsoustelle/ihmt_proc.
[24] Tournier JD, Smith R, Raffelt D, et al. MRtrix3: A fast, flexible and open software framework for medical image processing and visualisation. NeuroImage. 2019;202:116137. doi:10.1016/J.NEUROIMAGE.2019.116137
[25] Soustelle L, Lamy J, Troter A le, et al. A Motion Correction Strategy for Multi-Contrast based 3D parametric imaging: Application to Inhomogeneous Magnetization Transfer (ihMT). bioRxiv. 2020. doi:10.1101/2020.09.11.292649
Figures