1269
TR dependence of phase-cycled bSSFP relaxometry in brain tissue1Department of Biomedical Engineering, University of Basel, Basel, Switzerland, 2Division of Radioligical Physics, Department of Radiology, University of Basel Hospital, Basel, Switzerland
Synopsis
Brain relaxometry with phase-cycled bSSFP shows systematically lower T1 values, if compared to spoiled-GRE or inversion-recovery spin echo methods. One explanation can be the pronounced asymmetry in the bSSFP's frequency profile, observed for tissues. It was recently shown that this asymmetry decreases towards shorter TR, possibly leading to an adjustment of T1 estimates from bSSFP to spoiled-GRE. Here, it was investigated how T1 and T2 quantification is influenced by TR. Contrary to expectation, a stronger mismatch between bSSFP and spoiled-GRE was observed towards shorter TR. The origin of this mismatch can thus not be attributed to the bSSFP profile asymmetry.
Introduction
The concept of balanced steady-state free precession (bSSFP) has been first introduced by Carr1 in the late 1950s featuring a frequency response profile that is always symmetric around the on-resonance (e.g. see Freeman and Hill2). However, it was reported by Miller3 that especially white matter (WM) intrinsically exhibits a strong and rather unexpected asymmetry in its frequency response profile. This was attributed to local asymmetric intra-voxel frequency distributions3,4.Interestingly, brain tissue relaxometry using multiple phase-cycled bSSFP5,6,7 leads to systematically lower $$$T_1$$$ values than variable flip angle (VFA) spoiled gradient echo (spoiled-GRE). Because in the analytical model a symmetric frequency response is presumed, the observed asymmetric frequency response function may lead to the $$$T_1$$$ bias between bSSFP and spoiled-GRE. There have been approaches to symmetrize the profile by means of using neural networks8. In a previous work, however, it has been shown that the bSSFP profile becomes symmetric in the limit of $$$\mathrm{TR}\rightarrow 0$$$9. As a result, the effect of the profile asymmetry on bSSFP relaxometry can be investigated. Here, we compare $$$T_1$$$ estimates between VFA spoiled-GRE and multiple phase-cycled bSSFP as a function of TR and thus of the profile asymmetry at $$$1.5\,\mathrm{T}$$$.
Methods
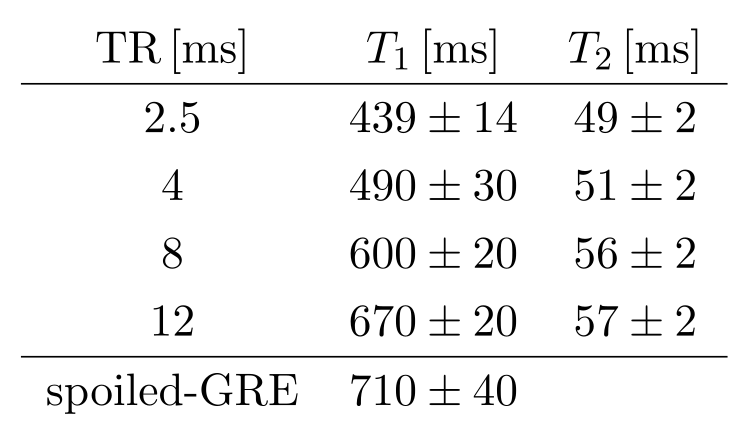
MRI: Imaging was performed at $$$1.5\,\mathrm{T}$$$, using a Cartesian ultrafast bSSFP sequence10. Scans were performed on in vivo brain where a strong profile asymmetry is usually observed. Four different values of $$$\mathrm{TR}\ (2.5\,\mathrm{ms}, 4\,\mathrm{ms}, 8\,\mathrm{ms}$$$ and $$$12\,\mathrm{ms})$$$ were used. The same bandwidth $$$(1628\,\mathrm{Hz/px})$$$ was used for all $$$\mathrm{TR}$$$. $$$N$$$ scans with equally distributed linear RF phase increments were recorded. A dummy preparation period of $$$4\,\mathrm{s}$$$ was used to ensure steady state conditions. A field-of-view of $$$256$$$ with $$$75\,\%$$$ resolution in phase direction, a base resolution of $$$128$$$ and a slice thickness of $$$2.0\,\mathrm{mm}$$$ were chosen, yieding an image matrix of $$$128\times80$$$ and an isotropic resolution of $$$2.0\,\mathrm{mm}$$$. To minimize finite pulse effects, the pulse length was set to $$$200\,\mu\mathrm{s}$$$. In order to counteract magnetization transfer effects, the flip angle was set to $$$\alpha=10^{\circ}$$$. Consequently, the quantification was done with $$$N=12$$$ to account for the low flip angle. To depict the profile asymmetry $$$N=36$$$ was used for the shortest and longest $$$\mathrm{TR}$$$. Five averages were taken for $$$\mathrm{TR}=2.5\,\mathrm{ms}$$$, three for $$$\mathrm{TR}=4\,\mathrm{ms}$$$ and two for $$$\mathrm{TR}=8\,\mathrm{ms}$$$. Scanning took $$$30\,\mathrm{min}\ (\mathrm{TR}=2.5\,\mathrm{ms})$$$, $$$9\,\mathrm{min}\ (\mathrm{TR}=4\,\mathrm{ms})$$$, $$$14\,\mathrm{min}\ (\mathrm{TR}=8\,\mathrm{min})$$$ and $$$27\,\mathrm{min}\ (\mathrm{TR}=12\,\mathrm{ms})$$$ to complete.Additionally, a spoiled-GRE sequence was recorded in order to compute $$$T_1$$$ via the variable flip angle (VFA) method. Resolution parameters were the same as above and $$$\mathrm{TR} = 7000\,\mathrm{ms}$$$ was used with flip angles $$$\alpha = \{4^{\circ},16^{\circ}\}$$$. The acquisition took $$$1:35\,\mathrm{min}$$$ per flip angle.
A $$$B_1$$$ measurement was done to correct for $$$B_1$$$ inhomogeneities.
Quantification: The obtained phase-cycled datasets were $$$12$$$-point Fourier transformed to obtain the modes in configuration space11. $$$T_1$$$ and $$$T_2$$$ were then calculated from the mode ratios of the lowest order modes $$$F_0$$$, $$$F_{-1}$$$ and $$$F_1$$$12.
The spoiled-GRE data was evaluated using DESPOT113 to obtain $$$T_1$$$ via the VFA method.
Both calculations were $$$B_1$$$-corrected.
Results/Discussion
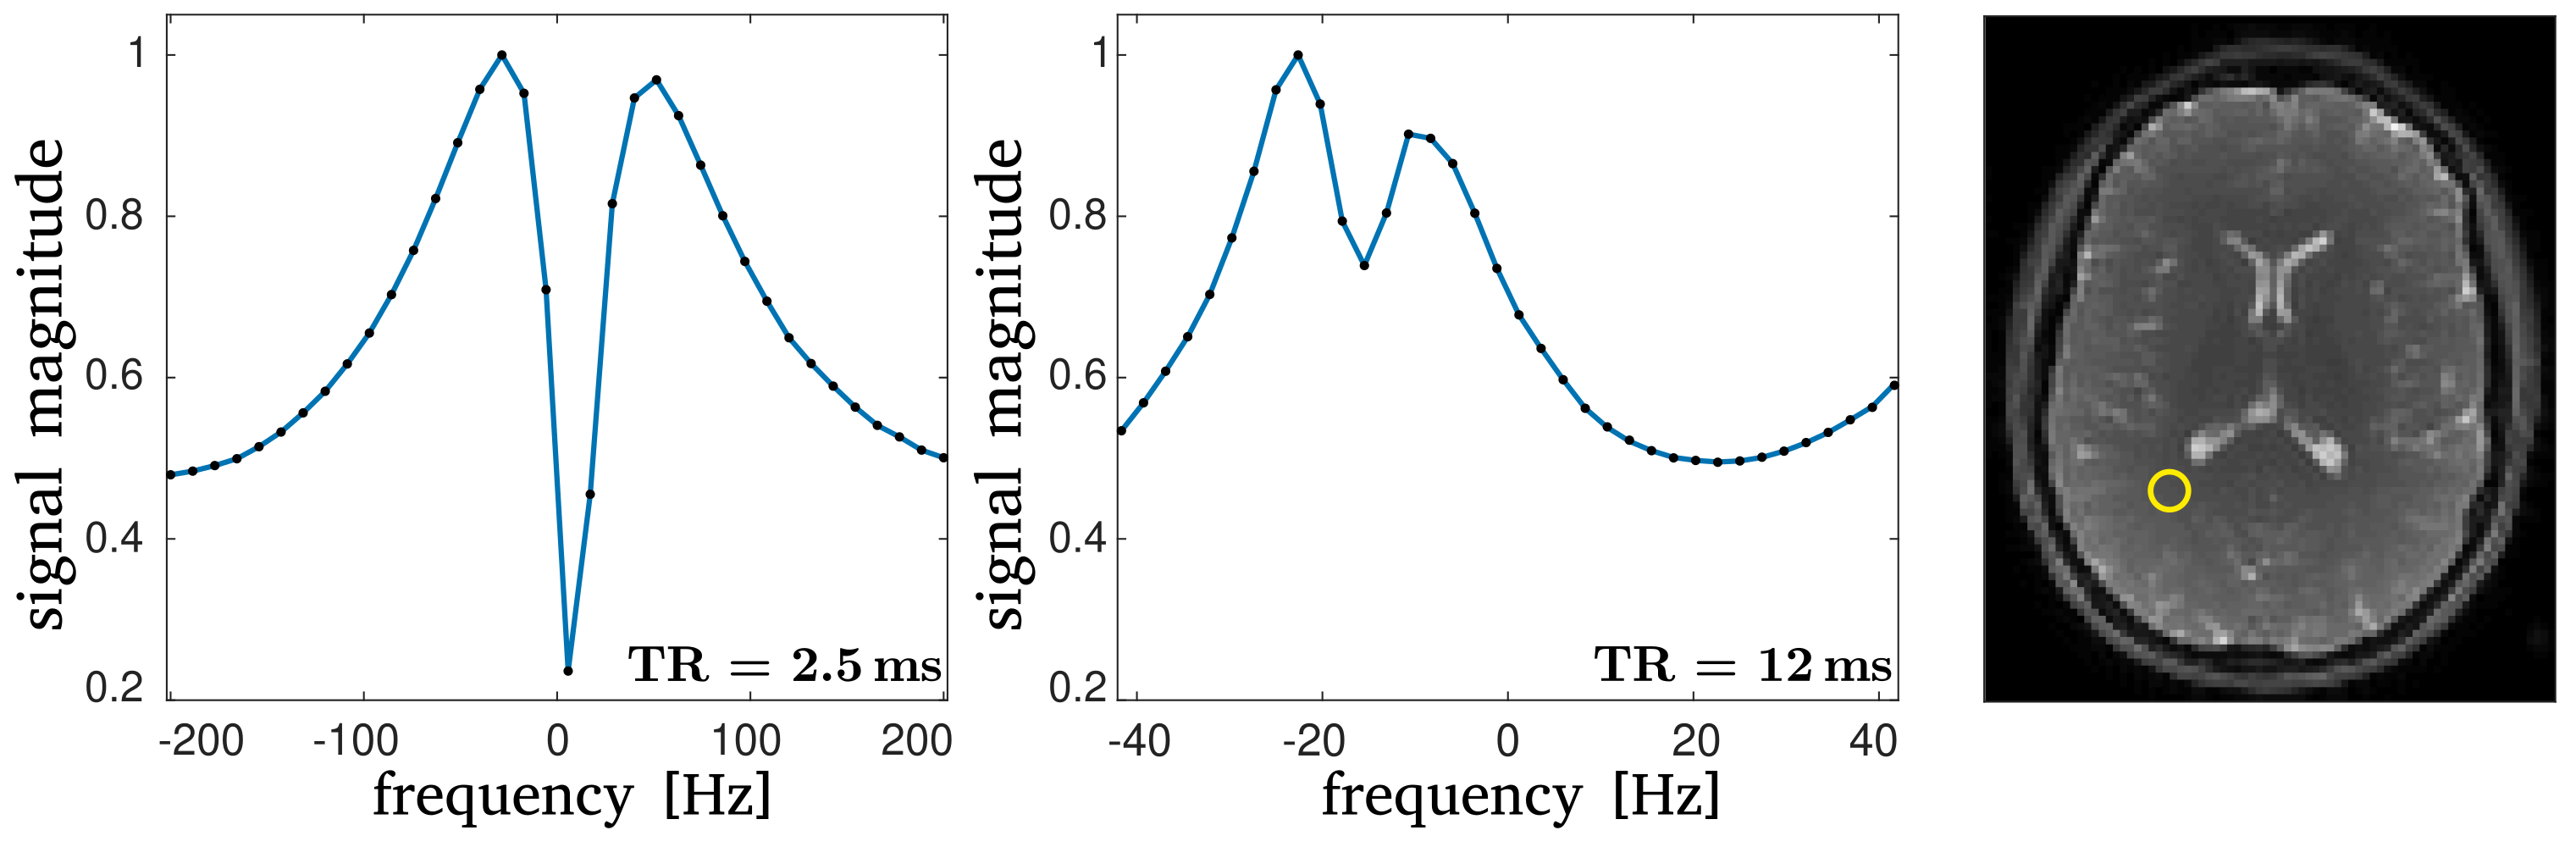
Fig. 1 shows the bSSFP profiles for $$$\mathrm{TR} = 2.5\,\mathrm{ms}$$$ and $$$TR = 12\,\mathrm{ms}$$$ in WM. An asymmetric profile is observed for $$$\mathrm{TR} = 12\,\mathrm{ms}$$$, while the profile is almost symmetric for $$$TR = 2.5\,\mathrm{ms}$$$. This provides a good foundation to investigate the change in quantification with decreasing asymmetry.In Fig. 2, the $$$T_1$$$ and $$$T_2$$$ maps for all TR are shown. Additionally, the $$$T_1$$$-map, obtained via the VFA method is shown, as well as an anatomical reference, obtained by taking the sum-of-squares from the $$$\mathrm{TR}=12\,\mathrm{ms}$$$ scan. Averaged $$$T_1$$$ and $$$T_2$$$ values from a WM ROI, which is drawn in the spoiled-GRE image in Fig. 2, are summarized in Fig. 3. As can be seen from these values, the expected improvement in matching the quantification of phase-cycled bSSFP and spoiled-GRE towards a symmetric profile is not observed. In fact, $$$T_1$$$ values decrease with decreasing TR, therefore deviating stronger from the spoiled-GRE result, despite the improvement of profile symmetry. $$$T_2$$$ seems to be less affected by this, but also slightly decreases towards lower $$$\mathrm{TR}$$$. Overall, this behaviour indicates that there are other effects, which have a stronger influence on quantification than the profile asymmetry. One possible reason could be the biexponential longitudinal relaxation14 and the multiexponential $$$T_2$$$-decay in myelin15. How exactly these are influenced by a change of $$$\mathrm{TR}$$$ is unclear and needs to be investigated by incorporating these models into the quantification.
Conclusion
The expected matching of phase-cycled bSSFP and spoiled-GRE $$$T_1$$$ quantification towards symmetric bSSFP profiles at lower $$$\mathrm{TR}$$$ could not be confirmed. On the contrary, a stronger mismatch of phase-cycled bSSFP and spoiled-GRE $$$T_1$$$ values for shorter $$$\mathrm{TR}$$$ was observed. This suggests that there are other underlying phenomena, most likely the multi-compartment tissue behaviour of $$$T_1$$$ and $$$T_2$$$ in WM, which need to be investigated.Acknowledgements
This work was supported by the Swiss National Science Foundation (SNF grant No. 325230_182008).References
1. Carr H. (1958). Steady-state free precession in nuclear magnetic resonance. Physical Review. 112(5):1693.
2. Freeman R., Hill H.D.W. Phase and intensity anomalies in Fourier transform NMR. J MagnReson. 1971;4:366-383.
3. Miller K. L. (2010). Asymmetries of the balanced SSFP profile. Part I: theory and observation. Magn Reson Med. 63(2):385-395.
4. Miller K. L., Smith S. M., Jezzard P. Asymmetries of the balanced SSFP profile. Part II: white matter. Magn Reson Med. 2010;63:396-406.
5. Nguyen D., Bieri O. Motion-insensitive rapid configuration relaxometry. Magn Reson Med. 2017;78:518-526.
6. Shcherbakova Y., van den Berg C. A., Moonen C. T., Bartels L. W. PLANET: an ellipse fitting approach for simultaneous T1 and T2 mapping using phase-cycled balanced steady-state free precession. Magn Reson Med. 2018;79:711-722.
7. Shcherbakova Y., van den Berg C. A., Moonen C. T., Bartels L. W. On the accuracy and precision of PLANET for multiparametric MRI using phase-cycled bSSFP imaging. MagnReson Med. 2019;81:1534-1552.
8. Heule R., Bause J., Pusterla O., Scheffler K. Multi-parametric artificial neural network fitting of phase-cycled balanced steady-state free precession data. Magn Reson Med. 2020;84:2981-2993.
9. Schäper J., Bauman G., Ganter C. Bieri O. Pure balanced steady-state free precession (bSSFP) imaging. Proceedings of 29th ISMRM, 2021, no. 4195.
10. Bieri O. Ultra-fast steady state free precession and its application to in vivo (1)H morphological and functional lung imaging at 1.5 tesla. Magn Reson Med. 2013;70:657-63.
11. Vlaardingerbroek M.T., Boer J.A. Magnetic Resonance Imaging: Theory and Practice. In: Partitioning of the Magnetization into Configurations. 3rd ed. Springer-Verlag Berlin Heidelberg GmbH. 2003. pp.423-466.
12. Heule R., Ganter C., Bieri O. Triple echo steady-state (TESS) relaxometry. Magn ResonMed. 2014;71:230-237.
13. Deoni S. C., Rutt B. K., Peters T. M. (2003). Rapid combined T1 and T2 mapping using gradient recalled acquisition in the steady state. Magn Reson Med. 2003;49:515-526.
14. Rioux J. A., Levesque I. R., Rutt B. K. Biexponential longitudinal relaxation in white matter: characterization and impact on T1 mapping with IR-FSE and MP2RAGE. Magn Reson Med. 2016;75:2265-2277.
15. Vasilescu V., Katona E., Simplaceanu V., Demco, D. Water compartments in the myelinated nerve. III. Pulsed NMR result. Experientia. 1978;34:1443-1444.
Figures