1268
High-resolution T1 atlas for subject-specific abnormality detection at 7T1Advanced Clinical Imaging Technology, Siemens Healthcare AG, Lausanne, Switzerland, 2Department of Radiology, Lausanne University Hospital and University of Lausanne, Lausanne, Switzerland, 3LTS5, École Polytechnique Fédérale de Lausanne (EPFL), Lausanne, Switzerland, 4Support Center for Advanced Neuroimaging, Institute for Diagnostic and Interventional Neuroradiology, Inselspital, Bern University, Bern, Switzerland, 5Translational Imaging Center, sitem-insel AG, Bern, Switzerland, 6Advanced Clinical Imaging Technology, Siemens Healthcare AG, Bern, Switzerland, 7Magnetic Resonance Methodology, Institute of Diagnostic and Interventional Neuroradiology, University of Bern, Bern, Switzerland, 8Department of Neuroradiology, Medical Center – University of Freiburg, Faculty of Medicine, University of Freiburg, Freiburg, Germany, 9Siemens Healthcare Pvt. Ltd., Bangalore, India
Synopsis
Previous studies at 3T have shown that T1 relaxometry enables personalized characterization of brain tissues by comparing physical properties of a single patient to a normative atlas. Ultra-high field imaging allows exploiting this concept at even higher resolutions, which can be crucial to detect certain diseases. To this end, here we established an atlas of normative T1 values at 7T from acquisitions with 0.6$$$\times$$$0.6$$$\times$$$0.6 mm3 isotropic resolution. Additionally, the clinical potential and improvement of 7T vs. 3T imaging is shown in two case reports from patients scanned at both field strengths.
Introduction
The hardware independency and improved reproducibility of quantitative MRI in comparison to conventional imaging enables the comparison of physical tissue properties to normal values in a single patient1–3. In multiple sclerosis (MS), for example, previous studies at 3T have shown that relaxation time deviations from normative atlases are more strongly correlated with disability than conventional MRI-based metrics4–6. Notably, in some diseases, it is essential to detect small focal abnormalities (e.g., in epilepsy). The improved SNR at 7T enables higher resolutions and can thus add clinical value in this context. As relaxation times change across field strengths, new field-strength-specific atlases of normative values are needed.In this study, we establish an atlas of normative T1 values at 7T with 0.6$$$\times$$$0.6$$$\times$$$0.6 mm3 isotropic resolution. Example deviation maps are evaluated in two patients scanned both at 3T and 7T; in a case study setting, resulting T1 deviations from the respective normative atlases are compared between field strengths.
Methods
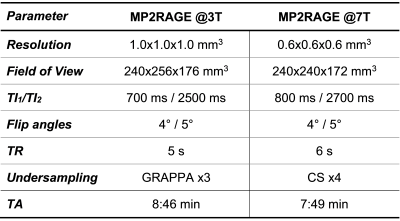
Study population and MR protocolTwo separate healthy cohorts underwent MR examination at different field strengths:
- 3T (MAGNETOM Prisma, Siemens Healthcare, Erlangen, Germany): 201 subjects (123 females, median age = 31 y/o, range = [20-64] y/o);
- 7T (MAGNETOM Terra, Siemens Healthcare, Erlangen, Germany): 19 subjects (11 females, median age = 28 y/o, range = [15-72] y/o).
Image processing
The MP2RAGE UNI images were skull-stripped and white matter (WM) a posteriori probability maps were estimated using the prototype software MorphoBox8, whose pipeline was adapted to reliably segment brain tissues from UNI images at 7T9. A separate study-specific template (SST) was built for the two healthy cohorts using the Advanced Normalization Tools (ANTs)10,11. Skull-stripped UNI images of the healthy subjects were then spatially registered onto the respective SST, and the estimated transformation was applied to the T1 maps and WM probability maps.
Normative atlases
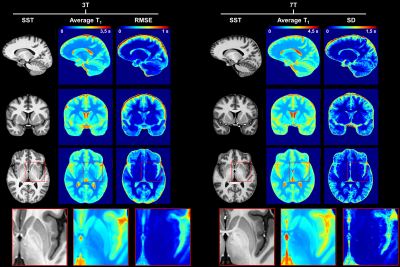
In the SST space, an atlas of reference T1 values in healthy tissues was established by modeling the T1 inter-subject variability with age and sex: $$\mathit{E}\left\{T_{1}\right\}=\ {\beta}_0+\beta_{sex}\ast sex+\beta_{age}\ast age+\beta_{{age}^2}\ast{age}^2$$ with $$$\beta_{0}$$$ being the model intercept, sex = 1 if the subject is male, 0 if female. At 3T, the age was centered at the mean age of the healthy cohort (35 y) and root mean squared errors (RMSE) were evaluated as an estimation of the standard deviation (SD) of the residuals error across the linear model. At 7T, given the small size of the healthy cohort and the sparse coverage of the age range, a simple average and SD were considered for the atlas modelling.
A WM prior was computed in both SST spaces by averaging the spatially normalized WM probability maps of the healthy subjects and used to restrict our analysis to WM voxels to mitigate the amount of false‐positives in the brain cortex3.
Single-subject comparison
To investigate the advantage of single-subject comparison at 7T, deviations from established atlases were calculated voxel-wise and expressed in z-score maps in the two case reports scanned at both field strengths.
Results
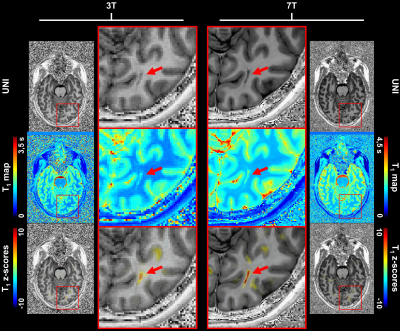
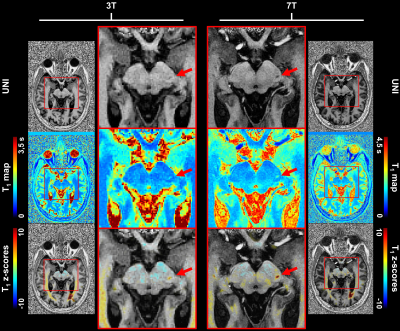
Example slices of the established T1 atlases are shown in Figure 1. To illustrate the expected relaxation times, average T1 values in WM were found to be: E{T1,3T} ± RMSE3T = 815 ± 42 ms, E{T1,7T} ± SD7T = 1203 ± 60 ms. A similar coefficient of variation (COV) was thus observed at 3T and 7T, respectively 5.1% and 5.0%.Z-score maps evaluated in the two patients are displayed in Figure 2 and Figure 3. In the epileptic patient, 7T MRI allowed to better delineate the potential epileptogenic structural lesion and the surrounding alteration of myelination in the occipital lobe, which were detected by the proposed single-subject comparison at both field strengths (zT1,3T = 4.27 ± 1.14; zT1,7T = 4.96 ± 2.06), but with increased conspicuity at 7T (see Figure 2). In the MS patient, T1 alterations were automatically detected by the proposed method, with small focal changes being better delineated at 7T, as shown in Figure 3.
Discussion and Conclusion
In this work, we established an atlas of normative T1 values at 7T for the personalized detection and characterization of brain T1 alterations. Despite the small sample size, the atlas proved valuable in revealing tissue deviations from the normative atlases in single‐subject comparisons, showing greater detail compared to the 3T atlas. Future work should focus on expanding the enrolled healthy cohort to cover the whole adult age range and better model T1 variations with age. Additionally, these preliminary results should be validated in larger cohorts. However, the similar COV observed between the atlases at 3T and 7T, makes already the new atlas a promising tool for the detection of subtle alterations that are not visible in conventional MR, as previously shown at 3T3,4, but at higher resolution.Acknowledgements
No acknowledgement found.References
1. Warntjes JBM, Engström M, Tisell A, Lundberg P. Brain Characterization Using Normalized Quantitative Magnetic Resonance Imaging. PLoS One. 2013;8(8). doi:10.1371/journal.pone.0070864
2. Bonnier G, Fischi-Gomez E, Roche A, et al. Personalized pathology maps to quantify diffuse and focal brain damage. NeuroImage Clin. 2019;21:101607. doi:10.1016/j.nicl.2018.11.017
3. Piredda GF, Hilbert T, Granziera C, et al. Quantitative brain relaxation atlases for personalized detection and characterization of brain pathology. Magn Reson Med. 2020;83(1):337-351. doi:10.1002/mrm.27927
4. Piredda GF, Hilbert T, Vaneckova M, et al. Periventricular gradients of brain pathology in early and progressive MS revealed by qMRI. In: Proceedings of the International Society of Magnetic Resonance in Medicine. 2021. Abstract number: 2795.
5. Ravano V, Piredda GF, Vaneckova M, et al. T1 abnormalities in atlas-based white matter tracts: reducing the clinico-radiological paradox in multiple sclerosis using qMRI. In: Proceedings of the International Society of Magnetic Resonance in Medicine. 2021. Abstract number: 2796.
6. Piredda GF, Hilbert T, Vaneckova M, et al. Quantitative T1 deviations in brain lesions and NAWM improve the clinico-radiological correlation in early MS. In: MULTIPLE SCLEROSIS JOURNAL. Vol 26. SAGE PUBLICATIONS LTD 1 OLIVERS YARD, 55 CITY ROAD, LONDON EC1Y 1SP, ENGLAND; 2020:418.
7. Marques JP, Kober T, Krueger G, van der Zwaag W, Van de Moortele P-F, Gruetter R. MP2RAGE, a self bias-field corrected sequence for improved segmentation and T1-mapping at high field. Neuroimage. 2010;49(2):1271-1281. doi:10.1016/j.neuroimage.2009.10.002
8. Schmitter D, Roche A, Maréchal B, et al. An evaluation of volume-based morphometry for prediction of mild cognitive impairment and Alzheimer’s disease. NeuroImage Clin. 2015;7:7-17. doi:10.1016/j.nicl.2014.11.001
9. Piredda GF, Venkategowda PB, Radojewski P, et al. Automated brain morphometry for sub-millimeter 7T MRI using transfer learning. Submitted in Parallel to ISMRM 2022.
10. Avants BB, Tustison NJ, Song G, Cook PA, Klein A, Gee JC. A reproducible evaluation of ANTs similarity metric performance in brain image registration. Neuroimage. 2011;54(3):2033-2044.
11. Avants BB, Yushkevich P, Pluta J, et al. The optimal template effect in hippocampus studies of diseased populations. Neuroimage. 2010;49(3):2457-2466.
Figures


