1267
Magnetisation transfer saturation (MTsat) and MTR: relationship with T1 recovery in multiple sclerosis and healthy brain1Centre for Clinical Brain Sciences, University of Edinburgh, Edinburgh, United Kingdom
Synopsis
Magnetisation transfer saturation (MTsat) shows improved tissue contrast compared with magnetisation transfer ratio (MTR), due to T1 correction, and is more sensitive to subtle myelin loss in multiple sclerosis (MS). It is not clear how MTsat performs in severely demyelinated tissue with markedly increased T1. We examine the relationship between T1app, MTsat and MTR in healthy and MS brains. We show a negative linear relationship between MTsat and T1app in white matter, which breaks down in grey matter and white matter lesions. MTsat is sensitive to modest myelin disruption, while T1app may better reflect severe damage in MS lesions.
Introduction
Non-invasive in vivo biomarkers are needed to detect myelin damage in multiple sclerosis (MS), for early disease stratification and as platforms for therapeutic trials of neuroprotective and remyelinating agents. Magnetisation transfer imaging (MTI) is sensitive to myelin integrity; the MTI signal is measured indirectly from protons bound to macromolecules1 (e.g. lipids) with short T2 (~10μs), which are not typically detected on conventional MR imaging.The derived magnetisation transfer ratio (MTR) has been extensively applied in clinical MS studies,2 but is susceptible to T1 effects; biological interpretation of longitudinal changes in MTR is therefore challenging.
Magnetisation transfer saturation (MTsat) inherently corrects for T1 recovery3 and thus overcomes some limitations of MTR. It requires the acquisition of an additional T1-weighted image, from which T1 rates can be approximated (apparent T1, T1app).
A comparison of the relationship between T1 and MT measures would allow a better understanding of the context in which T1 correction may be advantageous. The aim of this study was to examine the influence of T1 on MTR and MTsat in the healthy brain and patients with MS.
Methods
Healthy volunteers (n=11, 7 female, mean age 45 years) and patients with relapsing-remitting MS (n=77, 61 female, mean age 37.2 years), recruited as part of a longitudinal cohort study of recently diagnosed MS (Future-MS4,5), were imaged on a 3.0 T Siemens Prisma MR system at the Edinburgh Imaging Facility (RIE). Ethical approval was approved by the local Research Ethics Committee and written informed consent obtained.Structural imaging included: a sagittal 3D T1-weighted MPRAGE (1mm isotropic, 256 x 256 mm, 176 slices) and an axial 2D T2-weighted FLAIR (1 x 1 x 3mm, 256 x 256 mm, 60 slices). Multiparametric mapping consisted of three consecutive 3D gradient-echo fast low angle shot (FLASH) sequences: proton-density weighted images with and without an MT saturation pulse (SMT and SPD, respectively, pulse offset of 1.2kHz from water frequency, TR=30ms, α=5°), plus an additional T1-weighted image (ST1w, TR=15ms, α=18°). Full protocol details are available elsewhere.4
Data processing consisted of skull-stripping and bias-correction of the T1-weighted MPRAGE (FSL BET, v6.0.1, http://www.fmrib.ox.ac.uk/fsl), and manual editing (ITK-SNAP, v3.6 http://www.itksnap.org) to remove erroneous voxels. Segmentation of white and cortical grey matter was performed with FreeSurfer (v6.0, https://surfer.nmr.mgh.harvard.edu/). For patients, white matter lesions visible on T2 FLAIR were automatically segmented using an adapted intensity-based thresholding method,4 manually corrected and subtracted from tissue masks.
MTR maps were calculated as: $$$MTR=100\cdot\frac{S_{PD}-S_{MT}}{S_{PD}}$$$. MTsat and T1app maps were derived according to Helms et al..3 Tissue segmentations were registered to the SPD image (FSL FLIRT). To reduce the influence of partial volumes, white matter masks were eroded by one voxel; grey matter and lesion segmentations were not eroded due to their small volumes.
Tissue segmentations were applied to each map using RNifti (RStudio v1.2.5033). Two-dimensional normalised density histograms were used to visually compare voxelwise parametric values on a cohort-level for healthy controls (white and grey matter) and separately for MS patients (white matter lesions).
Results
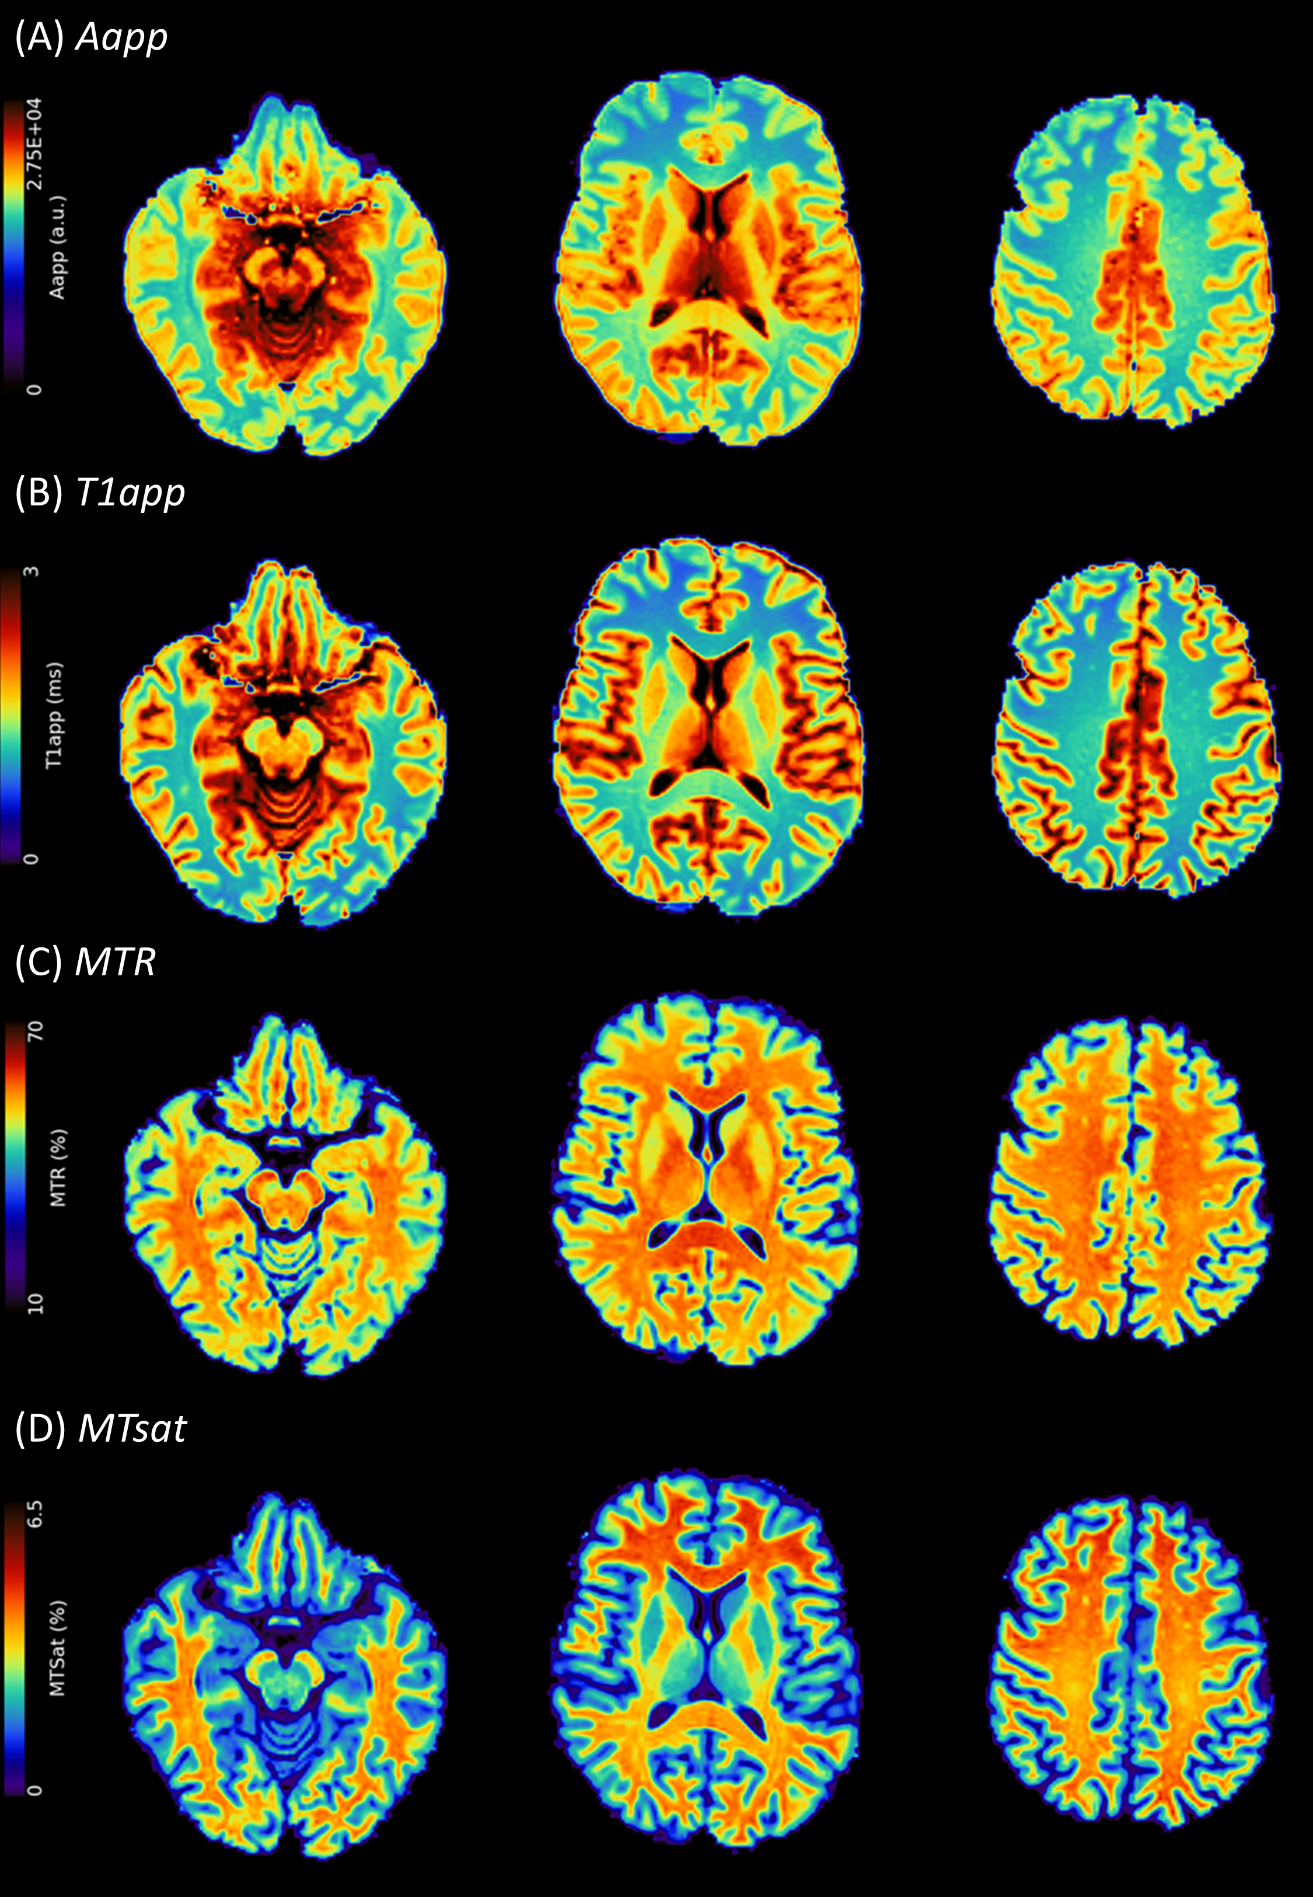
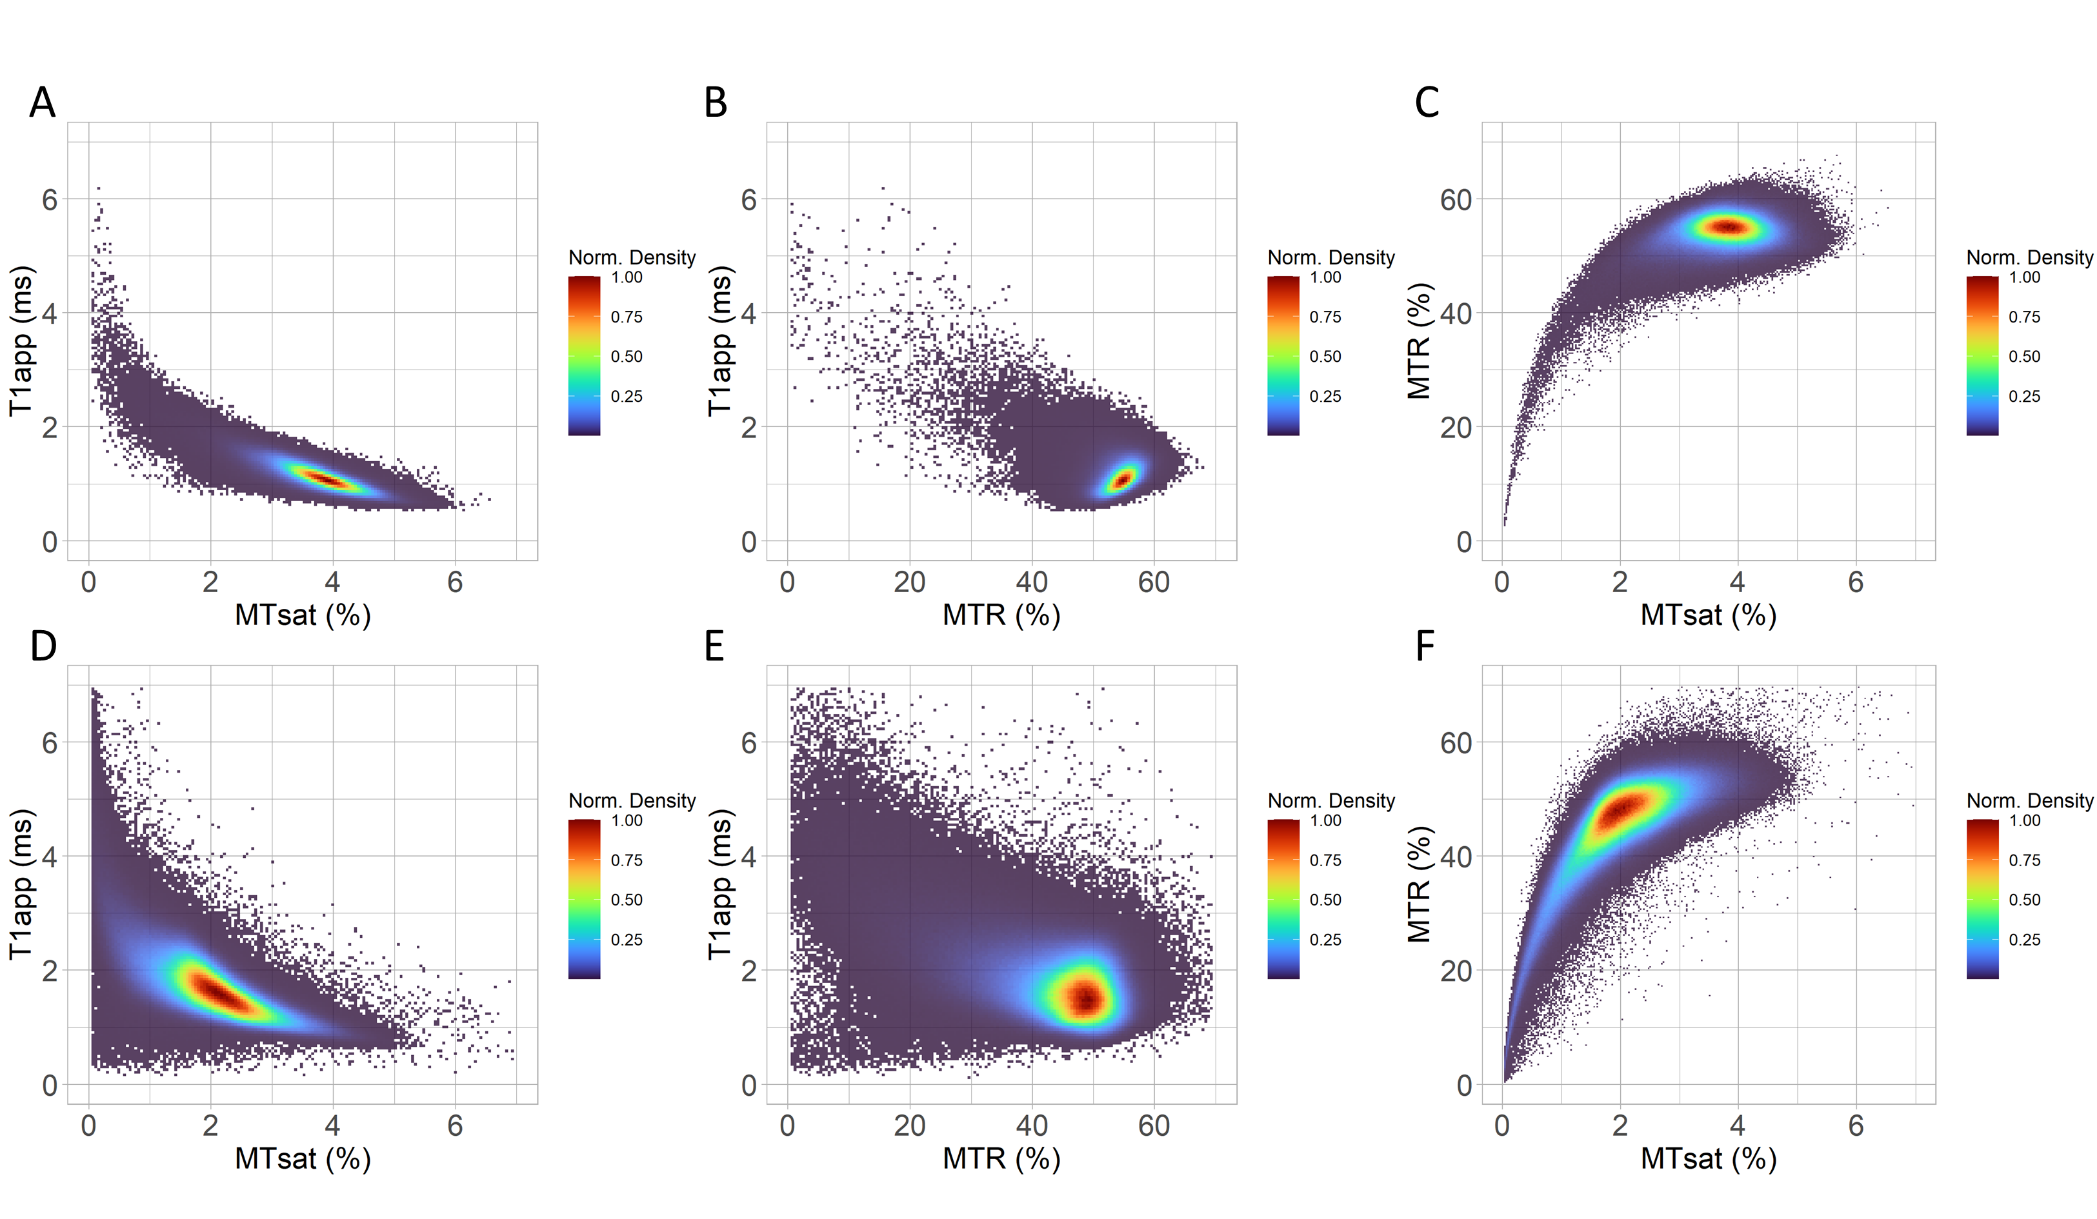
Example images (Figure 1) for a healthy volunteer show (A) approximation of the signal amplitude, Aapp; (B) approximation of T1 relaxation, T1app; (C) MTR; and, (D) MTsat. Grey and white matter contrast is visibly better for MTsat compared with MTR.In healthy volunteers, there was a strong negative linear relationship between MTsat and T1app in white matter (Figure 2A) compared with a weak positive linear relationship between MTR and T1app (Figure 2B). There was no clear relationship between MTR and MTsat in densely myelinated healthy white matter (Figure 2C).
In healthy grey matter, the relationship between MTsat and T1app was weaker, and showed some deviation from linearity (Figure 2D). There was no obvious relationship between MTR and T1app (Figure 2E). MTR and MTsat are non-linearly related in areas of low myelination (MTsat <2% and MTR <45%, Figure 2F).
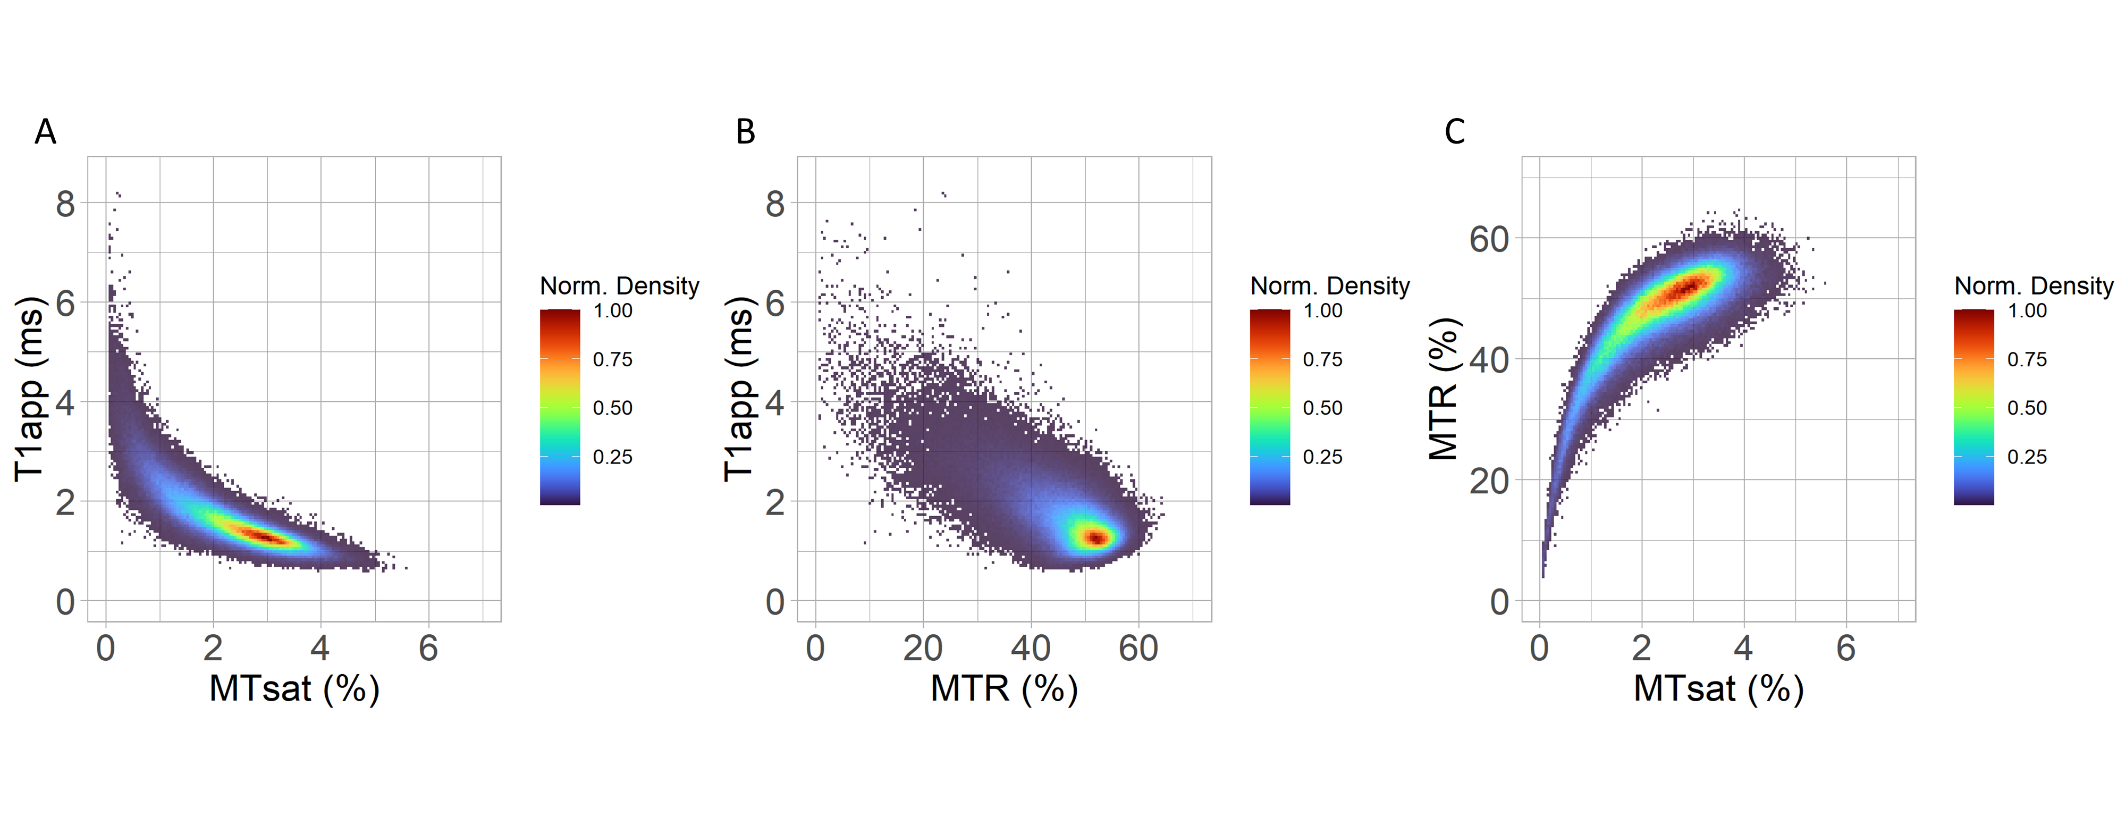
In patients with relapsing-remitting MS, a strong linear relationship was seen with T1app within white matter lesions in areas with low T1app (<2ms, Figure 3A). In areas with high T1app, however, the relationship with T1app becomes non-linear. For MTR, a weak negative linear relationship may be seen as T1app increases in white matter lesions.
Discussion
The strong negative linear relationship between MTsat and T1app observed in healthy brains leads to increased contrast between sparsely myelinated grey matter and densely myelinated white matter. In MS, this relationship also improves the visibility of subtle loss of myelin integrity compared with MTR. In severely demyelinated lesions , however, the ‘bound’ proton pool is depleted, and T1 effects dominate variation in signal. Such lesions are typically characterised as ‘black holes’ on T1-w imaging (because of T1 prolongation).Although MTR shows a weak positive relationship with T1app in healthy white matter, a weak negative relationship with T1app is seen in white matter lesions and, to a lesser extent, in grey matter. Biological interpretation of longitudinal changes in MTR may therefore be confounded by concomitant changes in T1.
Conclusion
MTR is significantly confounded by T1 effects. MTsat is a sensitive in vivo biomarker of subtle demyelination in relapsing-remitting MS, however T1 measures may provide more relevant indices in lesions where myelin disruption is severe.Acknowledgements
Chief Scientist Office Scottish PhD Research & Innovation Network Traineeships Motor Neuron Disease/Multiple Sclerosis Studentship
NHS Lothian Research and Development Office
Anne Rowling Regenerative Neurology Clinic, Edinburgh
Future-MS, hosted by Precision Medicine Scotland Innovation Centre (PMSIC) and funded by a grant from the Scottish Funding Council to PMS-IC and Biogen Idec Ltd Insurance (combined funding under reference Exemplar SMS_IC010). With special thanks to all Future-MS participants who have made this study possible.
Radiographers at the Edinburgh Imaging Facility RIE
References
1. Wolff SD, Balaban RS. Magnetization transfer contrast (MTC) and tissue water proton relaxation in vivo. Magn Reson Med. 1989;10(1):135-144
2. York EN, Thrippleton MJ, Meijboom R, Hunt DP, Waldman AD. Quantitative magnetisation transfer imaging in relapsing-remitting multiple sclerosis: a systematic review and meta-analysis. medRxiv pre-print. 2021 Jan 1.
3. Helms G, Dathe H, Kallenberg K, Dechent P. High‐resolution maps of magnetization transfer with inherent correction for RF inhomogeneity and T1 relaxation obtained from 3D FLASH MRI. Magnetic Resonance in Medicine: An Official Journal of the International Society for Magnetic Resonance in Medicine. 2008 Dec;60(6):1396-407.
4. Meijboom R, Wiseman SJ, York EN, Bastin ME, Hernandez MD, Thrippleton MJ, Mollison D, White N, Kampaite A, Kwong KC, Gonzalez DR. Rationale and design of the brain magnetic resonance imaging protocol for FutureMS: a longitudinal multi-centre study of newly diagnosed patients with relapsing-remitting multiple sclerosis in Scotland. medRxiv. 2021 Jan 1.
5. Kearns PK, Martin SJ, Chang YT, Meijboom R, York EN, Chen Y, Weaver C, Stenson A, Freyer E, Hafezi K, Harroud A. FutureMS Cohort Profile: A Scottish Multi-Centre Inception Cohort Study of Relapsing-Remitting Multiple Sclerosis. medRxiv. 2021 Jan 1.
Figures