1266
Feasibility of fast whole brain T2 mapping using CAIPIRINHA accelerated SPACE sequences1Department of Neuroradiology, Medical University of Innsbruck, Innsbruck, Austria, 2Department of Radiology, Medical University of Innsbruck, Innsbruck, Austria, 3UBC MRI Research Centre, University of British Columbia, Vancouver, BC, Canada
Synopsis
We investigated whether multiple SPACE sequences accelerated using CAIPIRINHA and acquired with different echo times can be used to obtain high resolution isotropic whole brain T2 maps within a clinical feasible scan time. In a phantom study, we could show that the SPACE based T2 values are comparable with T2 values derived using multiple single spin echo sequences. By reducing the number of echoes we could acquire 1 mm isotropic in vivo whole brain T2 maps in under 3 minutes.
Introduction
T2 relaxation times of brain tissue contain valuable information to characterize tissue properties and to distinguish different pathologies, such as stroke, multiple sclerosis and cancer, among others.1–3 However, the computation of quantitative T2 maps of the in vivo brain is challenging. Commonly, T2 relaxation times are quantified using multi-echo spin echo sequences with subsequent fitting of a mono-exponential or multi-exponential signal model to the measured data. Moreover, multi-echo spin echo sequences are affected by stimulated echoes and magnetization transfer effects4 and the use of multiple single spin echo sequences results in very long acquisition times.Therefore, several optimized 3D fast spin echo sequences, such as the SPACE sequence (Sampling Perfection with Application optimized Contrasts using different flip angle Evolutions) are proposed to acquire T2 images in clinical acceptable scan times.5,6 A disadvantage of the SPACE sequence is that only one echo can be acquired using the routinely available sequence. Thus, the aim of our study was to investigate whether the acquisition of multiple SPACE sequences with a constant flip angle mode at different echo times allows to quantify T2 relaxation times reliably.
Methods
Image acquisition was performed on a clinical 3T whole body MRI system (MAGNETOM Skyra, Siemens Healthineers, Erlangen, Germany) using a 64-channel head coil. In the first part of the study, we quantified T2 relaxation times of a phantom consisting of 3.75 g NiSO4 x 6H2O + 5 g NaCl per 1000 g H2O using the following three different sequences:(I) multiple single-echo spin echo sequences (single slice, TR = 1000 ms, TE = 13, 25, 51, 93, 122, 152, 186 and 211 ms, acquisition time per echo of 2:55 min)
(II) multiple 3D SPACE sequences (160 slices, TR = 1000 ms, TE = 13, 25, 51, 93, 122, 152, 186 and 211 ms, constant flip angle of 120 degree, turbo factor = 96 and four-fold CAIPHIRINA acceleration7,8, acquisition time per echo of 1:12 min)
(III) multi-echo spin echo sequence (single slice, 16 echoes, TE1 = 13 ms, deltaTE = 13 ms, TR = 1000 ms, acquisition time of 2:55 min)
All sequences had a resolution of 1x1x1 mm and a mono-exponential signal decay was assumed for computing the T2 maps. For the multi-echo spin echo sequence, the first echo was discarded prior to fitting the data.
In the second part of this study, we acquired multiple SPACE sequences with the same parameters as described above in a healthy volunteer and used varying echo numbers for the computation of the T2 maps. For T2 mapping, we used (I) eight echoes at TE = 13, 25, 51, 93, 122, 152, 186 and 211 ms which results in a total acquisition time of 9:36 min (II) six echoes at TE = 13, 25, 93, 122, 186 and 211 ms with a total acquisition time of 7:12 min (III) four echoes at TE = 13, 51, 122 and 186 ms, with a total acquisition time of 4:48 min and (IV) two echoes at TE = 13 and 122 ms resulting in a total acquisition time of 2:24 min. T2 relaxation times, quantified with varying echo numbers, are assessed in multiple gray and white matter brain regions for comparison.
Results
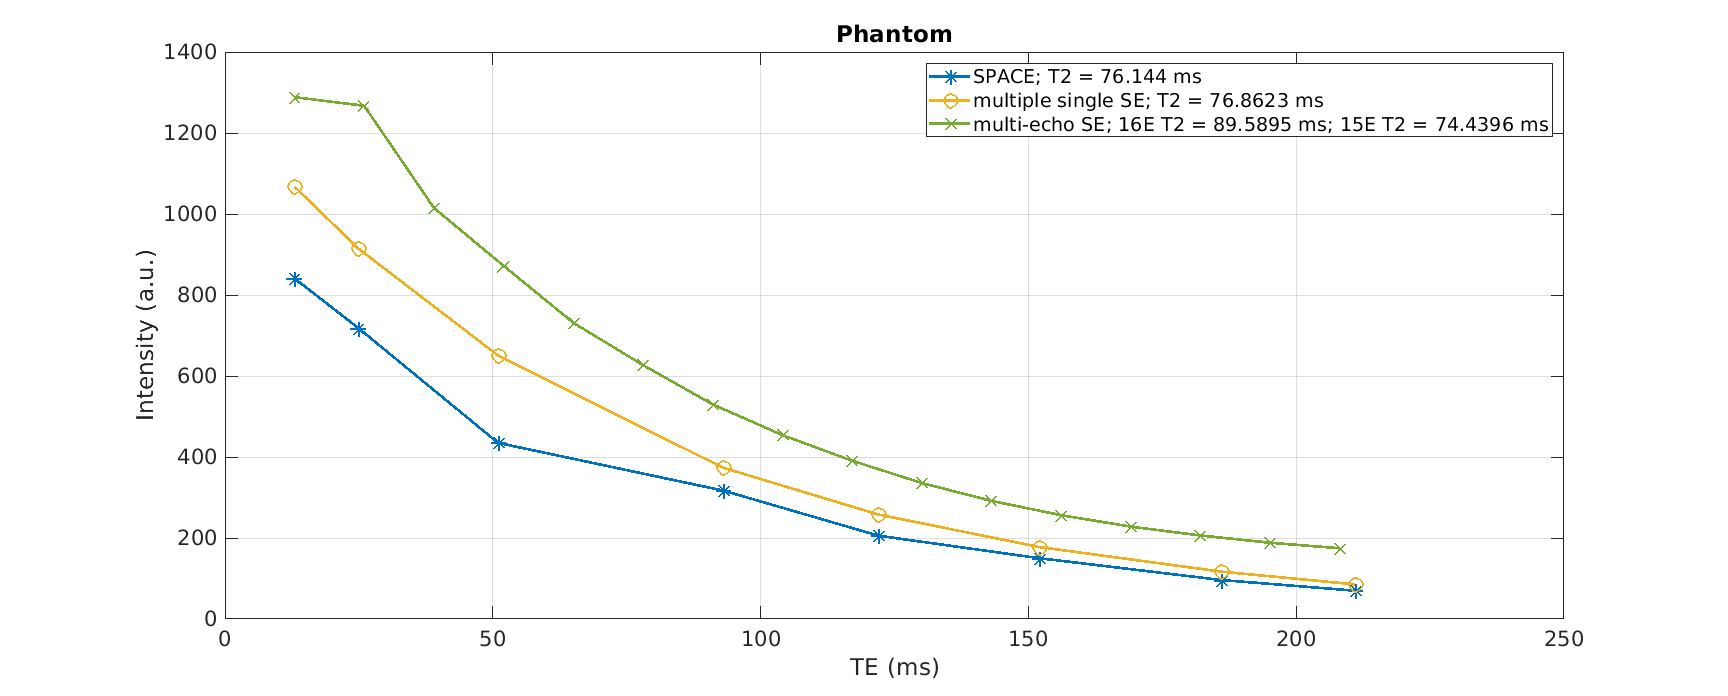
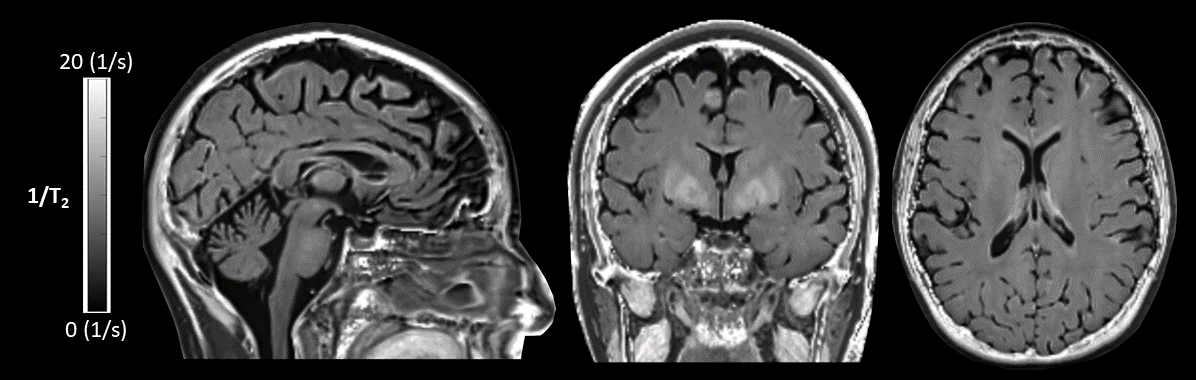
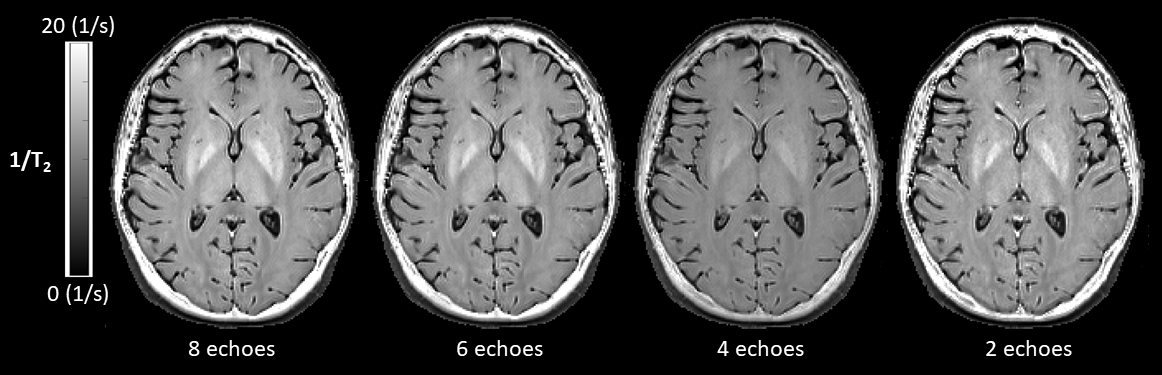
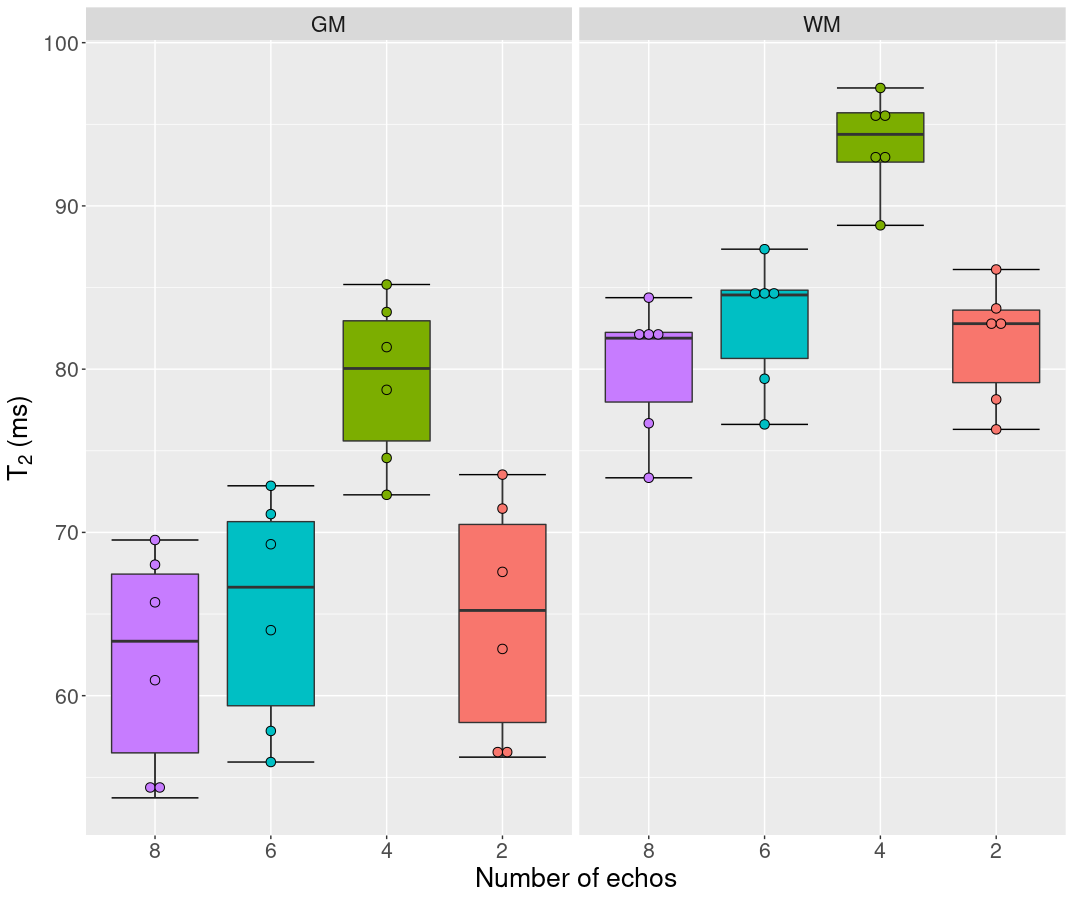
The T2 signal decay acquired in the phantom is shown in Figure 1. The corresponding T2 times of the phantom are 76.9±0.7 ms for the single spin echo approach, 76.1±0.9 ms for the SPACE approach and 74.4±0.3 ms for the multi-echo spin echo approach. There was a statistical significant difference between the single-echo spin echo and the multi-echo spin echo approach (p < 0.001) and between the multi-echo spin echo and SPACE approach (p = 0.006). There was no significant difference in the T2 times between the single-echo spin echo and the SPACE approach (p = 0.18). Figure 2 shows representative sagittal, coronal and axial 1/T2 maps of a healthy volunteer. T2 was fitted using all of the eight acquired echoes. In Figure 3, 1/T2 maps computed using eight, six, four and two echoes are compared, respectively. Decreasing the number of echoes used for fitting resulted in an increase in T2 times in gray matter (p < 0.001) and white matter (p < 0.001) as shown in Figure 4. However, using two echo times resulted in similar T2 values as using eight echo times for fitting T2 for gray matter (p = 0.54) and white matter (p = 0.51).Discussion and Conclusion
In this study, we could show that it is possible to compute high resolution isotropic whole brain T2 maps using multiple SPACE sequences within clinical feasible scan time. The estimated SPACE based T2 values are comparable to the gold standard approach of using multiple single spin echo sequences. Furthermore, if a mono-exponential signal decay is assumed, T2 maps based on two echoes lead to similar results than fitting eight echoes. This might have great potential for extending clinical routine protocols to compute quantitative T2 maps by adding a second fast T2 scan to the protocol. In conclusion, we showed that reliable 1 mm isotropic whole brain T2 maps based on two echoes can be acquired within 2:24 min using a SPACE sequence with four-fold CAIPHIRINA.Acknowledgements
No acknowledgement found.References
1. Siemonsen S, Finsterbusch J, Matschke J, Lorenzen A, Ding XQ, Fiehler J. Age-dependent normal values of T2* and T2′ in brain parenchyma. Am. J. Neuroradiol. 2008;29:950–955 doi: 10.3174/ajnr.A0951.
2. Laule C, Vavasour IM, Kolind SH, et al. Long T2 water in multiple sclerosis: what else can we learn from multi-echo T2 relaxation? J. Neurol. 2007;254:1579–1587 doi: 10.1007/S00415-007-0595-7.
3. Kern M, Auer TA, Picht T, Misch M, Wiener E. T2 mapping of molecular subtypes of WHO grade II/III gliomas. BMC Neurol. 2020;20 doi: 10.1186/S12883-019-1590-1.
4. Radunsky D, Blumenfeld-Katzir T, Volovyk O, et al. Analysis of magnetization transfer (MT) influence on quantitative mapping of T2 relaxation time. Magn. Reson. Med. 2019;82:145–158 doi: 10.1002/mrm.27704.
5. Mugler JP. Optimized three-dimensional fast-spin-echo MRI. J. Magn. Reson. Imaging 2014;39:745–767 doi: 10.1002/jmri.24542.
6. Mugler JP, Bao S, Mulkern R V., et al. Optimized single-slab three-dimensional spin-echo MR imaging of the brain. Radiology 2000;216:891–899 doi: 10.1148/radiology.216.3.r00au46891.
7. Kalia V, Fritz B, Johnson R, Gilson WD, Raithel E, Fritz J. CAIPIRINHA accelerated SPACE enables 10-min isotropic 3D TSE MRI of the ankle for optimized visualization of curved and oblique ligaments and tendons. Eur. Radiol. 2017;27:3652–3661 doi: 10.1007/S00330-017-4734-Y.
8. Breuer FA, Blaimer M, Mueller MF, et al. Controlled aliasing in volumetric parallel imaging (2D CAIPIRINHA). Magn. Reson. Med. 2006;55:549–556 doi: 10.1002/MRM.20787.
Figures