1265
Quantitative Relaxometry Metrics for Normal and Brain Tumor Tissues using MR Fingerprinting and Magnetic Resonance Image Compilation Methods
Amaresha Shridhar Konar1, Akash Deelip Shah2, Abhay Dave3, Suchandrima Banerjee4, Maggie Fung5, Vaios Hatzoglou2, and Amita Shukla-Dave1,2
1Medical Physics, Memorial Sloan Kettering Cancer Center, New York City, NY, United States, 2Radiology, Memorial Sloan Kettering Cancer Center, New York, NY, United States, 3Touro College of Osteopathic Medicine, New York, NY, United States, 4GE Healthcare, New York, NY, United States, 5GE Healthcare, New York City, NY, United States
1Medical Physics, Memorial Sloan Kettering Cancer Center, New York City, NY, United States, 2Radiology, Memorial Sloan Kettering Cancer Center, New York, NY, United States, 3Touro College of Osteopathic Medicine, New York, NY, United States, 4GE Healthcare, New York, NY, United States, 5GE Healthcare, New York City, NY, United States
Synopsis
This work aims to assess the relaxometry maps generated using MRF and MAGiC in brain tumor (n=27). A total of 14 brain tumor tissue regions (Pre-Tx n=5, Post-Tx n=9) were used for comparison. The T1 and T2 values measured at tumor and normal appearing (contralateral) region showed significant difference in both MAGiC and MRF generated maps. The results show that the relaxometry values estimated using MRF and MAGiC methods can differentiate Tumor and normal appearing tissues. The utility of this technique needs to be further explored in larger sample studies and it could be further extendable to classify tumor types.
Purpose:
Magnetic Resonance Fingerprinting (MRF)1 and Magnetic Resonance Image Compilation (MAGiC)2 provide rapid simultaneous quantification of multiple Quantitative Imaging (QI) metrics such as T1 and T2 relaxation times within a single MR acquisition. This work aims to evaluate and assess the utility of T1 and T2 maps generated using MRF and MAGiC in normal-appearing and brain tumor tissues.Method:
Patients: The institutional review board approved this prospective study for brain tumor patients (n = 27). Written informed consent was obtained from all eligible patients who enrolled between March 2019 and August 2021. All patients underwent conventional MRI with additional MRF and MAGiC sequence scans irrespective of the treatment time point (pre-treatment [Pre-Tx] n=5, post-treatment [Post-Tx] n=9). Data acquisition and Analysis: All the data were acquired on a 3T Discovery MR750w (GE Healthcare, USA). MRF acquisition parameters include FOV=25 cm, matrix=128x128, minimum TR=14.7 ms, Flip Angle (FA)=70°, number of slices=20 without a gap with the total scan time of 5.57 minutes. The scan parameters matched TR and FA list from Jiang et al.3. The 2-D MRF sequence with 979-time points, 89 shot variable density spiral with 732 points was used to acquire all the data with the desired range of T1 and T2 values for dictionary4 to generate the relaxometry maps. Followed by MAGiC acquisition which is a multiple-dynamic multiple-echo (MDME) sequence with synthetic image generation. MDME is based on a 2-D multi-echo fast spin-echo sequence that spans multiple saturation delays. Parameter maps for longitudinal and transverse relaxation, proton density, and B1 are computed from this acquisition, and images with various contrast weightings such as T1, T2, FLAIR are computed using these parameter maps5. 2-D MAGiC was acquired with similar coverage to MRF and TR=4808 ms, TE=22.3 ms, TI=11.88 ms, FA=90°, ETL=12, slice thickness=5 mm was employed. The synthetic images and relaxometry maps were generated in an automated workflow by the synthetic MR postprocessing integrated with MAGiC. The Regions of Interest (ROIs) were drawn by an experienced neuroradiologist, on the contralateral normal-appearing tissues (n=27) and brain tumor tissue (n=14) for comparison of the relaxometry values. In 13 patients tumor tissue regions were too small (lesions <5mm) to be included in the final analysis.Results:
Figure 1 shows the representative relaxometry maps for normal gray matter (GM), white matter (WM), and cerebrospinal fluid (CSF). Figure 2 is an example showing relaxometry maps for brain metastasis after stereotactic radiosurgery (SRS) in the same patient. Figure 3 shows another representative MAGiC and MRF-derived T1 and T2 maps along with clinically acquired T1 (post-contrast) and T2w images depicting brain metastases after treatment with focal radiation therapy (RT). Figure 4 exhibits analytics from all patients’ normal-appearing (untreated) GM, WM, and CSF region (n=27) using the MAGiC and MRF generated maps. The relaxometry values obtained from GM, WM region using MAGiC and MRF methods showed consistency to the previously reported values [1]. T1 from the CSF region is also consistent with previously reported values, whereas the T2 is underestimated in both methods. Figure 5 exhibits the range of T1 and T2 values estimated in normal and tumor (Pre-Tx n=5, Post-Tx n=9) tissues from MAGiC and MRF. The T1 and T2 values measured at the contralateral normal-appearing region were significantly lower than the Pre-Tx and Post-Tx tumor regions. T1 values ranged between 702 ms to 1146 ms using MAGiC, and 803 ms to 1572 ms using the MRF method. T2 values in the normal region ranged between 45 ms to 93 ms using MAGiC, and 56 ms to 101 ms using the MRF method. The range of T1 values for the Pre-Tx tumor region lies between 1487 ms to 2177 ms using MAGiC, and 1544 ms to 2435 ms using MRF. For the Post-Tx tumor region, the range of T1 values lies between 1654 ms to 2556 ms using MAGiC, and 1489 ms to 2462 ms using MRF. The range of T2 values for the Pre-Tx tumor region lies between 78 ms to 119 ms using MAGiC, and 136 ms to 182 ms using MRF. For the Post-Tx tumor region, the range of T2 values lies between 92 ms to 154 ms using MAGiC, and 99 ms to 200 ms using MRF.Discussion and Conclusion:
MAGiC and MRF offer the capability of rapidly generating quantitative relaxometry maps for brain tumor patients in a clinical setting. Relaxometry values measured from these two methods can identify differences between normal-appearing and Pre-Tx and Post-Tx tumor tissues. There is a slight difference in the range of T1 and T2 values obtained from MRF and MAGiC methods. Even though the methods are totally different, the relaxometry values obtained from these two methods should be standardized in the clinical setting. The utility of these two techniques needs to be further explored in larger sample studies for brain tumor patients.Acknowledgements
NIH U01 CA211205
Rolf Schulte (GE Healthcare) and Imago7, Pisa, Italy group for providing the MRF PSD & reconstruction code
References
- Ma, Dan, Vikas Gulani, Nicole Seiberlich, Kecheng Liu, Jeffrey L. Sunshine, Jeffrey L. Duerk, and Mark A. Griswold. "Magnetic resonance fingerprinting." Nature 495, no. 7440 (2013): 187-192.
- Tanenbaum, Lawrence N., Apostolos John Tsiouris, Angela N. Johnson, Thomas P. Naidich, Mark C. DeLano, Elias R. Melhem, Patrick Quarterman et al. "Synthetic MRI for clinical neuroimaging: results of the magnetic resonance image compilation (MAGiC) prospective, multicenter, multireader trial." American Journal of Neuroradiology 38, no. 6 (2017): 1103-1110.
- Shridhar Konar, Amaresha, Enlin Qian, Sairam Geethanath, Guido Buonincontri, Nancy A. Obuchowski, Maggie Fung, Pedro Gomez et al. "Quantitative imaging metrics derived from magnetic resonance fingerprinting using ISMRM/NIST MRI system phantom: An international multicenter repeatability and reproducibility study." Medical Physics 48, no. 5 (2021): 2438-2447.
- Buonincontri, Guido, Laura Biagi, Alessandra Retico, Paolo Cecchi, Mirco Cosottini, Ferdia A. Gallagher, Pedro A. Gómez et al. "Multi-site repeatability and reproducibility of MR fingerprinting of the healthy brain at 1.5 and 3.0 T." Neuroimage 195 (2019): 362-372.
- Warntjes, J. B. M., O. Dahlqvist Leinhard, J. West, and P. Lundberg. "Rapid magnetic resonance quantification on the brain: optimization for clinical usage." Magnetic Resonance in Medicine: An Official Journal of the International Society for Magnetic Resonance in Medicine 60, no. 2 (2008): 320-329.
Figures
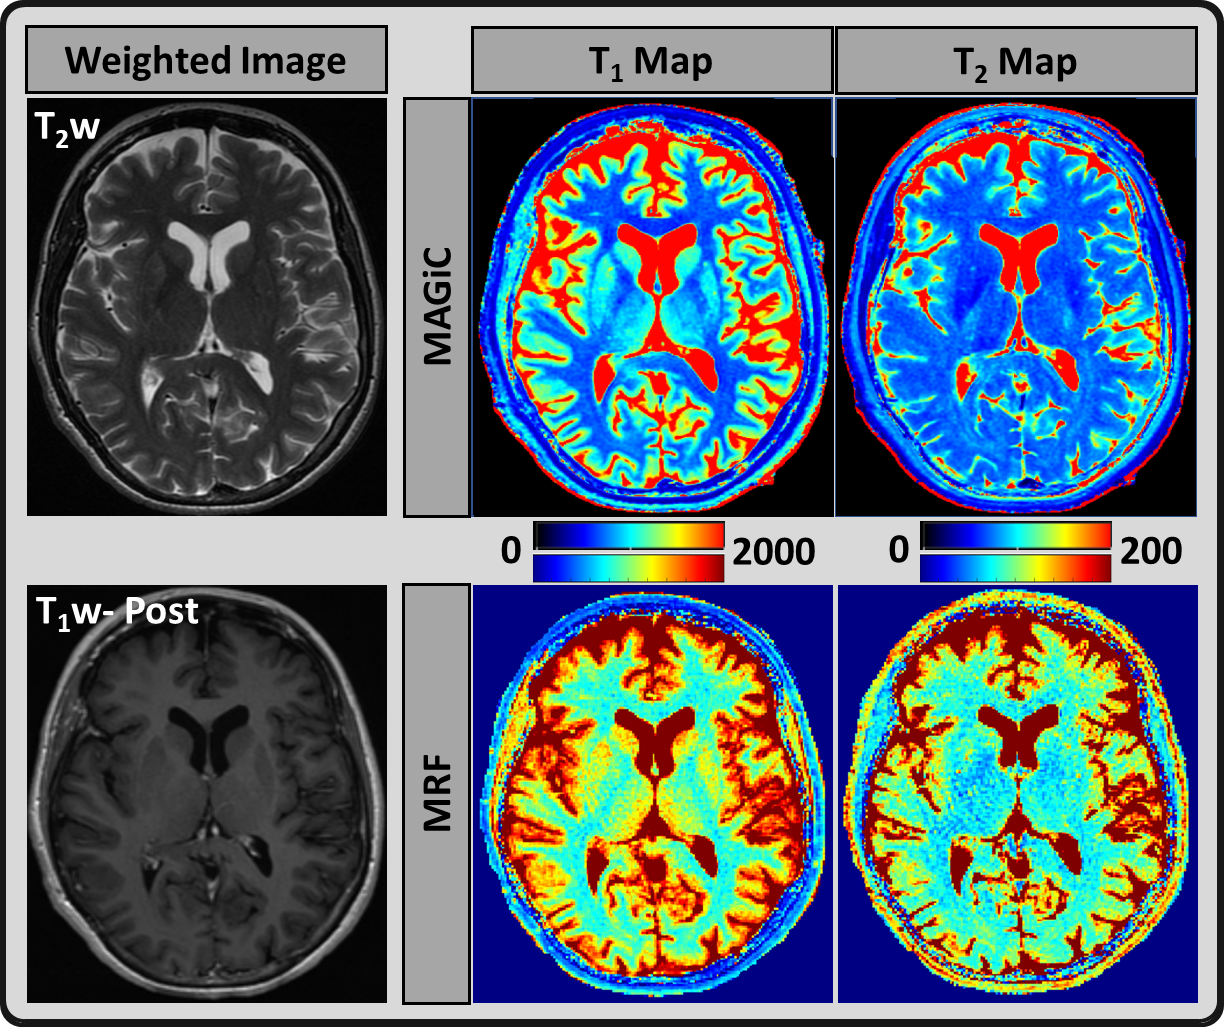
Figure 1: Axial imaging of a normal-appearing
brain; T1 and T2 maps estimated using MRF (lower row) and MAGiC (upper row)
methods for gray matter (GM), white matter (WM), and cerebrospinal fluid (CSF)
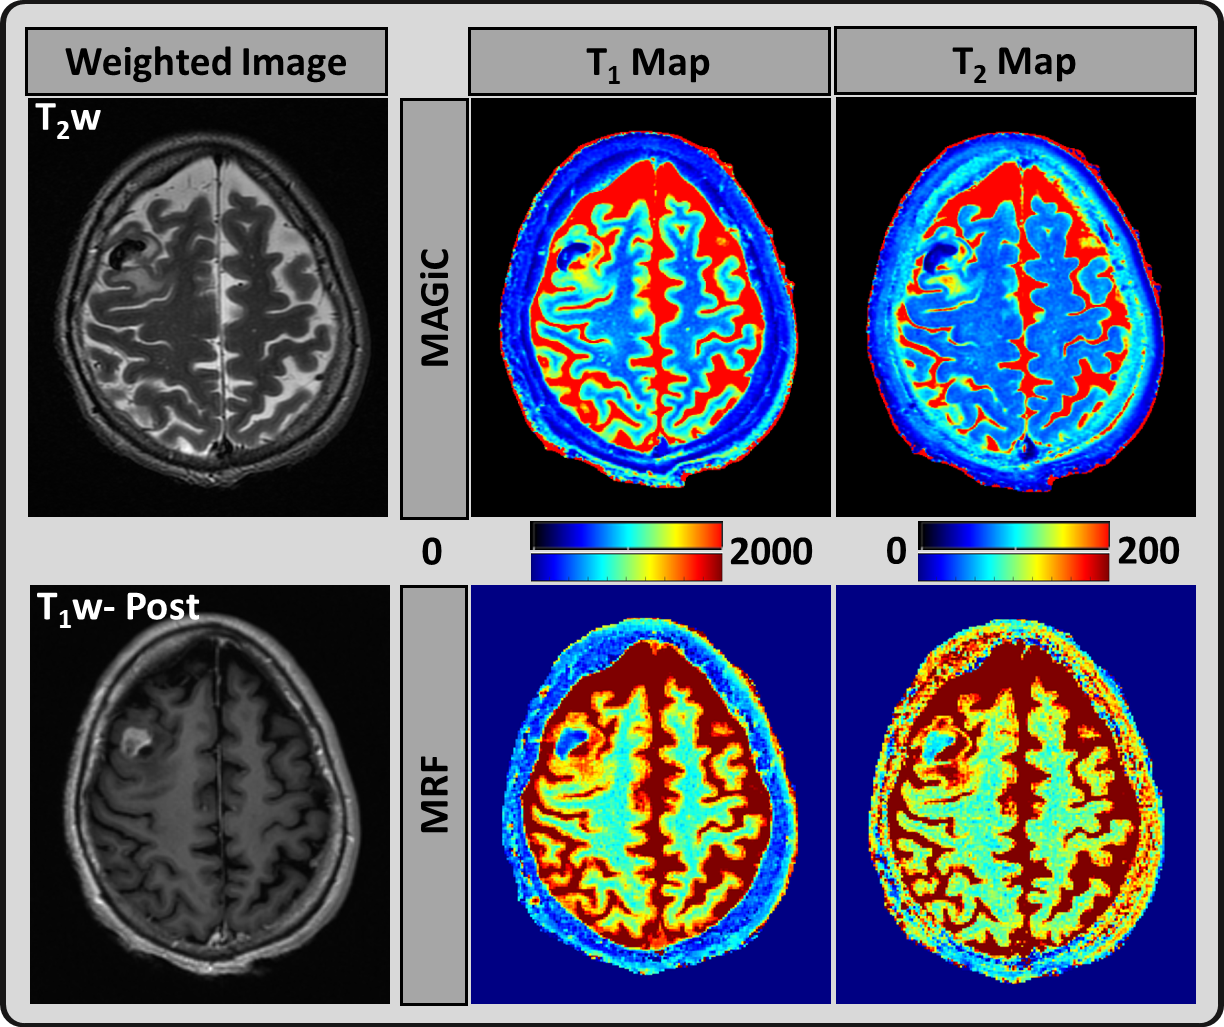
Figure 2: A representative image from a 52-year-old
female patient: T2 weighted and T1 weighted post-contrast images from the
clinical scan, which demonstrate partial necrosis region in the metastases.
MAGiC (upper row) and MRF (lower row) derived quantitative T1 and T2 maps.
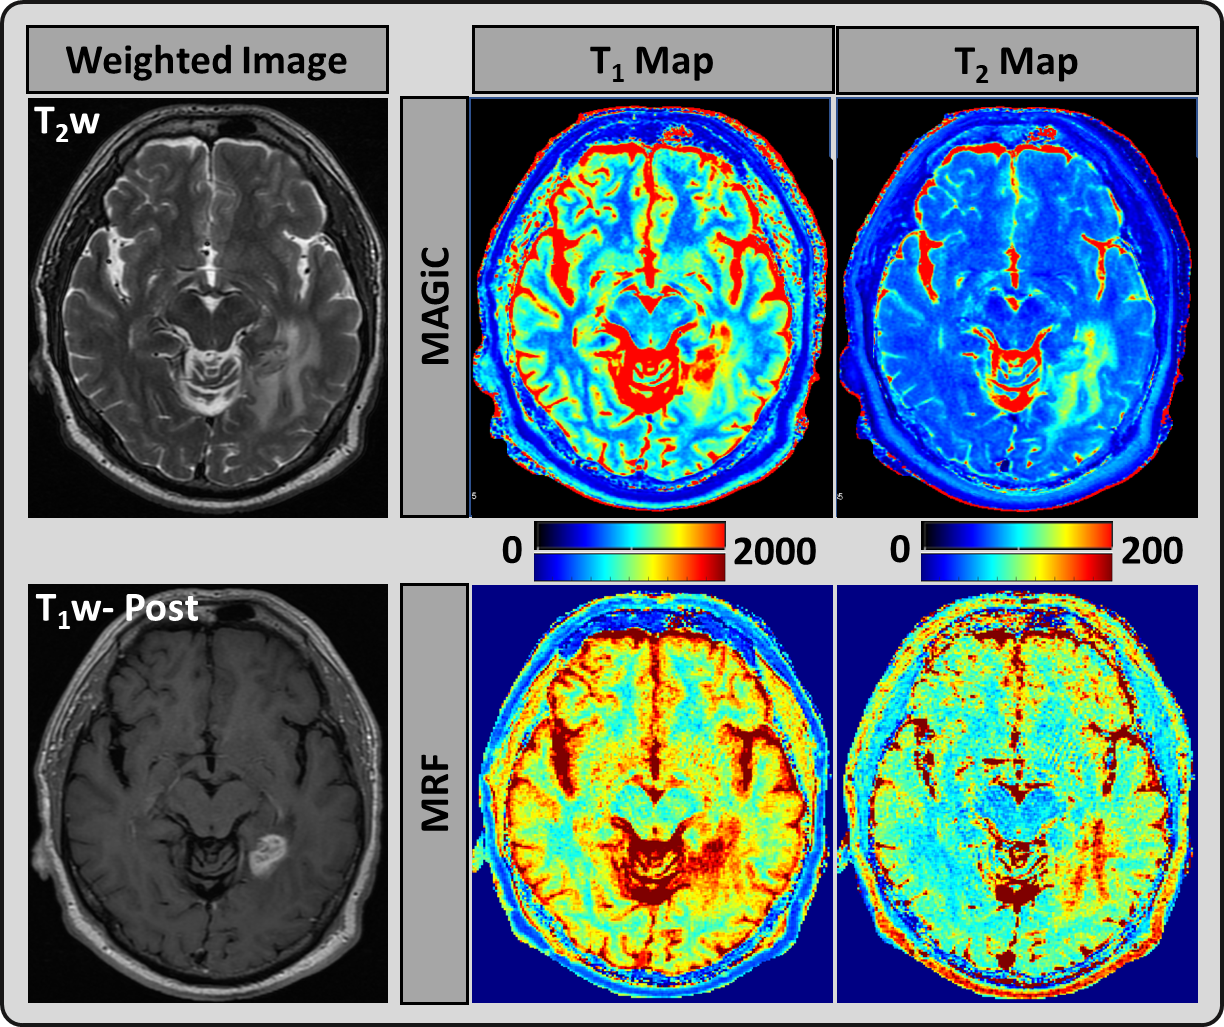
Figure 3: A representative image from a 59-year-old
male patient: T2 weighted and T1 weighted post-contrast images from the
clinical scan, which demonstrate a left enhancing metastatic lesion. MAGiC
(upper row) and MRF (lower row) derived quantitative T1 and T2 maps.
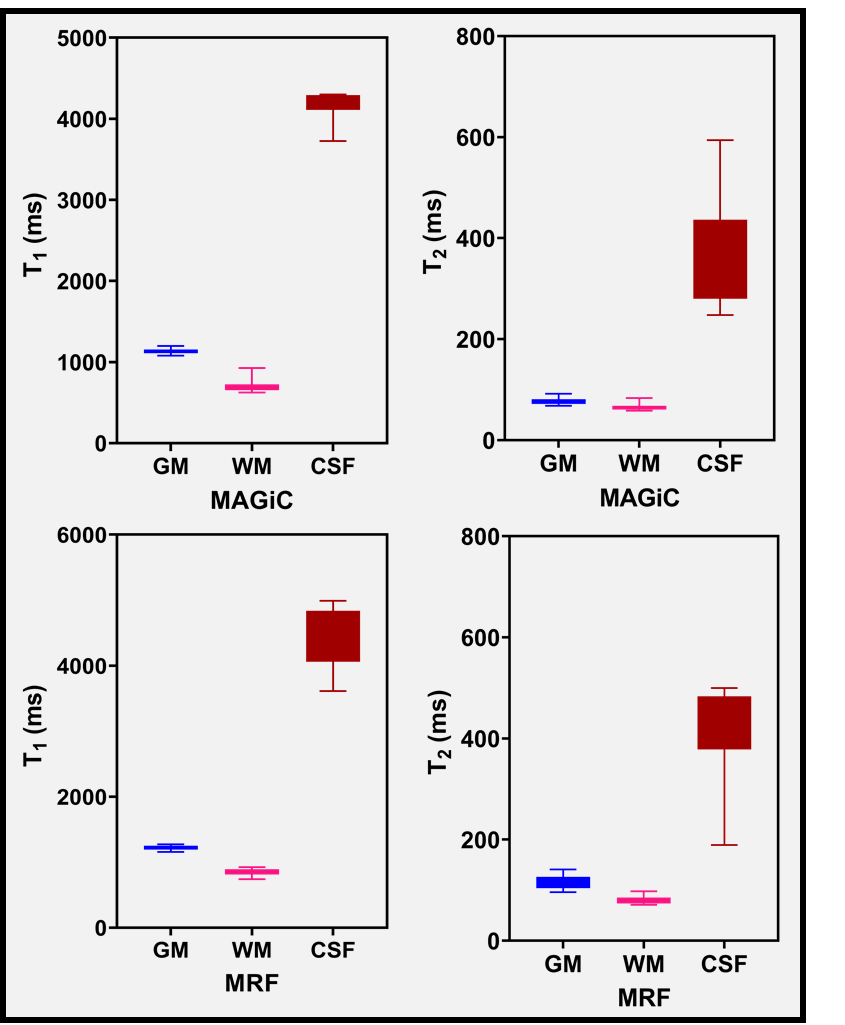
Figure 4: The range of T1 and T2 values
measured (n=27) in normal-appearing gray matter (GM), white matter (WM), and cerebrospinal fluid (CSF) using the maps generated from MAGiC and MRF methods
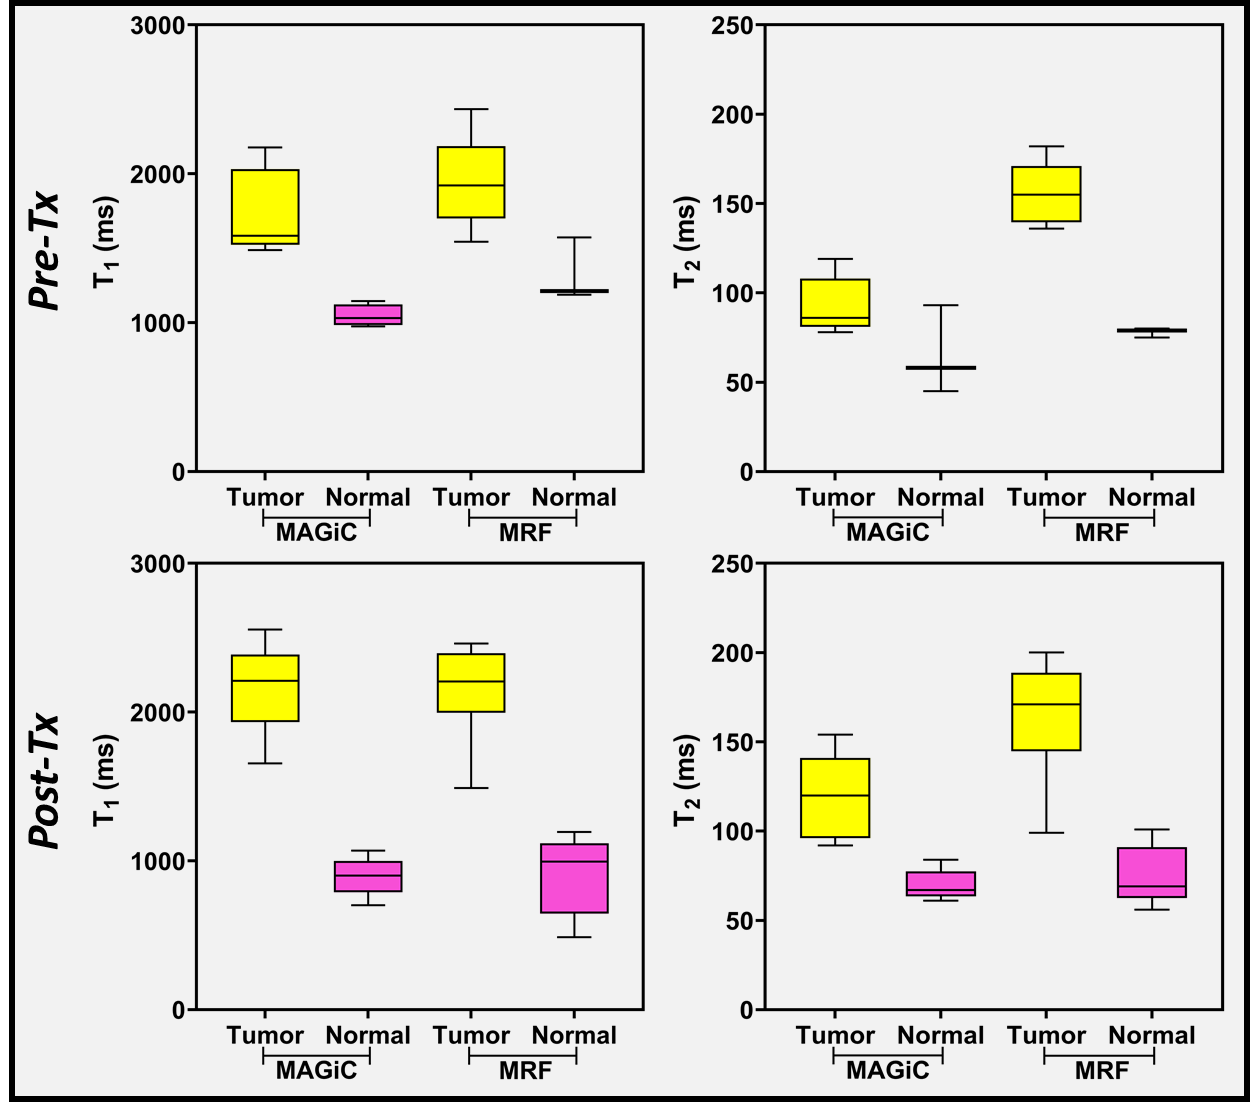
Figure 5: Difference in the range of T1
and T2 values (estimated using MRF and MAGiC methods) between the tumor (Pre-Tx
and Post-Tx) and normal-appearing (contralateral) regions
DOI: https://doi.org/10.58530/2022/1265