1262
Whole brain 3D radial T2 mapping with retrospective motion correction capabilities.1Centre de Résonance Magnétique des Systèmes Biologiques, UMR 5536, Bordeaux, France, 2Wellcome Centre for Human Neuroimaging, UCL Queen Square Institute of Neurology, University College London, London, United Kingdom
Synopsis
T2 mapping is usually very time consuming and long acquisition time often result in high sensitivity to intra-scan motion. Here we propose a T2 mapping method relying on 3D radial sampling and advanced iterative reconstruction to retrospectively correct for motion and/or reduce the acquisition. First, in-vivo experiments at 3T showed the capability of the technique to correct for intra-scan motion and therefore improve the quality of resulting T2 maps. Second, acquisitions varying from 7 to 33 min of whole-brain single and multi-compartment T2 maps were obtained, showing the potential of the method to accelerate and therefore reduce sensitivity to motion.
Introduction
The transverse relaxation rate (T2), intrinsically correlated to the tissue microstructure, is frequently investigated in clinical studies to observe changes over time or compare healthy and control patients1,2. However gold standard T2 mapping techniques require multi spin-echo based acquisitions, resulting in long acquisition times. Multi-compartment T2 mapping used for myelin water imaging3 or brain tumor differentiation4 is even more time demanding because more echoes are required. The multi-echo spin-echo (MESE) method5 is relatively efficient because the signal from multiple time points along the T2 decay is acquired for each k-space line during a single TR. Although the efficiency of this technique recently combined with highly advanced acceleration techniques makes whole brain T2 mapping achievable in vivo6, it can last from 10 min to hours. Given that intra-scan motion becomes non negligible for such acquisition time, we propose a new method for intra-scan motion correction or/and acceleration.Methods
Multiple whole brain acquisitions along the T2 decay are obtained with 3D radial sampling. The method allows for retrospective intra-scan motion correction relying on the principle recently published for T1 mapping7: motion is estimated from intermediate highly under-sampled reconstructed volumes and used to retrospectively correct the k-space data (Fig.1). Besides, the number of projections can be reduced to minimize the acquisition time thanks to advanced reconstruction techniques.The method relies on:
1/ Optimized acquisition sampling
3D sampling of the k-space is performed radially over a 3D sphere and varies across echoes and TRs.
2/ Intermediate volumes reconstruction
Intermediate highly under-sampled images are reconstructed from the acquired projections of all echoes of n TRs ($$$n\in\Bbb N^*$$$) with advanced iterative reconstruction approaches implemented in the open source library BART8 including parallel imaging and compressed sensing algorithm with spatial wavelet transform ($$$\lambda_{W}=0.001$$$) and temporal total variation ($$$\lambda_{TV}=0.2$$$) regularization.
3/ Motion estimation and k-space correction
The intermediate images are used to estimate the rigid-body motion with SPM12.6(http://www.fil.ion.ucl.ac.uk/spm) occurring during the full acquisition. Each acquired projection is corrected in the k-space in translation (phase ramp addition) and rotation (trajectory rotation) according to the estimated traces.
4/ Advanced echoes reconstruction
All echo images are reconstructed from the corrected k-space with advanced iterative approaches including spatial wavelet transform regularization ($$$\lambda_{W}=0.001$$$). The 10 first principal components of a temporal basis are also added as regularization constraint. The basis is built from EPG simulations10 of the MESE sequence with 400 T2 values ($$$5ms\leq T2\leq 2sec$$$) and 80 transmit field efficiencies values ($$$0.7\leq f_{B_{1}}\leq 1$$$).
5/ Appropriate T2 distribution estimation
T2 estimates are obtained from the open-source DECAES algorithm9 accounting for the stimulated echoes due to imperfect transmit field. T2 maps are obtained from the geometric mean of the T2 distribution and myelin water fraction (MWF) maps from the small pool fraction (<25ms).
In-vivo experiments
Exp.1: Validation of the motion correction scheme
Acquisitions were performed on one participant twice at 3T (Prisma, Siemens). In one case, they were asked to remain still whereas they were free to make small movements in the other. Key parameters include: TR=1s, TE=7:7:350ms, 50 echoes, 2000 projections, acquisition time 33:20min, FOV=160x160x160mm3, voxel size=2mm3.
The motion was estimated at a sampling rate of 0.5Hz (n=2). To validate the k-space correction method, intermediate images were also reconstructed after correction and the motion was estimated once again from the corrected time-series.
Exp.2: Acceleration of the acquisition
Three additional acquisitions were performed on another volunteer to demonstrate the flexibility of the proposed sequence. The volunteer was asked to remain still during those. The number of projections per echo volume was 2000, 1000 and 337 to reach a total acquisition time of 33:20min, 16:50min and 5:37min respectively. All key other parameters were the same.
Results
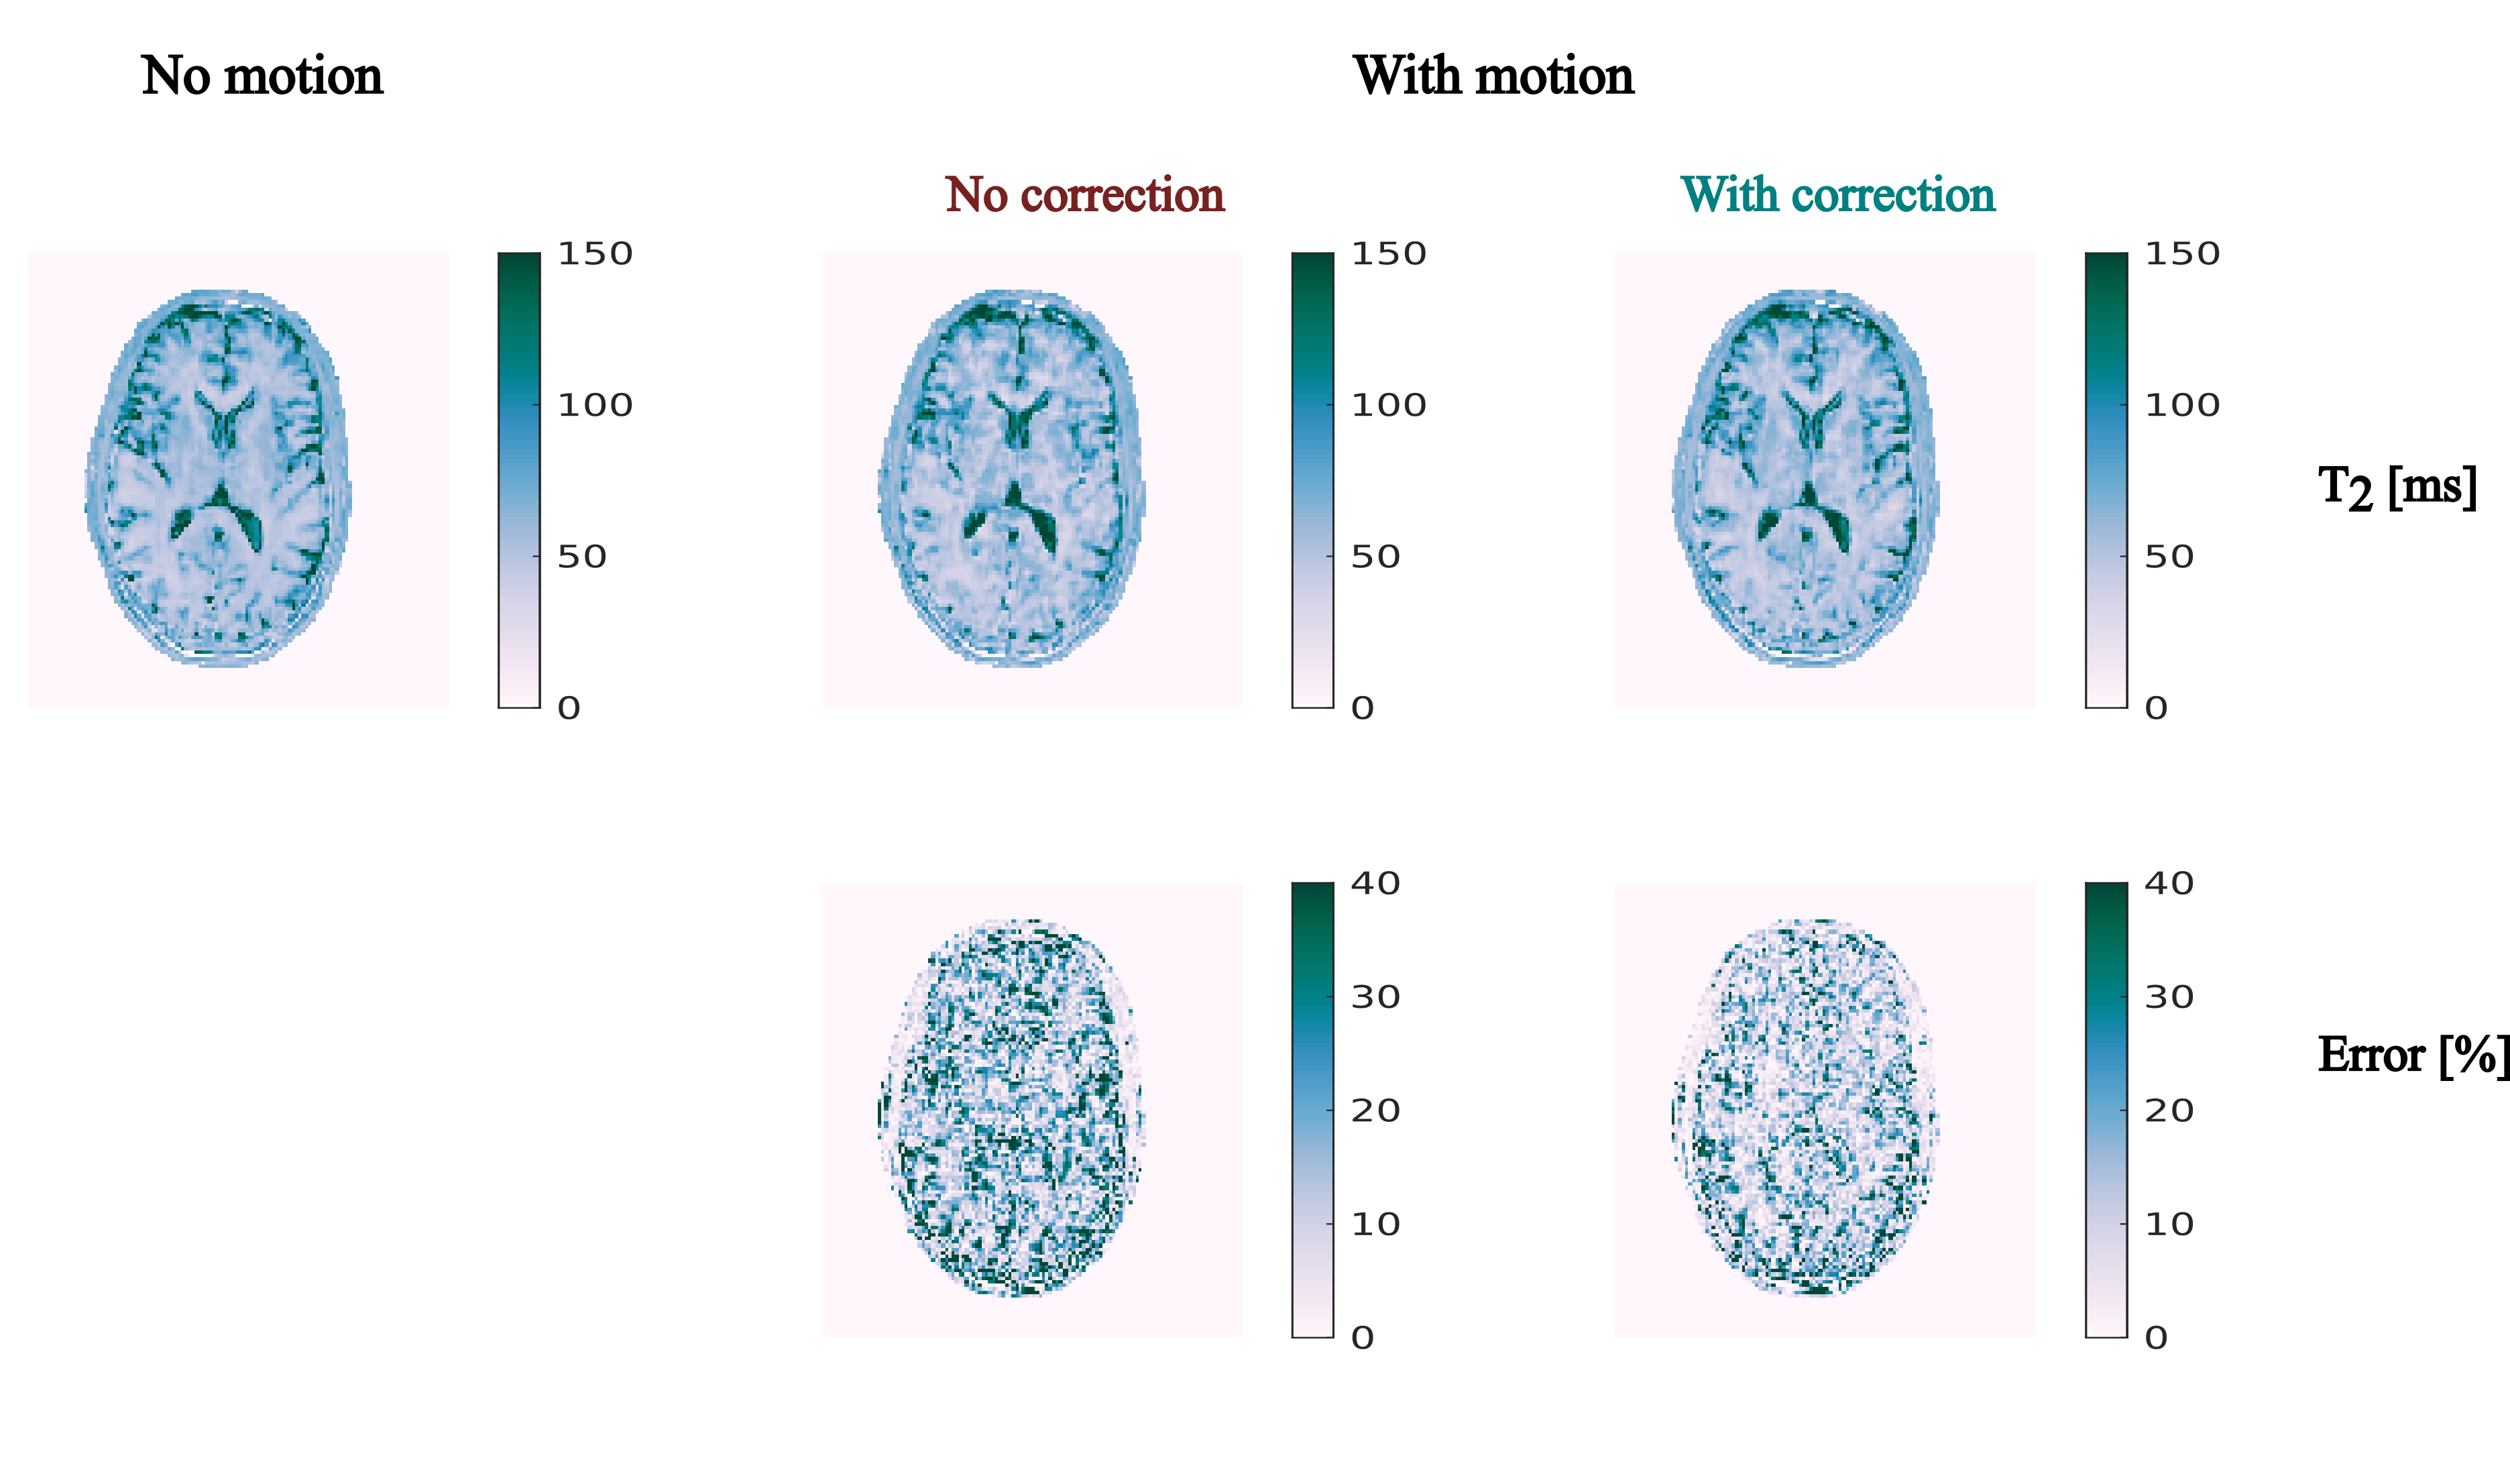
Exp.1: The motion estimated from the highly under-sampled data (Fig.2a) show translation and rotation reaching 5.05 mm and 0.68° in the motion case and decreasing to 0.38mm and 0.36° after k-space correction (Fig.2b). Quality of the echo images is affected by motion and benefits from the k-space correction (Fig.3). The quality of the echo images dictates the quality of the T2 maps (Fig.4). The motion correction scheme provides higher quality quantitative maps: the median absolute difference with the no motion case reduces from 12% to 9% (Fig.4).
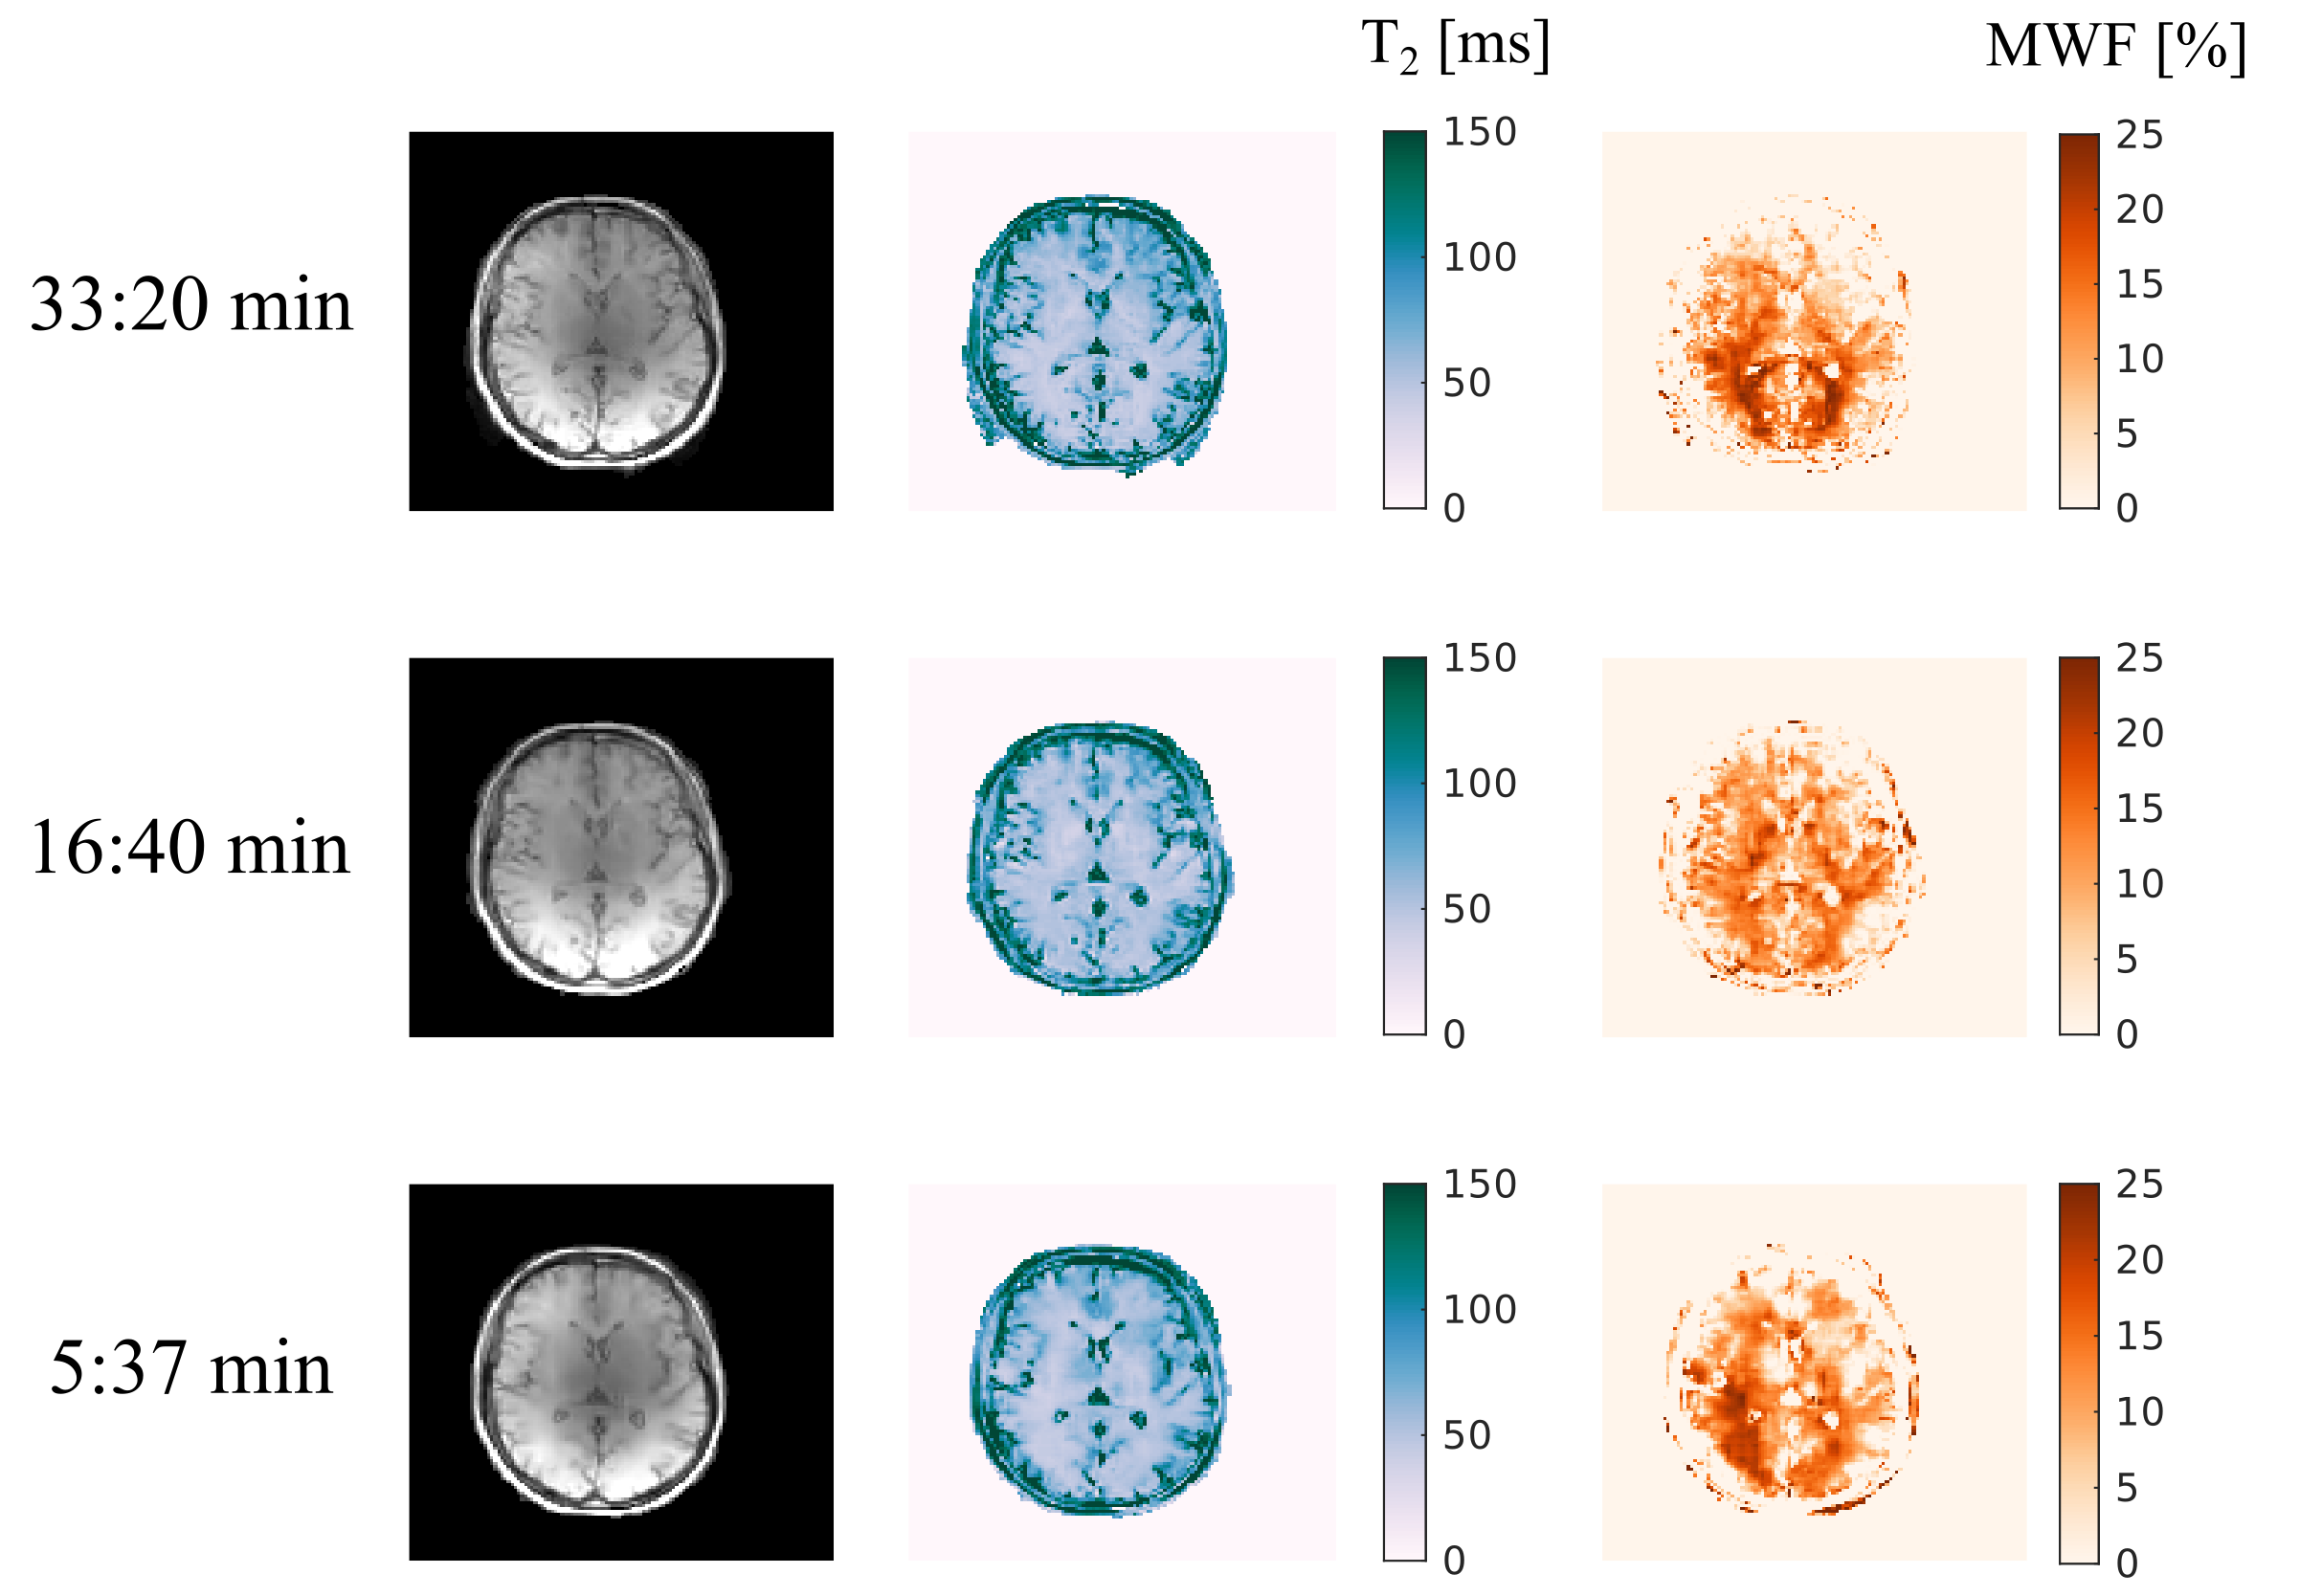
Exp.2: Whole brain T2 maps and MWF maps can be obtained from this framework. Reducing the number of projections reduces the acquisition time to less than 7min. Quality of the whole brain T2 maps remains reasonable at such acceleration factor despite some blurring (Fig.5), however MWF maps quality suffers more from the acceleration.
Discussion and conclusion
The proposed method enables 3D whole brain acquisitions of MESE data with robustness to motion. This technique can be used for single or multi-compartment T2 mapping. The total acquisition time can be further reduced by changing the number of projections. The higher the number of projections acquired, the higher the quality and the effective resolution but the sensitivity to motion may also increase. A minimum number of projections might be required to obtain decent MWF maps, more demanding in terms of image quality. Further work is needed to evaluate it. Given that longer acquisitions time may be required for MWF mapping, the motion correction scheme would be even more beneficial.Acknowledgements
This work is funded by the French National Research Agency (ANR-19-CE19-0014)References
1. Gracien, R.-M. et al. Assessment of cortical damage in early multiple sclerosis with quantitative T2 relaxometry. NMR in Biomedicine 29, 444–450 (2016).
2. Stevenson, V. L. et al. Variations in T1 and T2 relaxation times of normal appearing white matter and lesions in multiple sclerosis. Journal of the Neurological Sciences 178, 81–87 (2000).
3. Mackay, A. et al. In vivo visualization of myelin water in brain by magnetic resonance. Magnetic Resonance in Medicine 31, 673–677 (1994).
4. Laule, C. et al. Characterization of brain tumours with spin–spin relaxation: pilot case study reveals unique T2 distribution profiles of glioblastoma, oligodendroglioma and meningioma. J Neurol 264, 2205–2214 (2017).
5. Meiboom, S. & Gill, D. Modified Spin-Echo Method for Measuring Nuclear Relaxation Times. RScI 29, 688–691 (1958).
6. Dvorak, A. V. et al. Multi-spin echo T2 relaxation imaging with compressed sensing (METRICS) for rapid myelin water imaging. Magnetic Resonance in Medicine 84, 1264–1279, (2020).
7. Kecskemeti, S. et al. Robust Motion Correction Strategy for Structural MRI in Unsedated Children Demonstrated with Three-dimensional Radial MPnRAGE. Radiology 289, 509–516 (2018).
8. Uecker, M. et al. mrirecon/bart: version 0.7.00. (2021) doi:10.5281/zenodo.4570601.
9. Doucette, J., Kames, C. & Rauscher, A. DECAES – DEcomposition and Component Analysis of Exponential Signals. Zeitschrift für Medizinische Physik (2020) doi:10.1016/j.zemedi.2020.04.001.
10. Malik, S. J., Teixeira, R. P. A. G. & Hajnal, J. V. Extended phase graph formalism for systems with magnetization transfer and exchange. Magnetic Resonance in Medicine 80, 767–779 (2018).
Figures
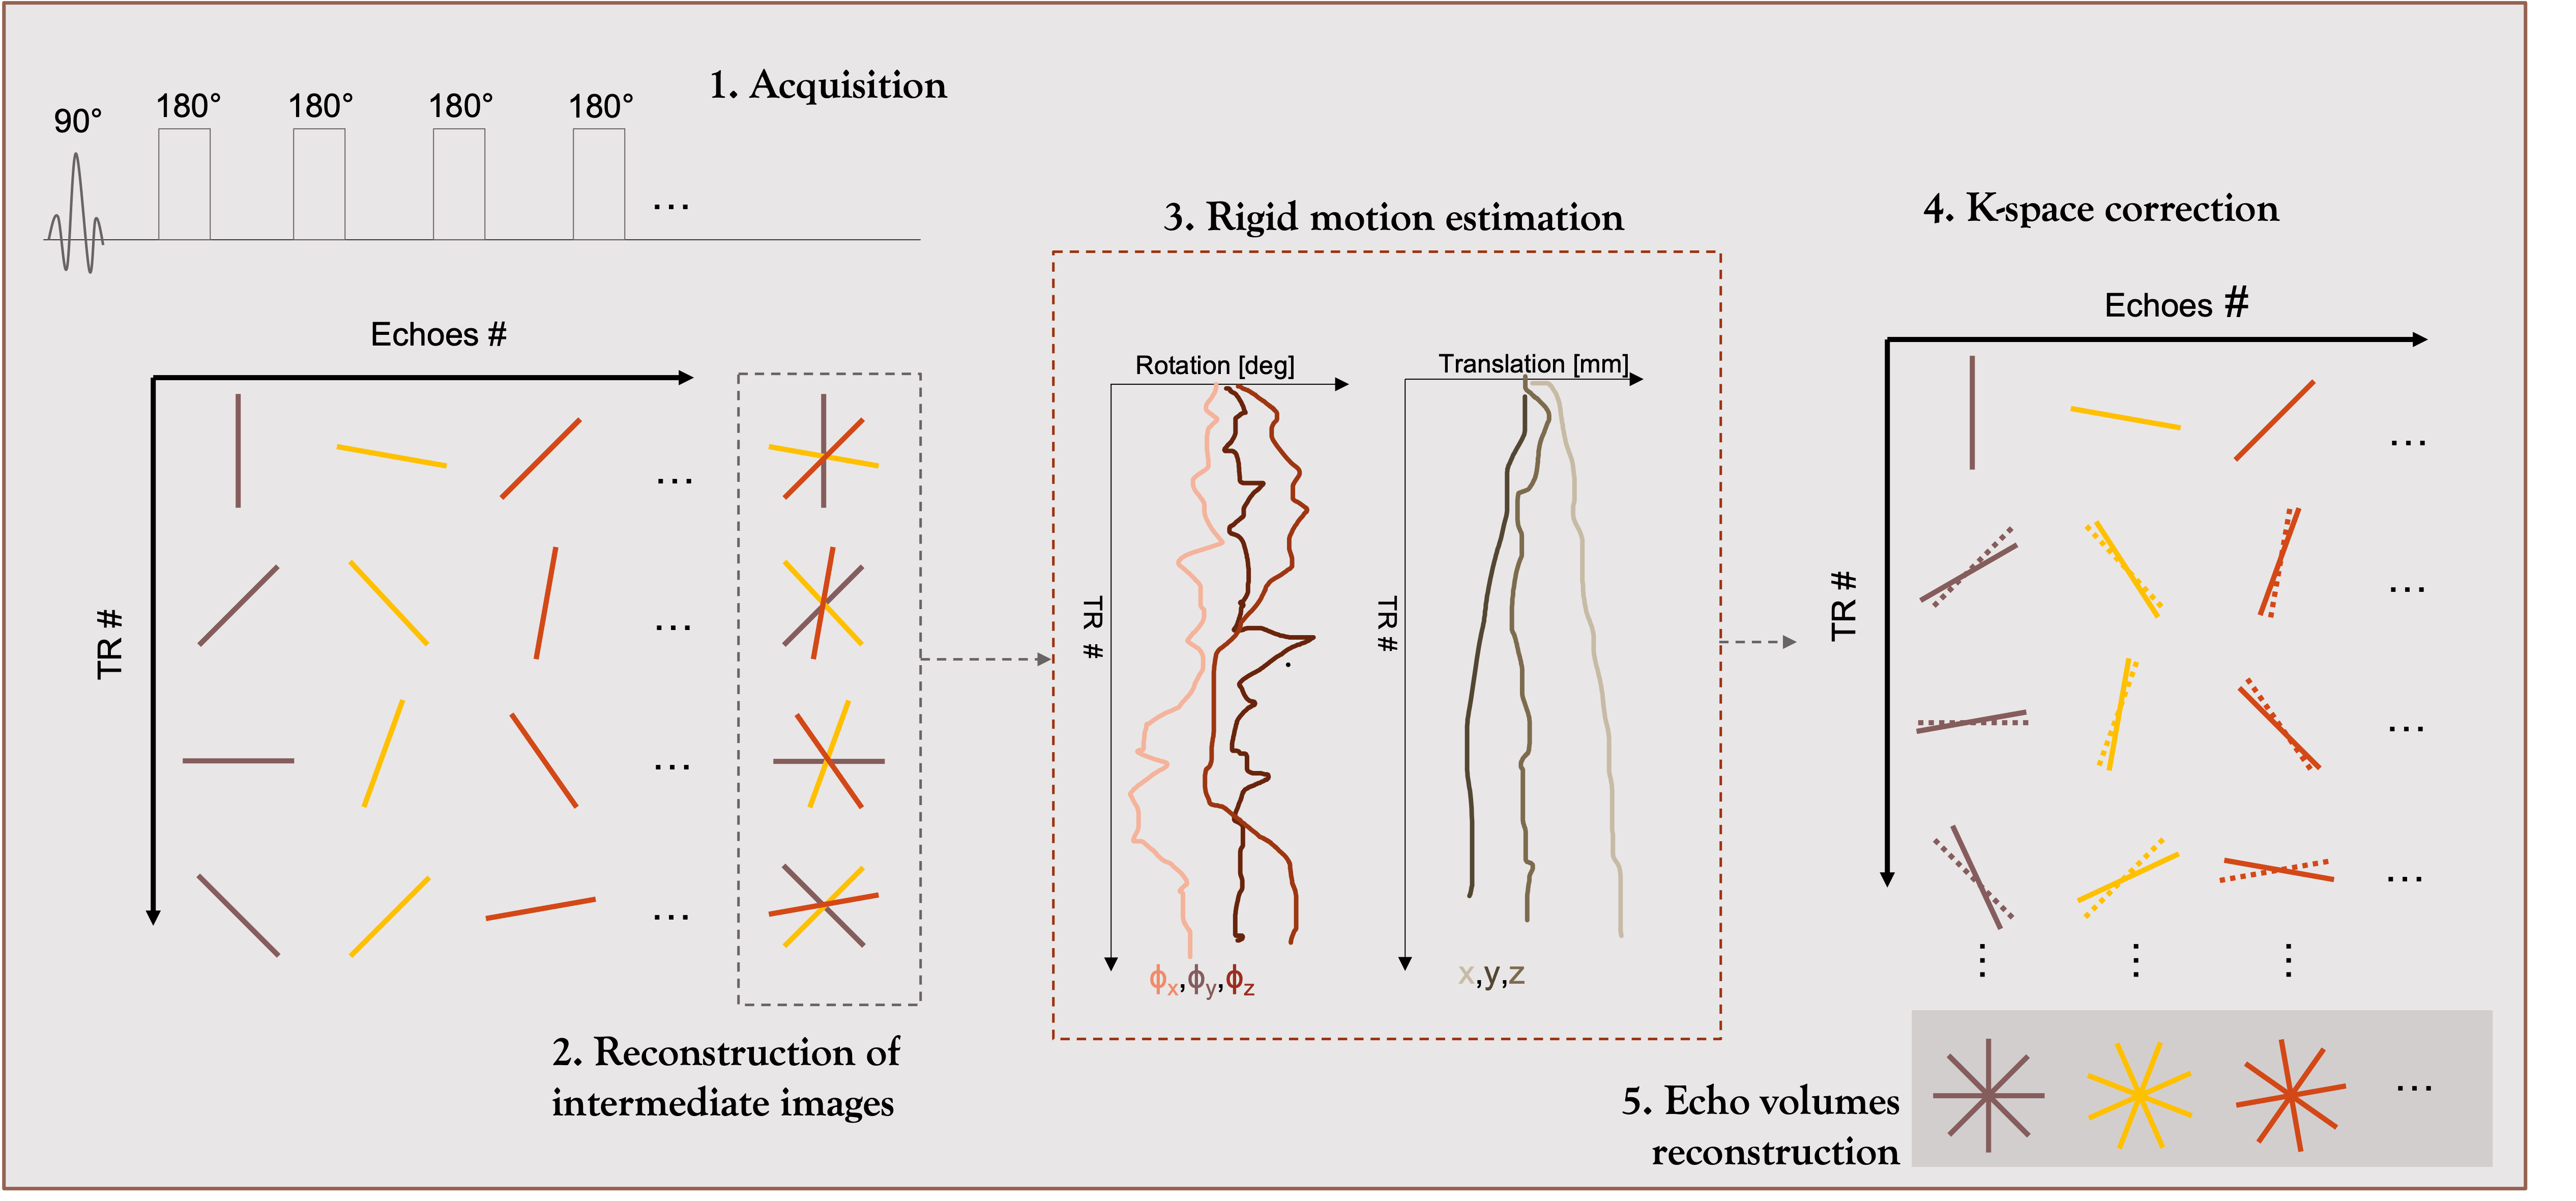
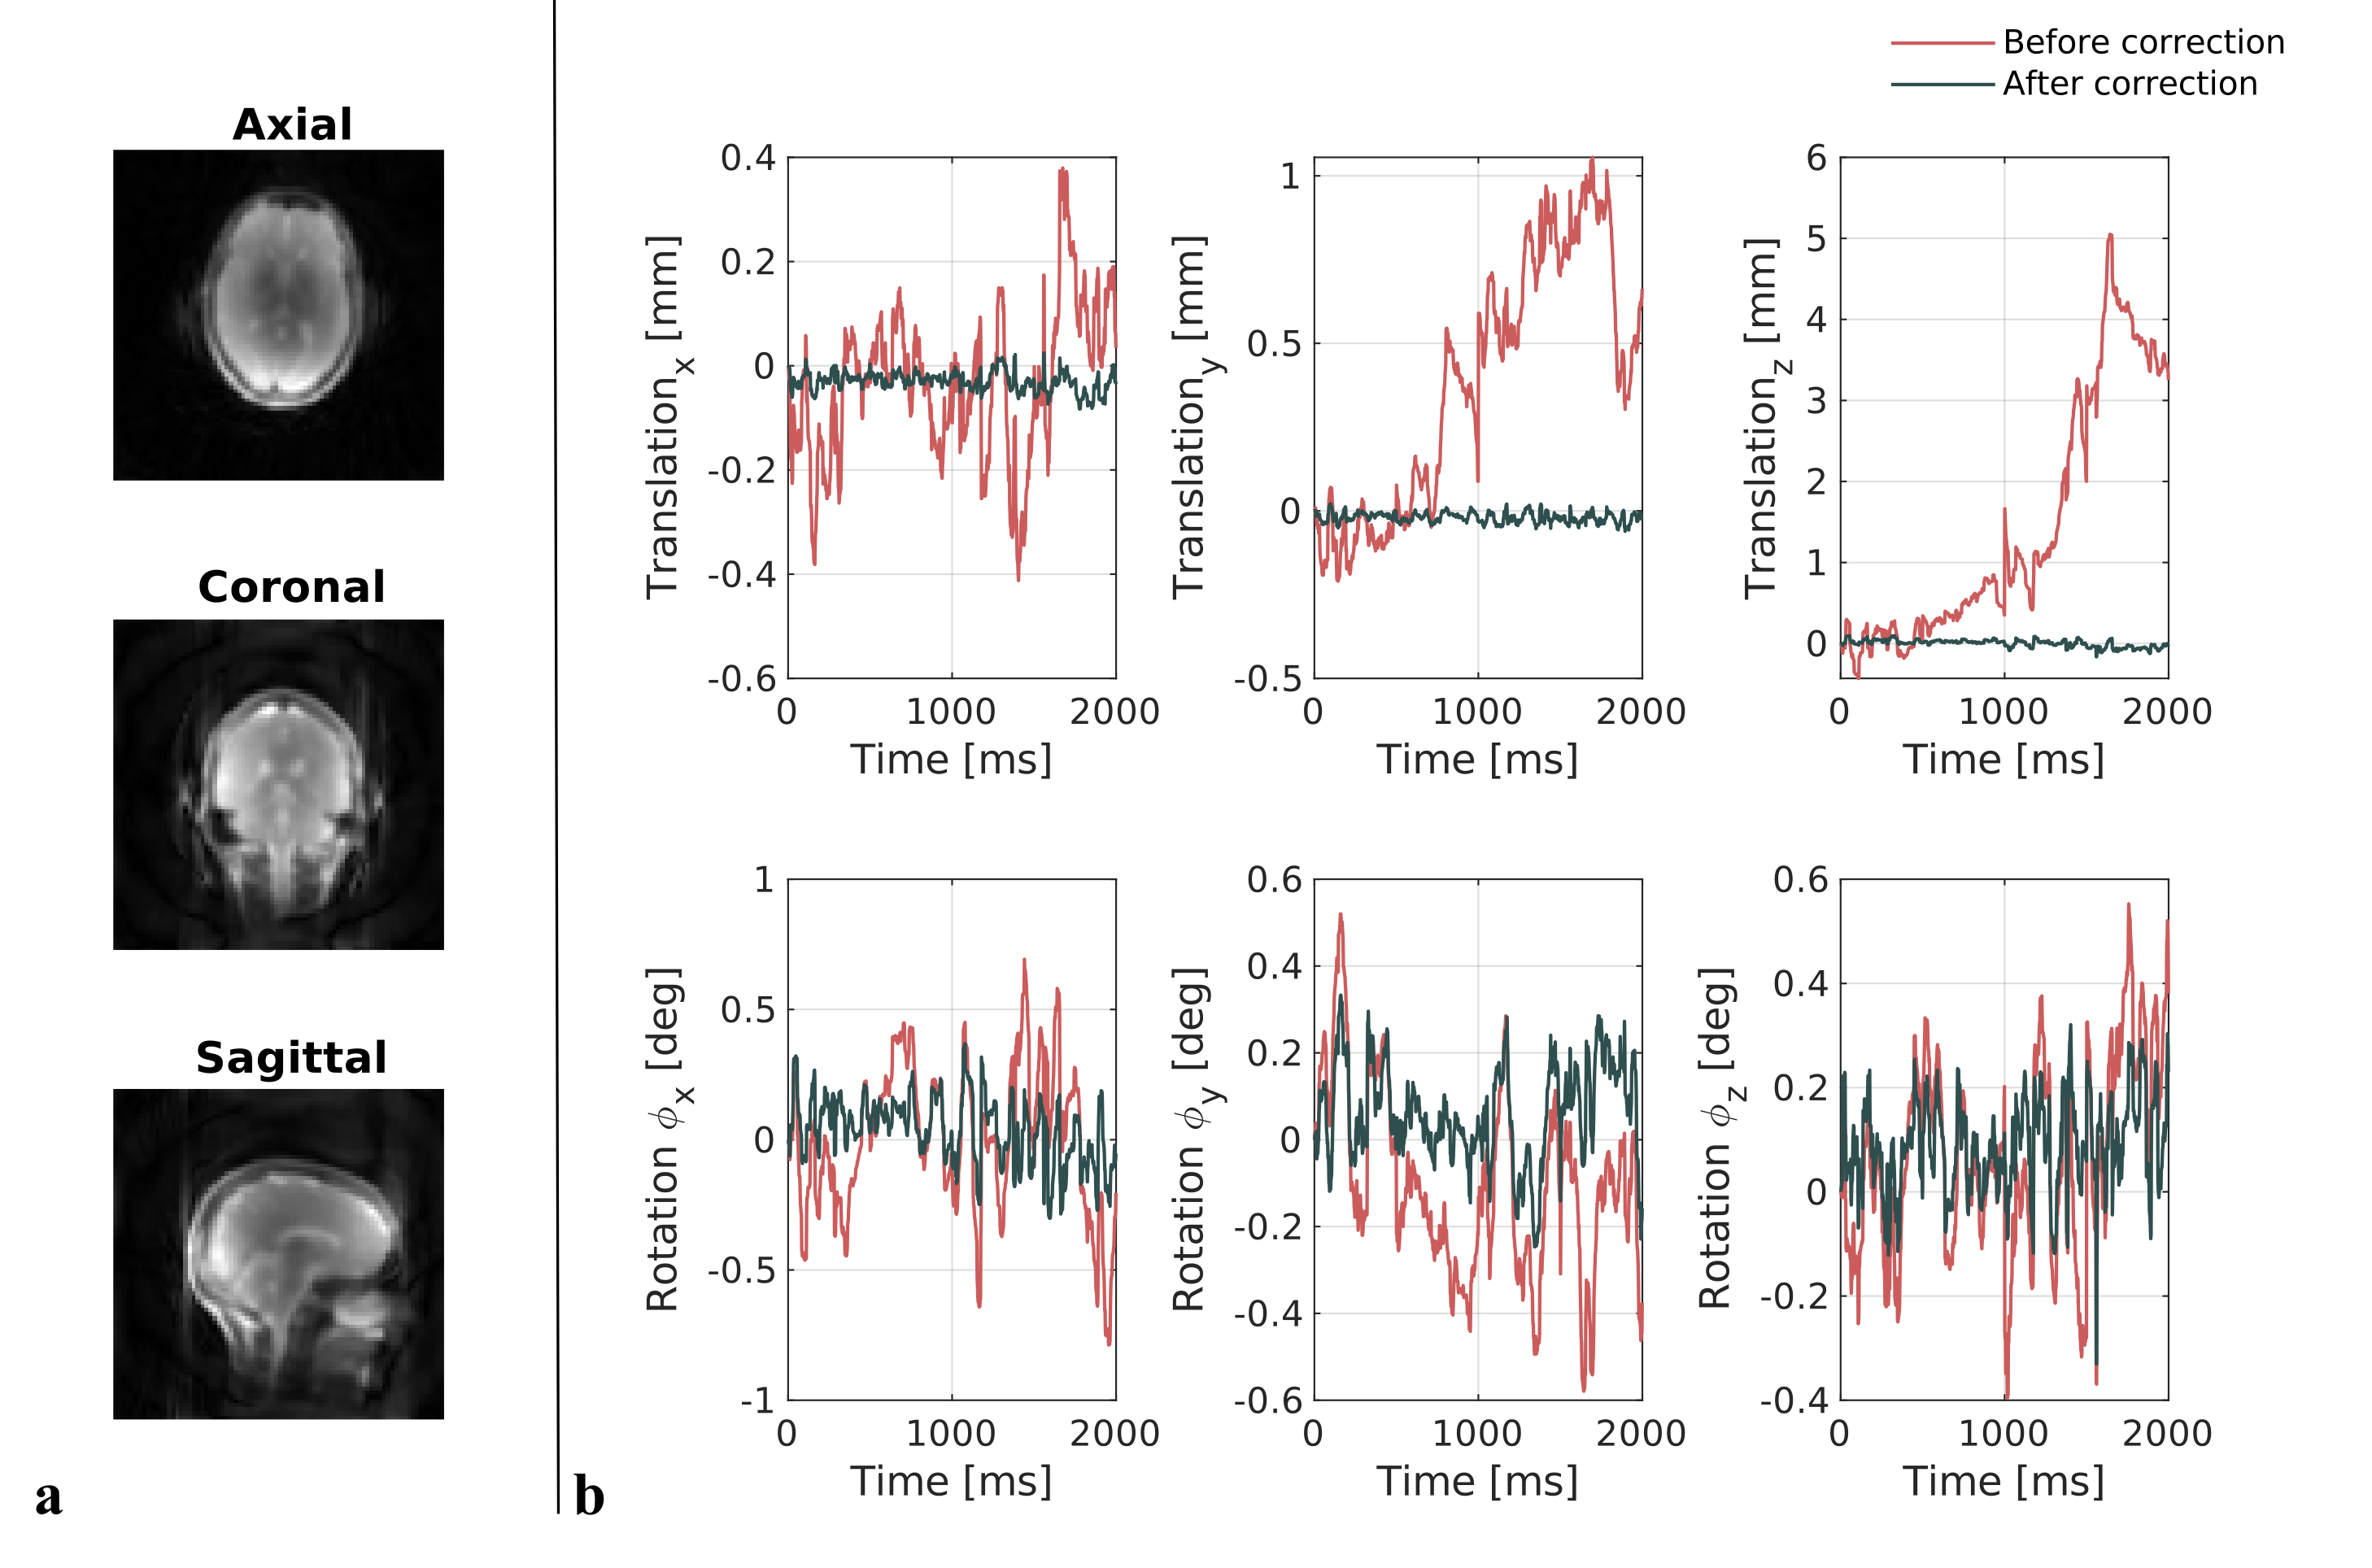
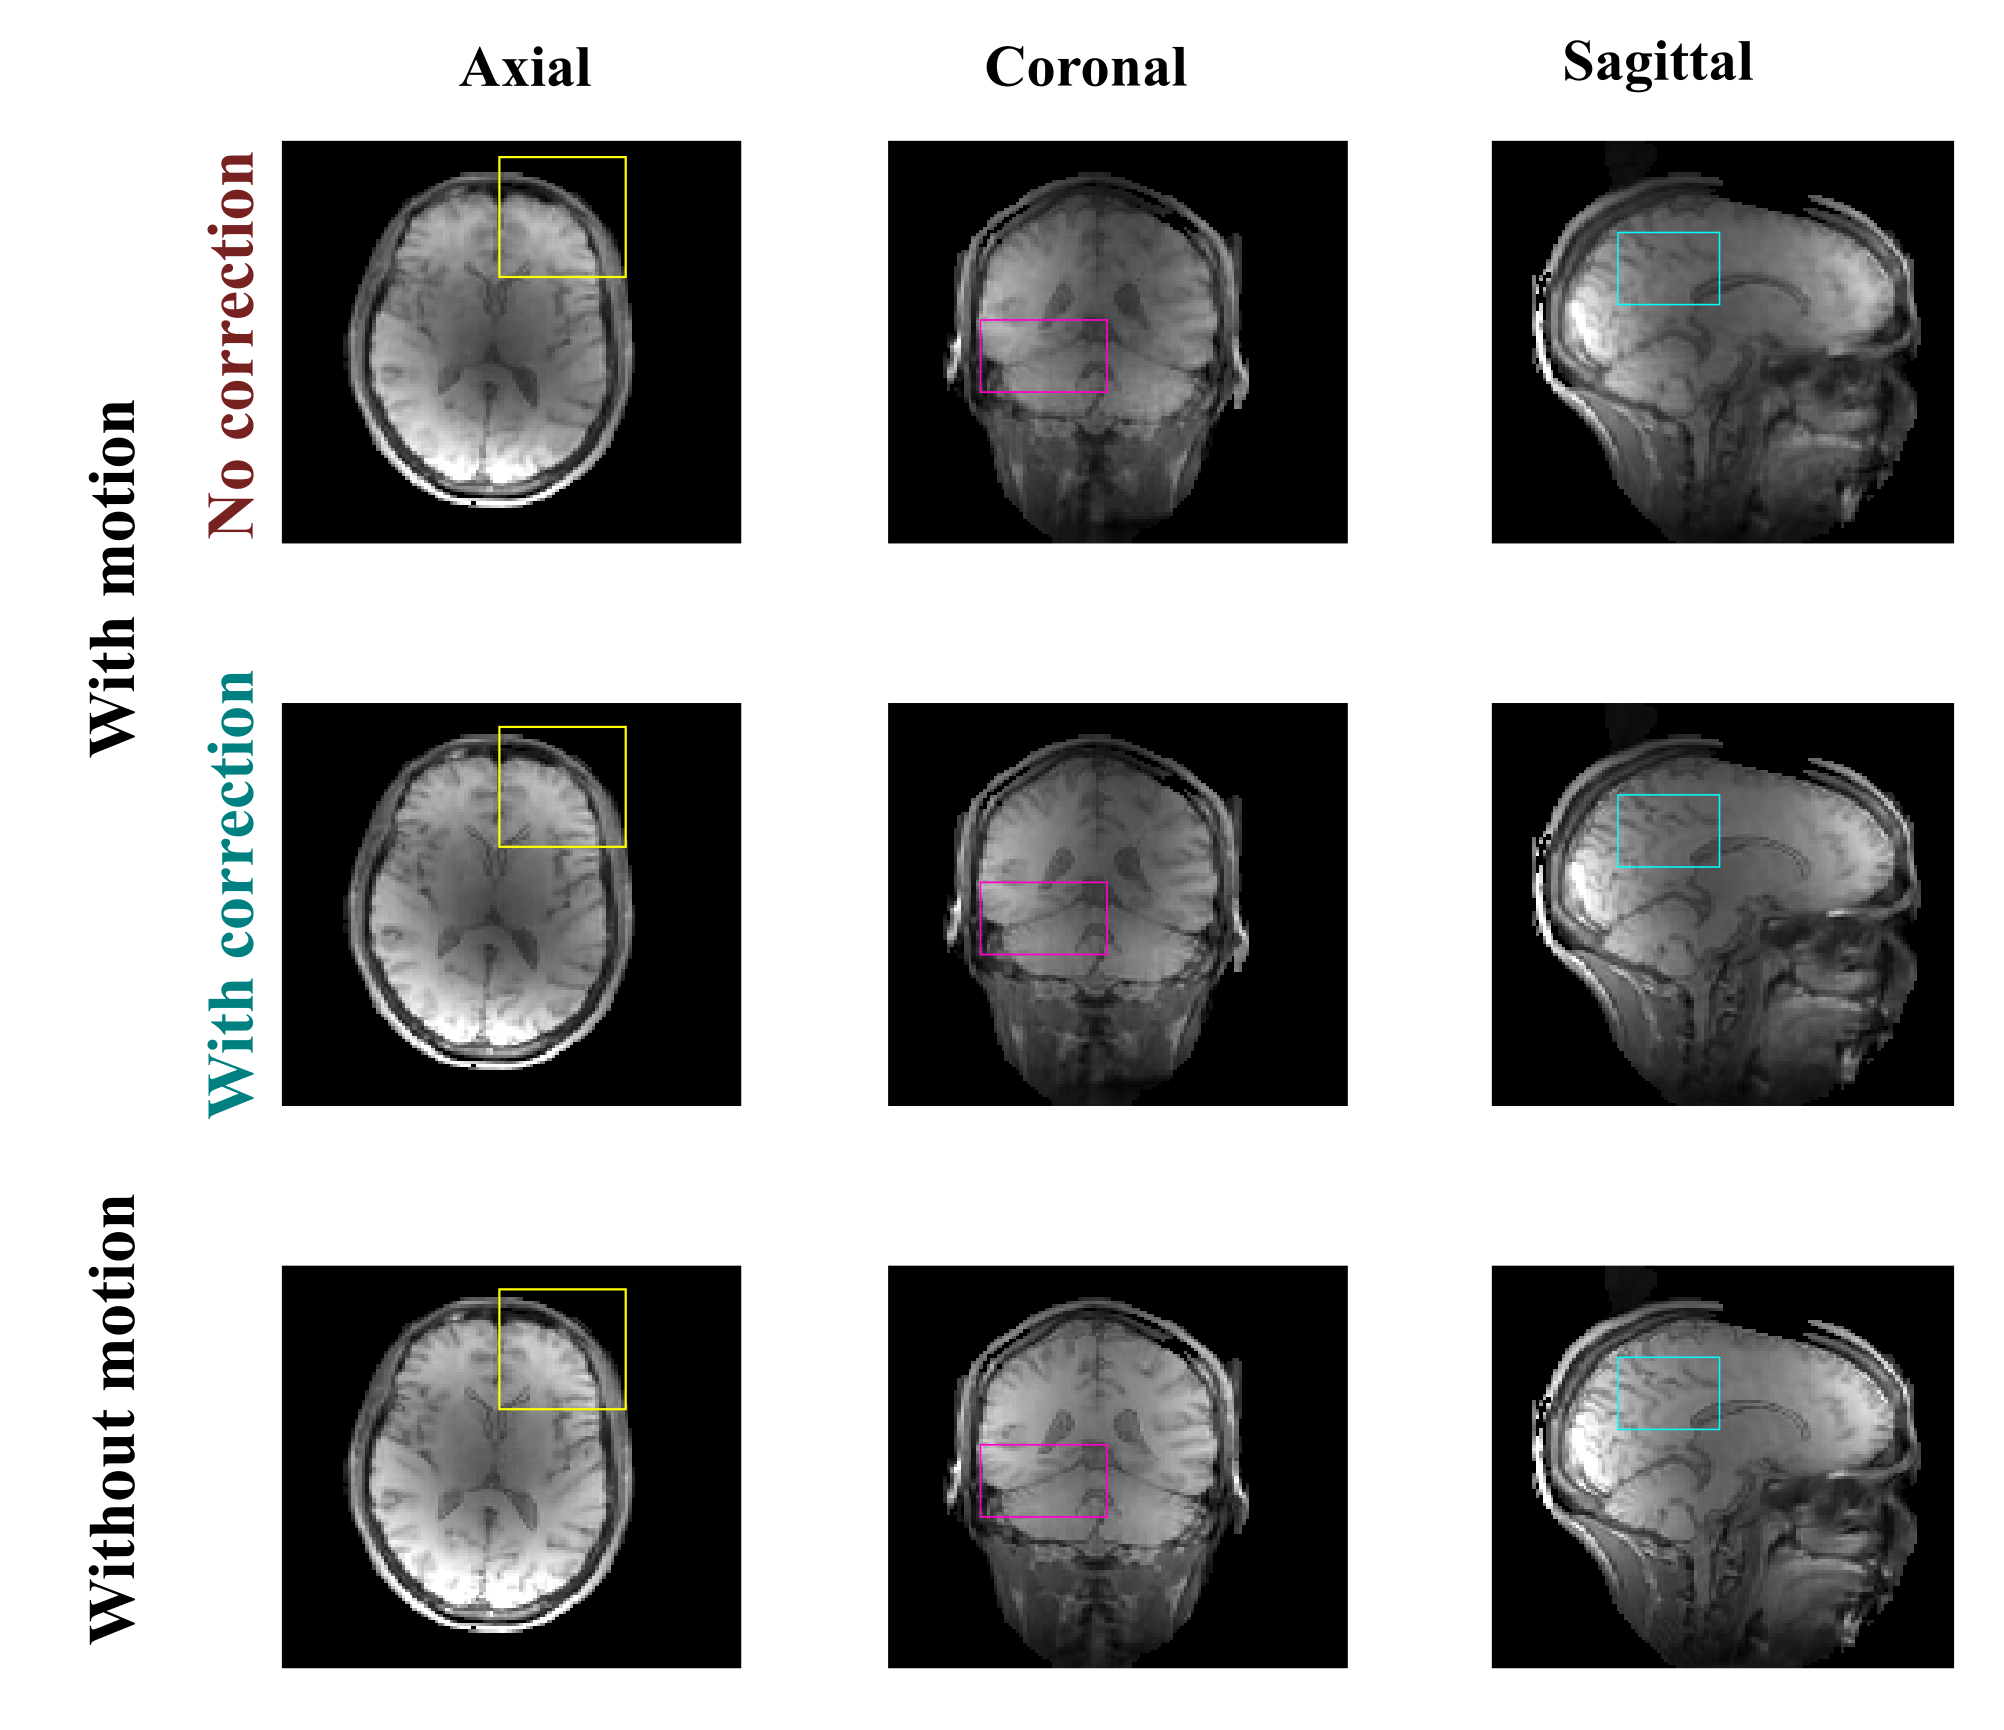
Fig.3: First echo volumes of the data acquired without motion (bottom row), with motion but no motion correction ( top row) and with motion after motion correction (middle row). Differences between the three datasets are highlighted in some features by the colored boxes and show benefit of motion correction.