1261
The Compressed Sensing MP2RAGE as a surrogate to the MPRAGE for neuro-imaging at 3T1Centre de Résonance Magnétique des Systèmes Biologiques, UMR 5536, CNRS, Bordeaux, France, 2UMS3767, CNRS, Bordeaux, France, 3UMS3767, Université de Bordeaux, Bordeaux, France
Synopsis
A Compressed Sensing Magnetization prepared Two Rapid Gradient Echo (CS-MP2RAGE) sequence was developed to provide images in <10min including reconstruction time. It was applied on 13 participants each scanned 3 to 4 times with repositioning. Compared to the standard MPRAGE sequence, it provides higher contrast morphological images. Similar intra-volunteer variabilities in volume segmentations of the brain structures were obtained. Additionally, high resolution T1 maps provided T1 values of white and gray matters and several deep grey nuclei consistent with the literature, and show very low variability (<1%). The CS-MP2RAGE can be used in future clinical research protocols.
INTRODUCTION
The Magnetization prepared 2 Rapid Gradient Echo (MP2RAGE) sequence provides quantitative T1 maps in addition to high-contrast morphological images [1]. Advanced acceleration techniques like Compressed Sensing (CS) allow its acquisition time to be compatible with clinical applications [2]. In order to consider its routine use in neuro-imaging protocols, the repeatability of the segmented brain structures needs to be evaluated and compared to the standard morphological sequence (Magnetization prepared Rapid Gradient Echo, i.e. MPRAGE). Also, the repeatability of the T1 measurements needs to be assessed.METHODS
Thirteen healthy volunteers were scanned three or four times at several days of interval, on a 3T clinical scanner, with the two sequences (CS-MP2RAGE and MPRAGE), set with the same spatial resolution (0.8mm isotropic) and scan duration (6min21s). The reconstruction time of the CS-MP2RAGE outputs was 3min33s, using an open-source algorithm implemented in the Gadgetron framework. The variability of volume measurements obtained from two standard softwares based on MPRAGE contrasts (CAT12 and VolBrain) were assessed. In vitro precision of the T1 measurements were compared to the standard vendor MP2RAGE sequence. The in vivo T1 measurements repeatability was assessed and values were compared to literature. Student T-tests were used (p<0.05 was considered significant).RESULTS
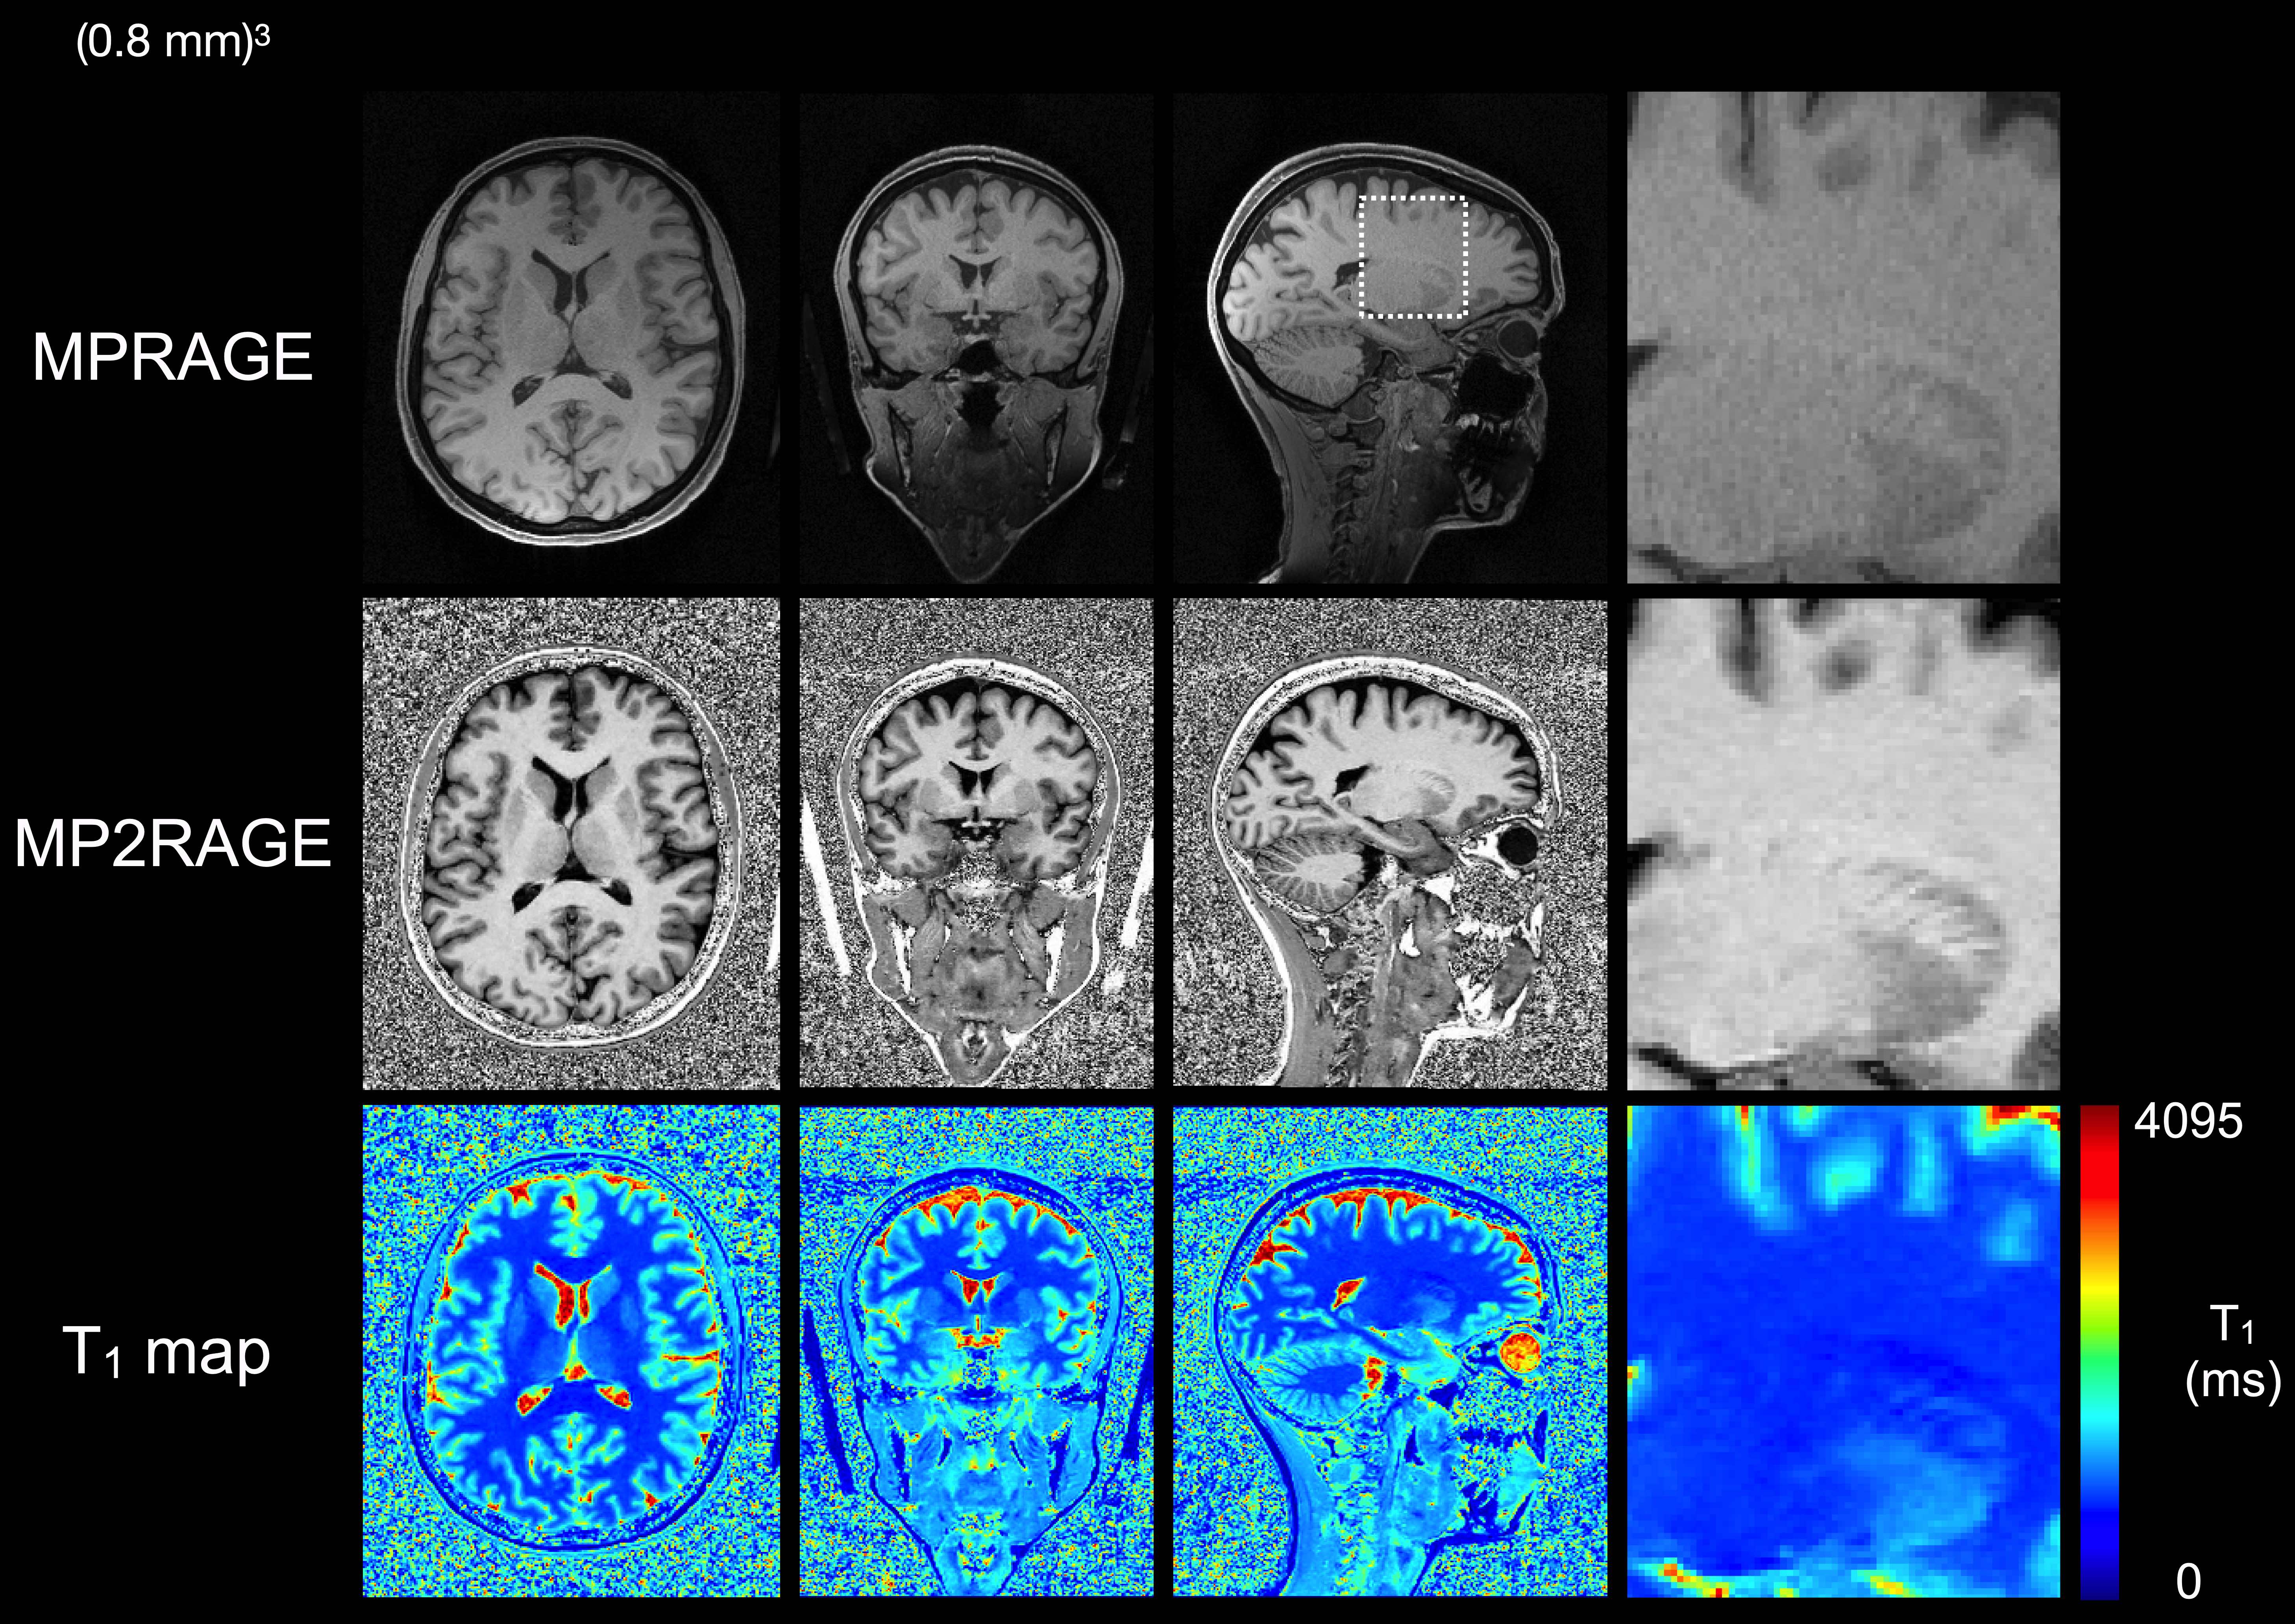
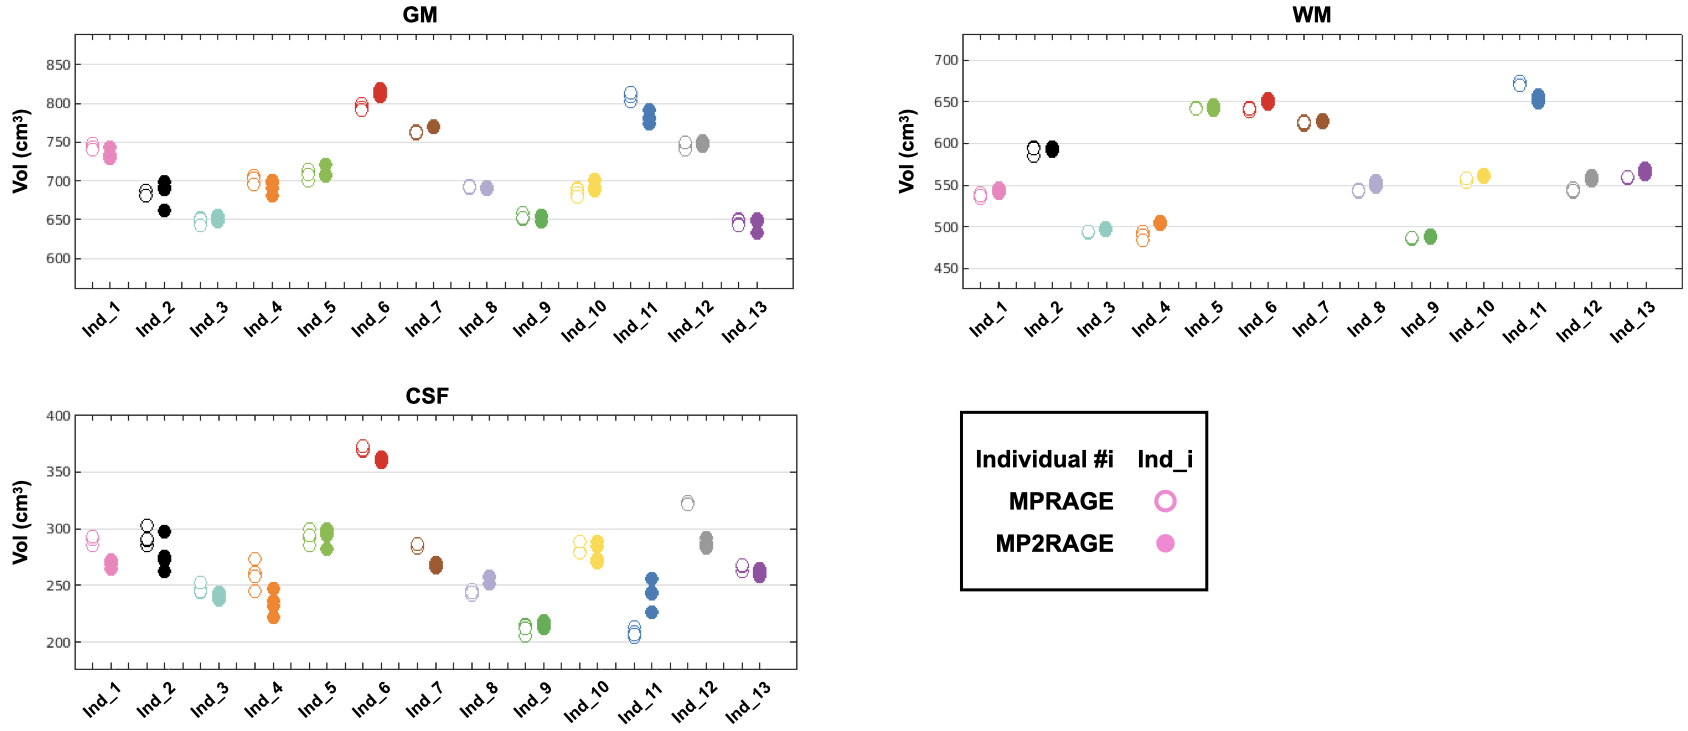
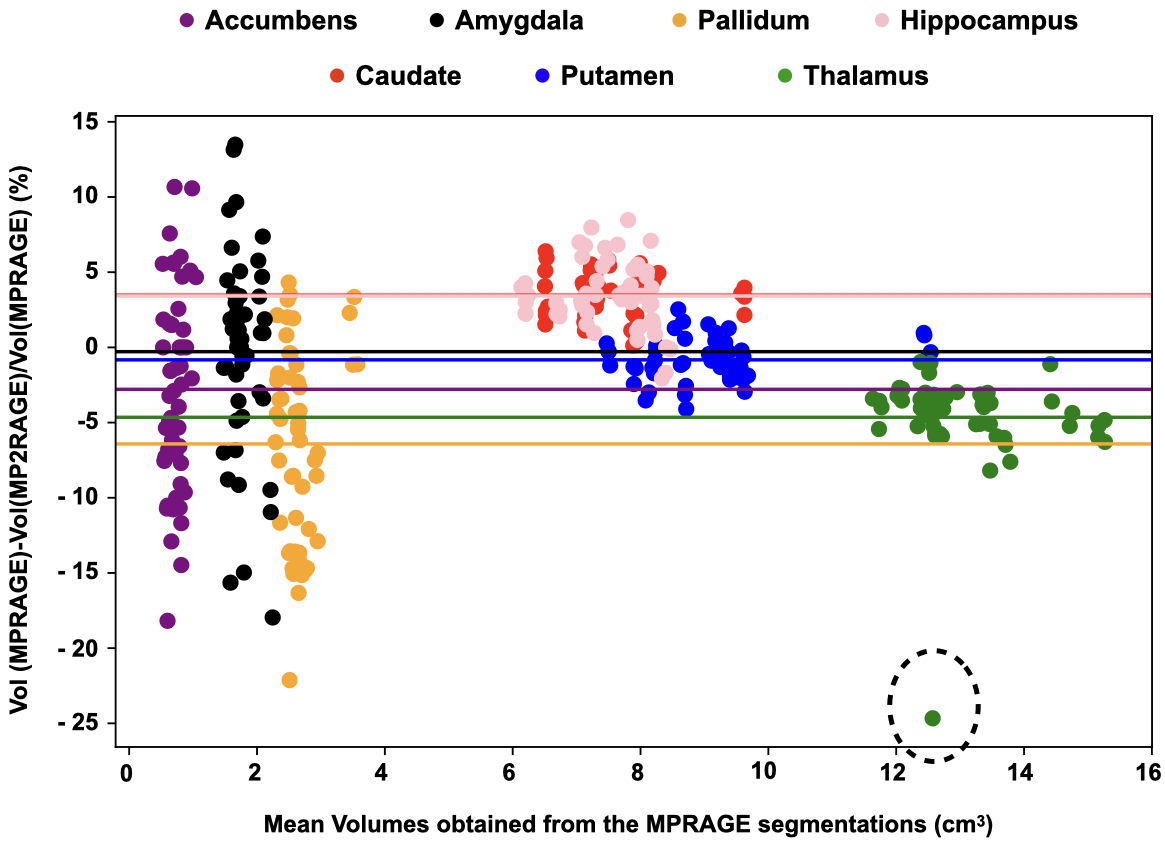
The CS-MP2RAGE acquisition provided morphological images with similar quality than the MPRAGE (Fig 1) but with higher Contrast-to-Noise (CR) between white matter (WM) and grey matter (GM) (0.38 ±0.01 and 0.15 ±0.01 on the MP2RAGE and the MPRAGE images, respectively). The GM volumes measured from the MP2RAGE images were similar with the ones obtained from the MPRAGE images, except for three participants (Fig 2). Even for those, the differences remained inferior to 5%. The WM volumes measured from the MP2RAGE images were significantly larger than the ones obtained from the MPRAGE images (but of less than 4%), except for three participants whose volumes were similar between the two sets of images. Mean segmentation differences of 0.01%, 0.8% and 1.9% were measured for GM and WM respectively. The intra-participant variabilities in GM and WM volumes obtained from the MP2RAGE images were less than 2.4%, 0.7%, respectively. Similarly, using the MPRAGE images, these variabilities were less than 1% for GM and WM. Regarding the deep grey nuclei, the Bland-Altmann plot demonstrates an excellent similarity in the volume measurements between the MPRAGE and the MP2RAGE sequences (Fig 3), especially for structures larger than 4cm3 (like the thalamus, caudate, putamen and hippocampus). For smaller structures (amygdala, pallidum and accumbens), differences between the segmentations could reach 25%. The mean volume variabilities obtained from the MP2RAGE images acquired on the 13 participants were extremely low: less than 3% for the hippocampus, caudate, putamen and thalamus. Similar variabilities were obtained using the MPRAGE segmentation for the large structures. For smaller structures, the variability could reach 3.7% for the pallidum, 8% for the amygdala and 6.3% for the accumbens. Similar variabilities were obtained from the MPRAGE segmentation. T1 measurements performed on a phantom demonstrated that less than 5% difference was found between the CS8-MP2RAGE and the standard MP2RAGE sequence. High resolution 3D T1 maps of the human brain were obtained (Fig 1). T1 values of WM and GM and several deep grey nuclei were in the range of the ones found in the literature. The intra-participant T1 variabilities were, at each scan session, less than 2.7%, 1.2% and 0.7% for CSF, GM and WM, respectively and less than 2% for all the deep grey nuclei.DISCUSSION
Within 10min, the two echo images, the MP2RAGE and the color-jet T1 maps are acquired and sent back to the MR console. The MP2RAGE images harbor more contrast, especially of the deep grey nuclei, than the conventional MPRAGE images. In the perspective of using the MP2RAGE sequence without any additional software to purchase and to not generate any bias in the analyzes, common free softwares were used. As they are only based on MPRAGE contrasts, the segmentation from the MP2RAGE images could be improved by using a dedicated software. Yet, the volumetric measurements demonstrated that the MP2RAGE sequence can perform as well as the MPRAGE sequence. Segmentations of small structures is challenging. Volume differences between the two sequences might come from differences in contrasts between the two sets of images, the non-optimization of the parameters of the segmentation softwares used and the small sizes of some nuclei that can be largely affected even for low differences in amount of voxels. Importantly, similar intra-volunteer variabilities were obtained with the CS-MP2RAGE and the MPRAGE segmentations. High T1 precision was obtained in vitro, and a high repeatability was obtained on the human brain. Differences among the MP2RAGE methods might come from different implementations of RF and gradient spoiling.CONCLUSION
We developed and optimized both the acquisition and reconstruction of a CS-accelerated MP2RAGE sequence, in order to provide a protocol of less than 10min. Replacing the MPRAGE sequence with the highly accelerated MP2RAGE sequence would have the advantage of additionally providing T1 maps, a quantitative measure that gives informative insights on tissue microstructure.Acknowledgements
This study was achieved within the context of the Laboratory of Excellence TRAIL ANR-10-LABX-57. This work was also supported by the French National Research Agency (ANR-19-CE19-0014).References
[1] Marques JP Kober T, Krueger G, van der Zwaag W, Van de Moortele PF, Gruetter R. MP2RAGE, a self bias-field corrected sequence for improved segmentation and T1-mapping at high field. NeuroIm. 2010;49:1271–1281
[2] Trotier AJ, Rapacchi S, Faller TL, Miraux S, Ribot EJ. Compressed‐Sensing MP2RAGE sequence: Application to the detection of brain metastases in mice at 7T. Magn Reson Med. 2018;1–9.
[3] Mussard E, Hilbert T, Forman C, Thiran JP, Kober T. Accelerated MP2RAGE imaging using Cartesian phyllotaxis readout and compressed sensing reconstruction. Magn Reson Med. 2020;84(4):1881-1894.
Figures