1260
Improved ΔR2* calculation through voxelwise subtraction for MRI-based dosimetry of holmium-166 transarterial radioembolization1Department of Medical Imaging, Radboud University Medical Center, Nijmegen, Netherlands, 2Imaging & Software Solutions, Quirem Medical B.V., Deventer, Netherlands
Synopsis
Transarterial radioembolization (TARE) is a treatment for liver cancer, during which radioactive microspheres are administered through the hepatic artery. Microspheres containing holmium-166 enable MRI-based dosimetry, based on subtraction of pre- and post-treatment $$$R_2^*$$$ values. This subtraction is performed using a mean pre-treatment $$$R_2^*$$$ value. This does however not take pre-existing differences of $$$R_2^*$$$ values into account, introducing an error in the dosimetry. In this work a voxelwise subtraction method is presented, using deformable registration to transform the pre-treatment $$$R_2^*$$$ map to the post-treatment $$$R_2^*$$$ map, enabling voxel-by-voxel subtraction. This method does take $$$R_2^*$$$ differences into account and improves MRI-based dosimetry.
Introduction
Transarterial radioembolization (TARE) is a locoregional treatment for liver malignancies. During TARE, beta-emitting microspheres (containing yttrium-90 (90Y) or holmium-166 (166Ho)) are injected into the hepatic artery, and lodge in the liver microvasculature where they mostly irradiate the tumours. A key characteristic of the 166Ho microspheres is their paramagnetic property, enabling MR imaging and dosimetry. MRI-based dosimetry of 166Ho microspheres is based on a local increase of the transverse relaxation rate ($$$R_2^*$$$)1. To quantify this increase, a multi gradient echo (MGRE) sequence is acquired before and after treatment, from which $$$R_2^*$$$ maps can be calculated. Subtraction of the pre- and post-treatment $$$R_2^*$$$ map leads to a $$$ΔR_2^*$$$ map, which corresponds to the distribution of the 166Ho microspheres in the tissue. The $$$ΔR_2^*$$$ map is proportional to the absorbed dose, and therefore a dose map can be constructed. However, finding $$$ΔR_2^*$$$ using a direct voxel-to-voxel subtraction of pre- and post-treatment $$$R_2^*$$$ values is challenging due to the deformability of the liver. Therefore a mean pre-treatment $$$R_2^*$$$ value is computed to perform the subtraction in the current workflow. The drawback of this method is that the heterogeneity of $$$R_2^*$$$ values before treatment is not taken into account, leading to inaccuracies in the estimated dose distribution2. In this work we aim to increase the accuracy in the dose quantification by using a deformable registration algorithm to enable a voxelwise subtraction of the $$$R_2^*$$$ maps.Methods
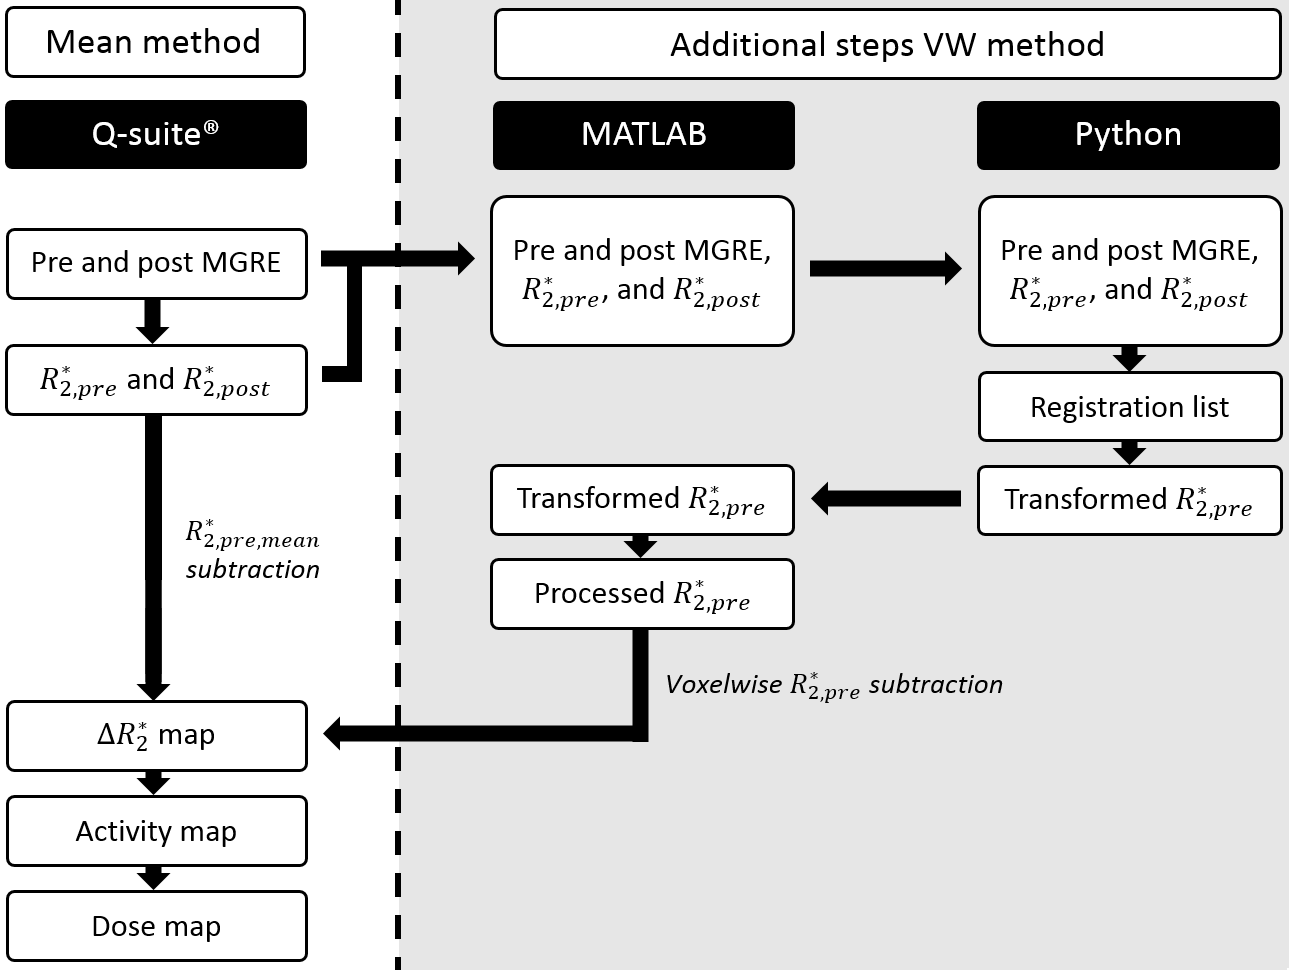
A MGRE was acquired directly before and after 166Ho TARE for six patients. Furthermore, a SPECT/CT was acquired of all patients two days after TARE, which was used to compare to MRI-based dosimetry. To quantify pre-existing $$$R_2^*$$$ differences between tumour and healthy liver tissue, pre-treatment $$$R_2^*$$$ values were analyzed. Conventional quantification of the MR images was performed using the mean subtraction method (mean method), during which a mean pre-treatment $$$R_2^*$$$ was subtracted from the post-treatment $$$R_2^*$$$ map. This quantification was executed in a research version of the clinically used software for 166Ho dose evaluation (Q-Suite™ 2.0, Quirem Medical, Deventer, The Netherlands), of which the steps can be seen in Figure 1. For the newly developed voxelwise subtraction method (VW method) the same workflow was followed, but the subtraction step was replaced by in-house developed code, as can be seen in Figure 1 as well. Pre-treatment imaging and $$$R_2^*$$$ maps were mapped to the post-treatment imaging and $$$R_2^*$$$ maps using an automatic affine registration followed by a deformable registration using symmetric normalization and mutual information, as implemented in the SyN algorithm of the Advanced Normalization Tools (ANTs) Python package3,4. Thereafter, the $$$R_2^*$$$ map was obtained by a voxelwise subtraction of the post-treatment and pre-treatment $$$R_2^*$$$ maps. The accuracy of the registration was scored using the Dice Similarity Coefficient (DSC).Results
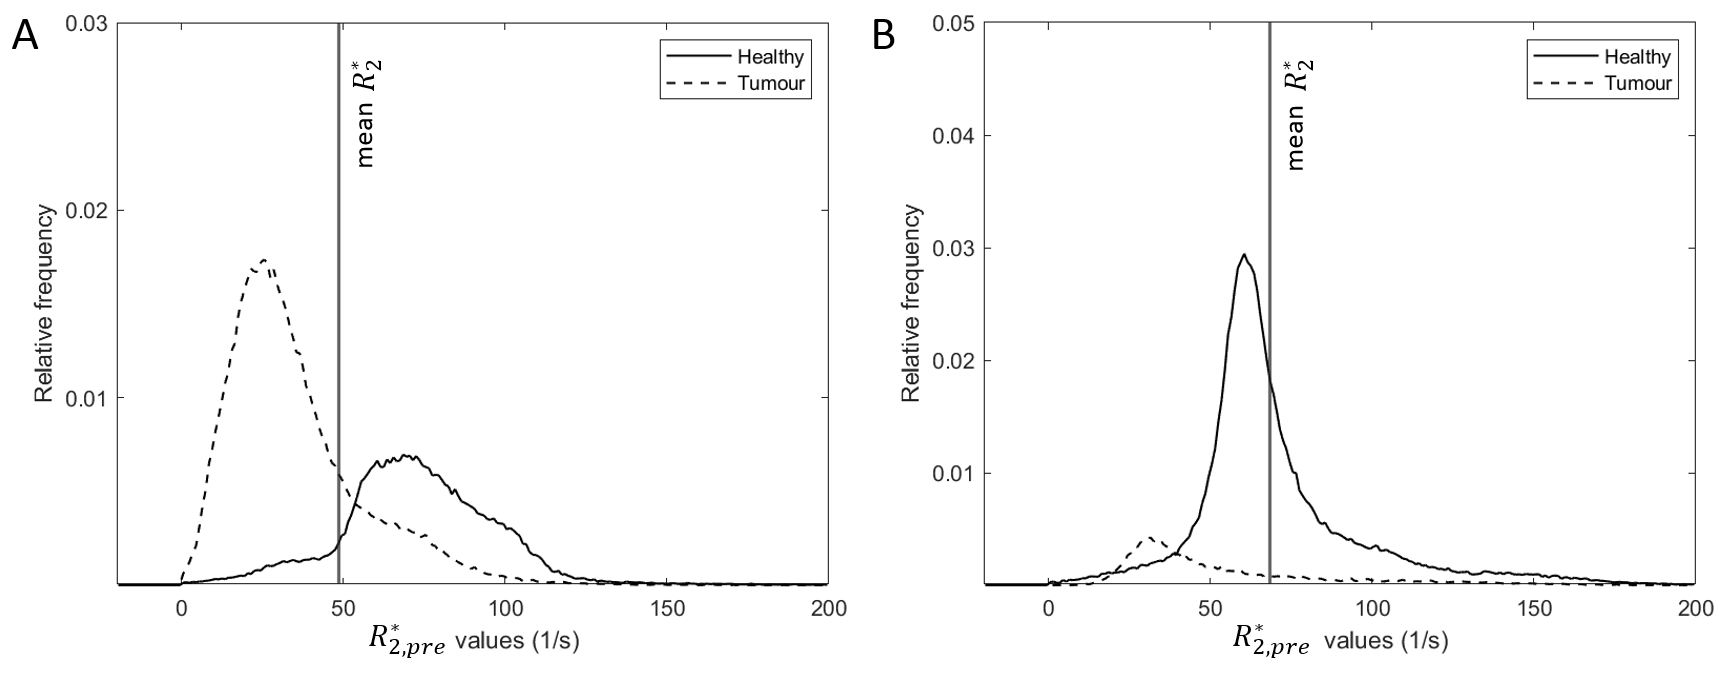
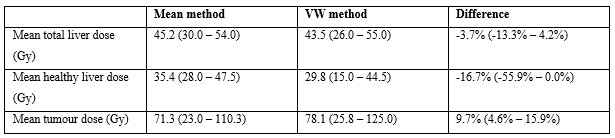
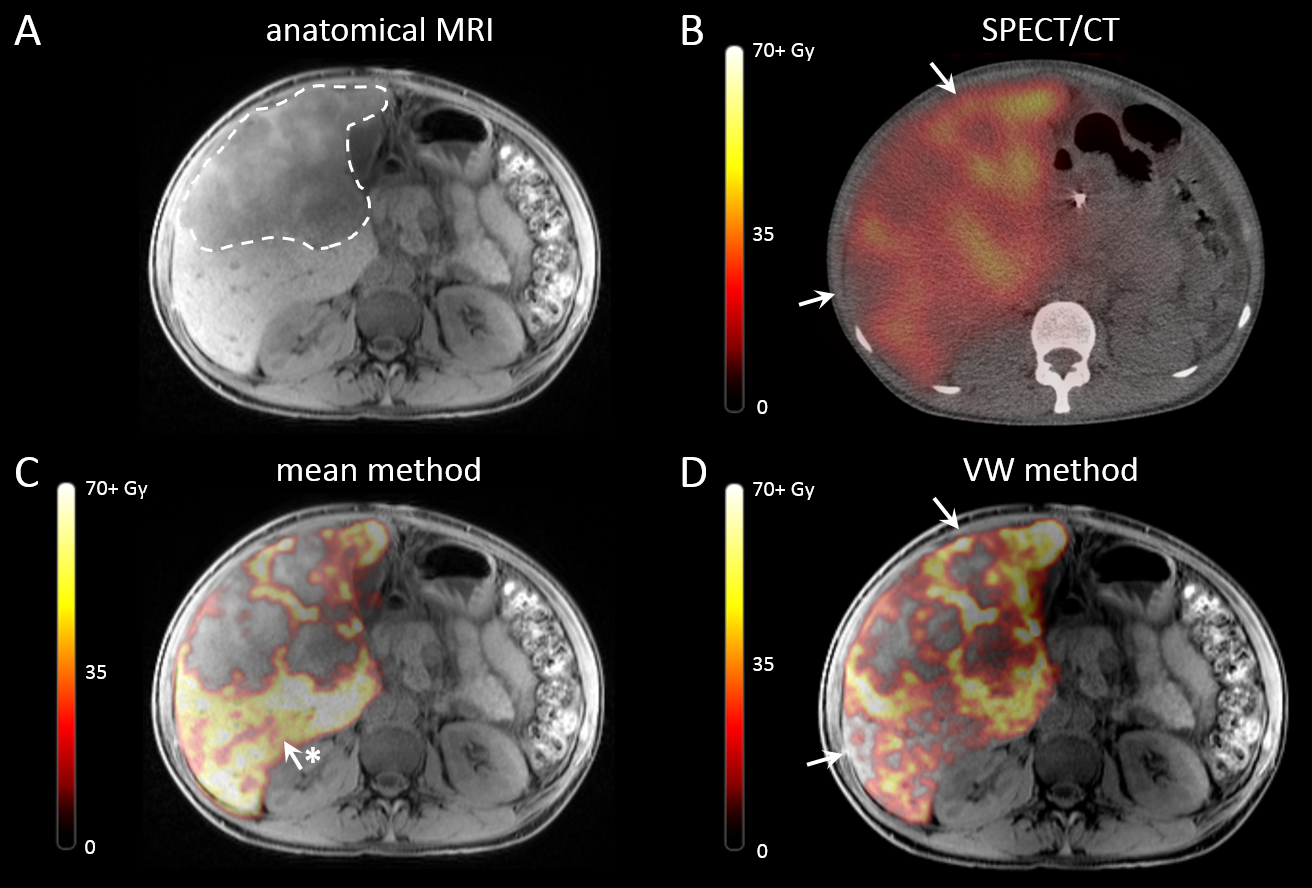
Pre-treatment $$$R_2^*$$$ values were lower in tumours (mean 38.6 s-1, range: 24.4 – 54.7 s-1) than in healthy liver tissue (mean 55.7 s-1, range: 41.4 – 73.8 s-1), while the mean $$$R_2^*$$$ of the total liver volume was 48.4 s-1 (range: 34.5 – 68.3 s-1). Two examples of pre-treatment $$$R_2^*$$$ distributions are visualized in Figure 2. Image registration resulted in an increase of mean DSC of 0.83 (range: 0.70 – 0.88) to 0.95 (range: 0.92 – 0.97). Mean dose for both MRI-based quantification methods are stated in Figure 3. For all patients, voxelwise subtraction-based dose maps yielded a higher tumour dose (mean increase of 9.7%) and lower healthy liver dose (mean decrease of 16.9%) compared to the mean method. 166Ho-SPECT dosimetry showed a lower tumour dose than the MRI-based methods (mean 63.3 Gy, range 22.0 – 89.3 Gy), and a healthy liver dose higher than the VW method but lower than the mean method (mean 33.3 Gy, range 20.0 – 51.0 Gy). The mean whole liver dose was comparable for all dosimetry methods. Voxelwise subtraction-based dose maps visually corresponded better to SPECT-based dose maps, as can be seen in Figure 4.Discussion
The ability to perform MRI-based dosimetry after TARE is one of the unique characteristics of the 166Ho microspheres. In this work, we have presented a robust alternative for the current method of calculating the $$$ΔR_2^*$$$ map, based on voxelwise subtraction, improving the accuracy of MRI-based dosimetry. As opposed to the mean method, the VW method takes local differences in the pre-treatment $$$R_2^*$$$ values into account for the dosimetry. Quantification of these local differences resulted in a substantially lower mean $$$R_2^*$$$ in tumours compared to healthy liver tissue and whole liver values. This leads to an underestimation of the tumour dose, and an overestimation of the healthy liver dose when the mean method is used. Furthermore, the VW method shows better visual comparability to SPECT/CT than the mean method. We therefore argue that the VW method is intrinsically superior to the mean method, provided that the image registration prior to subtraction is performed adequately.Conclusion
The VW method enables a voxelwise pre- and post-treatment subtraction by using deformable registration, and presents an accurate alternative to the currently implemented mean method for MRI-based dosimetry of 166Ho microspheres.Acknowledgements
No acknowledgement found.References
1. Seppenwoolde JH, Nijsen
JF, Bartels LW, Zielhuis SW, van Het Schip AD, Bakker CJ. Internal
radiation therapy of liver tumors: qualitative and quantitative magnetic
resonance imaging of the biodistribution of holmium-loaded microspheres in
animal models. Magn Reson Med. 2005;53(1):76-84.
2. van de Maat GH,
Seevinck PR, Elschot M, Smits ML, de Leeuw H, van Het Schip AD, et al. MRI-based
biodistribution assessment of holmium-166 poly(L-lactic acid) microspheres
after radioembolisation. Eur Radiol. 2013;23(3):827-35.
3. Avants BB, Tustison NJ, Song G,
Cook PA, Klein A, Gee JC. A reproducible evaluation of ANTs similarity metric
performance in brain image registration. Neuroimage. 2011;54(3):2033-44.
4. Tustison NJ, Cook PA, Holbrook AJ,
Johnson HJ, Muschelli J, Devenyi GA, et al. The ANTsX ecosystem for
quantitative biological and medical imaging. Sci Rep. 2021;11(1):9068.
Figures