1258
Combining Shape Descriptor and Image Ranking to the Identification of Alzheimer’s Disease in Anatomical Regions using T1-weighted MR Images1Radiology, University of Calgary, Calgary, AB, Canada, 2CIPAC, University of Calgary, CALGARY, AB, Canada, 3University of Campinas, Limeira, Brazil
Synopsis
Alzheimer's Disease is one of the most prevalent types of dementia that affects human behaviour and cognitive skills. The progression of this dementia occurs at different rates in distinct parts of the brain, thus also affecting their brain shape. We proposed an approach based on shape feature extraction and image ranking to identify which regions are more predictive for each level of the AD progression. For each stage, we highlighted the sub-cortical regions that suggested a strong correlation in the AD levels. In fact, the results showed a predictive pattern, which aligns to the state-of-the-art.
Introduction
Alzheimer’s disease (AD) is one of the most common causes of dementia and affects several brain structures related to memory and behaviour. Clinical medicine uses brain imaging to find patterns of degeneration that occur in the brain at different stages of disease progression.[1] Automatically identifying the variation in the shape of different brain structures, however, is a challenging task, requiring reliable techniques to perform an accurate analysis. In addition, different brain structures change shape at different rates. This study aims to identify the most affected regions over the stages of AD using shape-feature extraction and image retrieval techniques.Materials and Methods
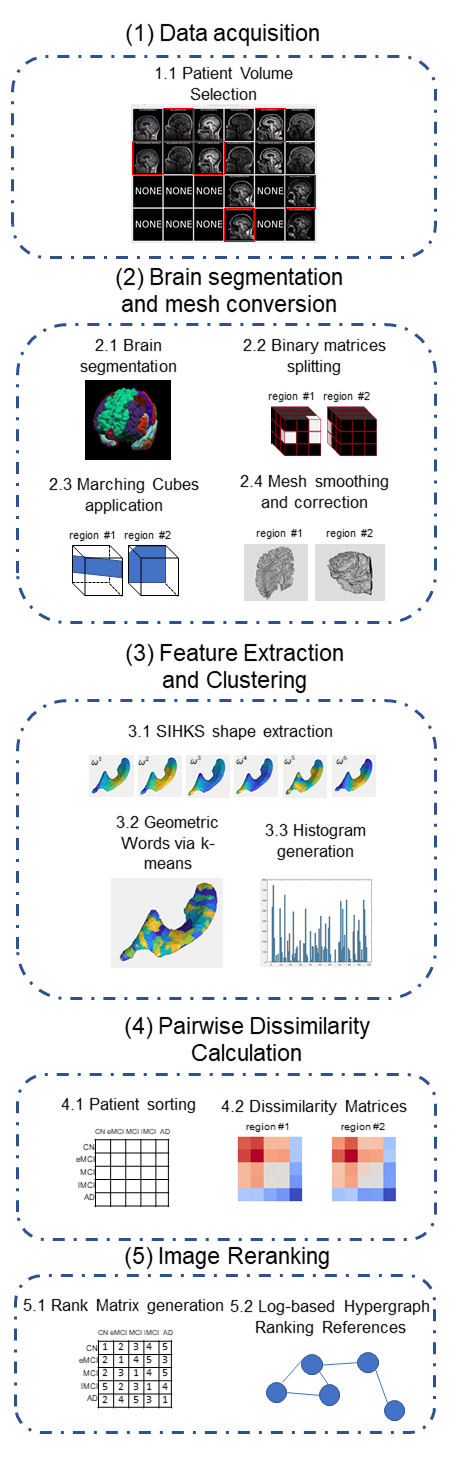
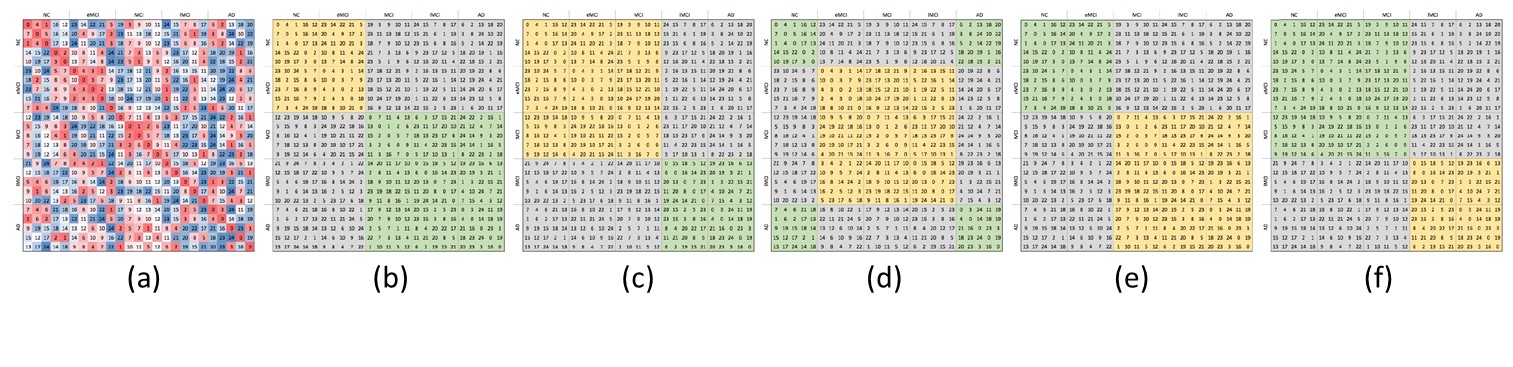
Our method was applied to T1-weighted magnetic resonance (MR) image volumes acquired by the Alzheimer’s Disease Neuroimaging Initiative (ADNI) dataset.[2] A dataset containing 25 participants was defined, with 5 participants selected for each AD stage (CN=control, MCI=mild cognitive impairment, eMCI=early MCI, ×lMCI=late MCI, and AD; staged per [2]). Our method had five principal steps (Figure 1): 1) Data Acquisition: MP-RAGE and IRSPGR scans were selected using the Patient Volume Selection tool; 2) Brain Segmentation and Mesh Conversion: Freesurfer was used to segment and parcellate the brain into 103 structural brain regions, and the marching cubes algorithms was used to generate a mesh containing faces and nodes for each region; 3) Feature Extraction and Clustering: The 3D scale-invariant heat kernel signature (SIHKS) [3] was employed to the meshes to extract shape information and k-Means was used to cluster the shape variations across the regions; 4) Pairwise Dissimilarity Calculation: The pairwise distance (1-covariance) of the regions was calculated over the participants, generating a 25×25 dissimilarity matrix, M, for each region; and 5) Image Re-Ranking: The dissimilarity matrix was optimized using log-based hypergraph of ranking references [4] to obtain a matrix where each row and column corresponded to a participant, sorted by AD stage (from CN to AD). The resulting matrix, MRank, contained the discrete ranking, where each participant (row) vector ranged from 0 (highest similarity) to 24 (lowest similarity) to another participant (column).We evaluated our method by analyzing the confusion matrices (i.e., false-positive (FP), true-positive (TP), false-negative (FN), and true-negative (TN) values), and by calculating precision and recall metrics. However, instead of comparing multiple stages of AD using the final matrices, we dichotomized the final matrix into five sets of binary comparisons, one comparison per AD stage. These matrices were computed based on the assumption that adjacent AD stages would have high intra-class covariance compared to more temporally distant stages (minimizing the inter-class covariance). Figure 2 illustrates the clusters created by grouping adjacent stages. Only changes in subcortical regions were analyzed in this study.Results
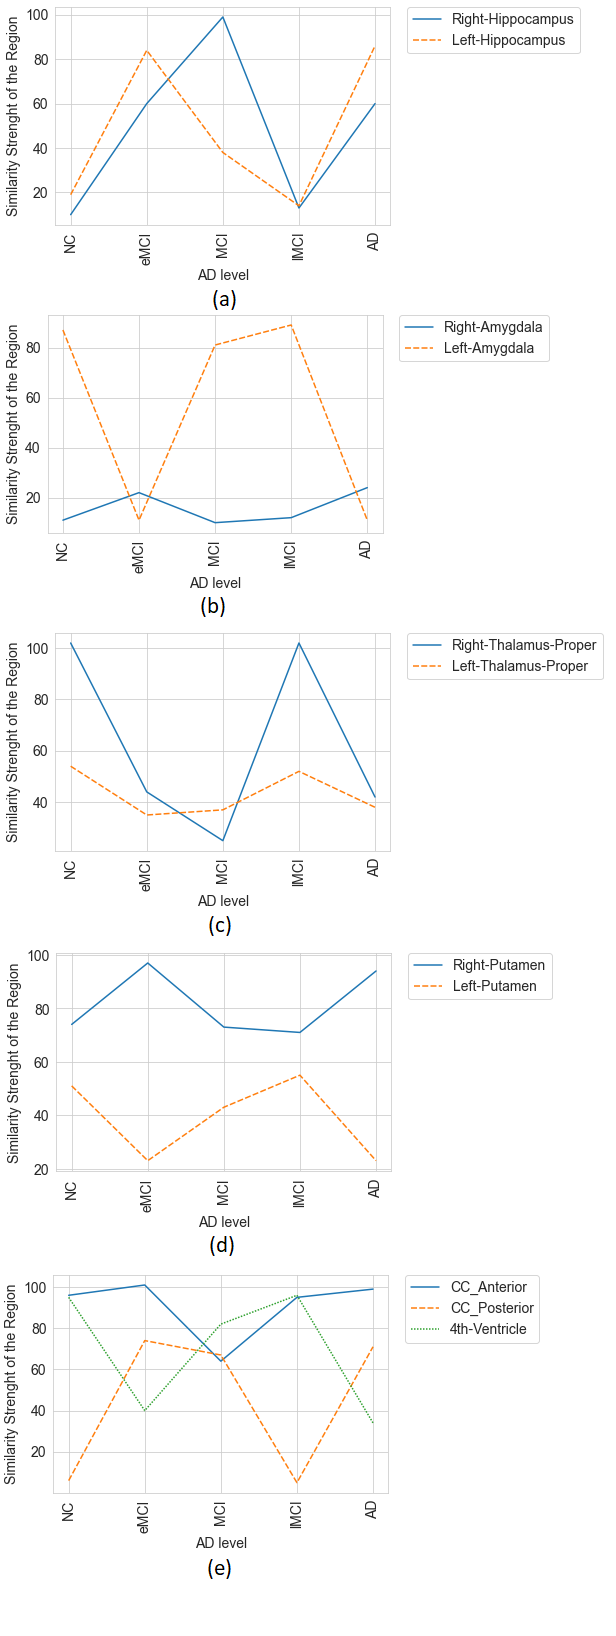
The most affected subcortical regions for each clustered AD stage are plotted in Figure 3. The anterior part of the corpus callosum (CC_Anterior) had maximal similarities across the five AD stages. The CC is known to shrink over AD progression and other studies have shown an association with cognitive decline. Likewise, the 4th ventricle is known to play an important role in AD, and thus was expected to have high similarity across the stages. Although more often studied in other diseases, such as Tourette’s syndrome, the right putamen was found to have high similarity across the AD stages.Discussion
Our approach used a robust 3D shape descriptor to identify the subtle variations and differences in time-course in brain region shape across the five AD stages. The image ranking approach combined adjacent AD stages that might present more similar changes than more distant levels (Figure 2). Subcortical regions show interesting brain changes over disease progression. Computational shape-based description of AD regional brain change may provide new insight into understanding disease progress and, potentially, highlight new findings related to its temporal evolution.The importance of identifying the anatomical regions affected by each stage of the disease may imply in advancing the understanding of AD, since the more it is known, the easier it is to infer prognosis or physicians in their analysis. The regions are affected by AD at different rates, and this factor is crucial to highlight that focusing on specific regions, such as hippocampus, may not lead to an accurate prediction.Conclusion
Identifying the most affected brain regions over AD stages is a challenging task that can provide valuable information about its progression. However, determining these regional changes relies on applying computational approaches to detect the variance across distinct participants in order to minimize bias. Anatomical brain MR images when coupled with shape-based descriptors allow the identification of the brain structures and shape descriptors can thus play a role in tracking the deformation regions across the brain. In addition, the similarity of the brain among patients in adjacent AD stages is challenging because changes are subtle and, in many cases, only detectable advanced computational techniques. The analysis of cortical changes, which comprises the more complex structures for the shape descriptor analysis, need to be explored in future studies. This analysis provides better discriminatation between brain regions as the size and shape of the cortical areas are more affected in AD progression.Acknowledgements
The authors thank Eyes High Postdoctoral Fellowship at University of Calgary and CAPES (Brazilian funding agency) for the financial support.References
[1] Johnson, K. A., Fox, N. C., Sperling, R. A., & Klunk, W. E. (2012). Brain imaging in Alzheimer disease. Cold Spring Harbor Perspectives in Medicine, 2(4), a006213. https://doi.org/10.1101/cshperspect.a006213
[2] Petersen R. C., Aisen P. S. , Beckett L. A., et al. Alzheimer's Disease Neuroimaging Initiative (ADNI): clinical characterization. Neurology. 2010;74(3):201-209. doi:10.1212/WNL.0b013e3181cb3e25
[3] Duarte, K. T. N.; Gobbi, D. G., Frayne, R & de Carvalho, M. A. G. Detecting Alzheimer’s Disease based on Structural Region Analysis using a 3D Shape Descriptor, 2020 33rd SIBGRAPI Conference on Graphics, Patterns and Images (SIBGRAPI), 2020, pp. 180-187, https://doi.org/10.1109/SIBGRAPI51738.2020.00032
[4] Pedronette, D. C. G., Valem L. P., Almeida J. & Torres R. da S., "Multimedia Retrieval Through Unsupervised Hypergraph-Based Manifold Ranking," in IEEE Transactions on Image Processing, vol. 28, no. 12, pp. 5824-5838, Dec. 2019, doi: https://doi.org/10.1109/TIP.2019.2920526
Figures