1256
T2-dependence of deep and superficial white matter tractography
Yogesh Rathi1, Lipeng Ning1, Congyu Liao2, Yang Ji3, Carl-Fredrik Westin1, Fan Zhang1, Nikolaos Makris1, Lauren J O'Donnell1, and Kawin Setsompop2
1Harvard Medical School, Boston, MA, United States, 2Stanford University, Stanford, CA, United States, 3Oxford University, Oxford, United Kingdom
1Harvard Medical School, Boston, MA, United States, 2Stanford University, Stanford, CA, United States, 3Oxford University, Oxford, United Kingdom
Synopsis
Tractography is typically obtained from diffusion MRI data acquired at a particular echo time (TE). Recent works have shown differential T2-relaxation times of tissue microstructure and fiber tracts. However, estimation of T2 in fiber bundles have typically been done at the last stage (after tractography). In this work, we show that tractography itself is affected by the T2 (and hence TE) of the fibers. Specifically, we show that the ability to trace accurately depends on the T2 of the fiber bundle. This is specifically true for the superficial white matter (u-fibers) which has higher myelination and iron content.
Introduction
1. Diffusion MRI (dMRI) acquisitions typically acquire data at a single echo time (TE) and tractography is run on these datasets. However, the T2 relaxation properties could depend on the underlying tissue microstructure and its composition (e.g. myelination, iron content etc.). Consequently, several works are beginning to investigate the differential diffusion-relaxation properties of the tissue microstructure [1,2,3]. Recent works have shown that different fiber bundles could have different T2 relaxation rates [2, 4]. Specifically, in [2] the authors demonstrate how the volume fraction of different fiber bundles in crossing regions can differ. However, in the context of tractography, most works estimate the T2 of a specific fiber bundle after tractography [4] is done. Thus, these works assume that the tractography itself is not affected by the differences in the T2-relaxation rate of the different fiber bundles at a voxel scale. However, as has been shown in several ex-vivo works, the superficial white matter (SWM) typically has more myelination and iron content compared to the surrounding white matter [5,6]. Thus, their T2 is naturally different and the ability to properly trace these connections depends on the TE of the acquisition. In this work, we demonstrate the effect of T2 (i.e., the TE at which the data is acquired) on the ability to effectively trace several fiber bundles.Methods
1. We acquired a high resolution dMRI dataset on a healthy human volunteer using a gSlider acquisition [9] with the following parameters: Scan #1: TE=81 ms, spatial resolution of 1 x 1 x 5 $$$mm^3$$$ with 5 gSlider RF encodings to obtain 1 mm isotropic spatial resolution at b=1000 $$$s/mm^2$$$ and 32 gradient directions with 4 b=0 acquisitions and TR = 3500 ms. Scan #2 had exactly the same parameters as scan #1 except TE = 111 ms was used. Note that the diffusion time ($$$\delta$$$ and $$$\Delta$$$) was kept constant in both cases. To ensure comparable SNR across both scans (to account for the loss in SNR at longer TE), we acquired both AP and PA phase encodings for all gradient directions at TE=111 ms (but not for TE=81 ms) and FSL’s topup and eddy was used to correct for motion and EPI distortions. All data was acquired in the same session. Averaging the two acquisitions at TE=111 ms improved the SNR and made it comparable to TE=81ms, thereby eliminating confounds due to SNR differences. Multi-tensor tractography was then run on both the datasets (UKFTractography [7,8]) with seeding done using the same white matter seeding mask and using the same stopping criteria (FA< 0.1). White matter analysis (WMA) software [10] was then used to cluster the fibers into several well-known anatomical fiber bundles. Since the seeding was the same for both echo times, the differences in the ability to trace any particular fiber bundle depends on the T2 of each fiber bundle. Next, we counted the number of fibers traced in each fiber bundle in data with both TEs. If TE and hence T2 had no effect on tractography, then we would expect roughly the same number of fibers in each case. We also manually delineated the superficial white matter or the so-called short u-fiber connections using Slicer DMRI [11] to determine the T2-dependence to trace these short connections closer to the cortex (given our high spatial resolution).Results
1. We observed substantial differences between the number of fibers traced for TE=81ms and TE=111ms datasets. As expected, in-general, we find more fibers are traced at lower TE as signal corresponding to shorter T2 compartments decays quickly and is potentially not visible (i.e., does not contribute) at longer echo times, e.g. at TE=111ms. A paired two sample t-test showed significant statistical difference between the number of fibers traced in the anatomically labeled tracts for both cases (p = 0.0007), while the Pearson correlation coefficient between them was still high (0.96). For the superficial white matter (or short u-fibers, Fig. 1), we observed more fibers traced reliably at shorter TE compared to longer TE (111 ms). This is expected, as the u-fibers have more myelin and iron content as reported in [5], leading to faster T2-decay (see Fig. 2 for the orientation distribution functions (ODF) showing fewer fiber crossing at TE=111ms in the superficial white matter region). On the other hand, we noted a few regions such as the left and right uncinate fasciculus (UF), bilateral posterior limb of the internal capsule (PLIC), bilateral external capsule (EC) and anterior portion of the corpus callosum (CC) had more fibers at TE=111 ms compared to TE=81 ms as shown in Figs 3 and 4. These fibers are part of a complex network architecture, where several other fiber bundles cross. Thus, it is possible that once the signal due to a dominant fiber bundle diminishes, it enables the much “smaller” crossing fiber signal fraction to become “visible” thereby enabling them to be traced better.Conclusion
In this work, we show that white matter tractography results are dependent on the echo-time (TE) of the data. Better tracing is possible at the lowest possible TE for a majority of the bundles, but several exceptions exist where longer TE enables better tract tracing.Acknowledgements
The authors acknowledge NIH for the funding of this research.References
- Veraart J, Novikov DS, Fieremans E. TE dependent Diffusion Imaging (TEdDI) distinguishes between compartmental T2 relaxation times. Neuroimage. 2018;182: 360–369.
- Ning L, Gagoski B, Szczepankiewicz F, Westin C-F, Rathi Y. Joint RElaxation-Diffusion Imaging Moments (REDIM) to Probe Neurite Microstructure. IEEE Trans Med Imaging. 2020;39: 668–677.
- Kim D, Doyle EK, Wisnowski JL, Kim JH, Haldar JP. Diffusion-relaxation correlation spectroscopic imaging: A multidimensional approach for probing microstructure. Magn Reson Med. 2017;78: 2236–2249.
- Barakovic M, Tax CMW, Rudrapatna U, Chamberland M, Rafael-Patino J, Granziera C, et al. Resolving bundle-specific intra-axonal T2 values within a voxel using diffusion-relaxation tract-based estimation. Neuroimage. 2021;227: 117617.
- Eickhoff S, Walters NB, Schleicher A, Kril J, Egan GF, Zilles K, et al. High-resolution MRI reflects myeloarchitecture and cytoarchitecture of human cerebral cortex. Hum Brain Mapp. 2005;24: 206–215.
- Stüber C, Morawski M, Schäfer A, Labadie C, Wähnert M, Leuze C, et al. Myelin and iron concentration in the human brain: a quantitative study of MRI contrast. Neuroimage. 2014;93 Pt 1: 95–106.
- Malcolm JG, Shenton ME, Rathi Y. Filtered multitensor tractography. IEEE Trans Med Imaging. 2010;29: 1664–1675.
- Reddy CP, Rathi Y. Joint Multi-Fiber NODDI Parameter Estimation and Tractography Using the Unscented Information Filter. Front Neurosci. 2016;10: 166.
- Setsompop K, Fan Q, Stockmann J, Bilgic B, Huang S, Cauley SF, et al. High-resolution in vivo diffusion imaging of the human brain with generalized slice dithered enhanced resolution: Simultaneous multislice (gSlider-SMS). Magn Reson Med. 2017. doi:10.1002/mrm.26653
- Zhang F, Wu Y, Norton I, Rigolo L, Rathi Y, Makris N, et al. An anatomically curated fiber clustering white matter atlas for consistent white matter tract parcellation across the lifespan. Neuroimage. 2018;179: 429–447.
- Norton I, Essayed WI, Zhang F, Pujol S, Yarmarkovich A, Golby AJ, et al. SlicerDMRI: Open Source Diffusion MRI Software for Brain Cancer Research. Cancer Res. 2017;77: e101–e103.
Figures
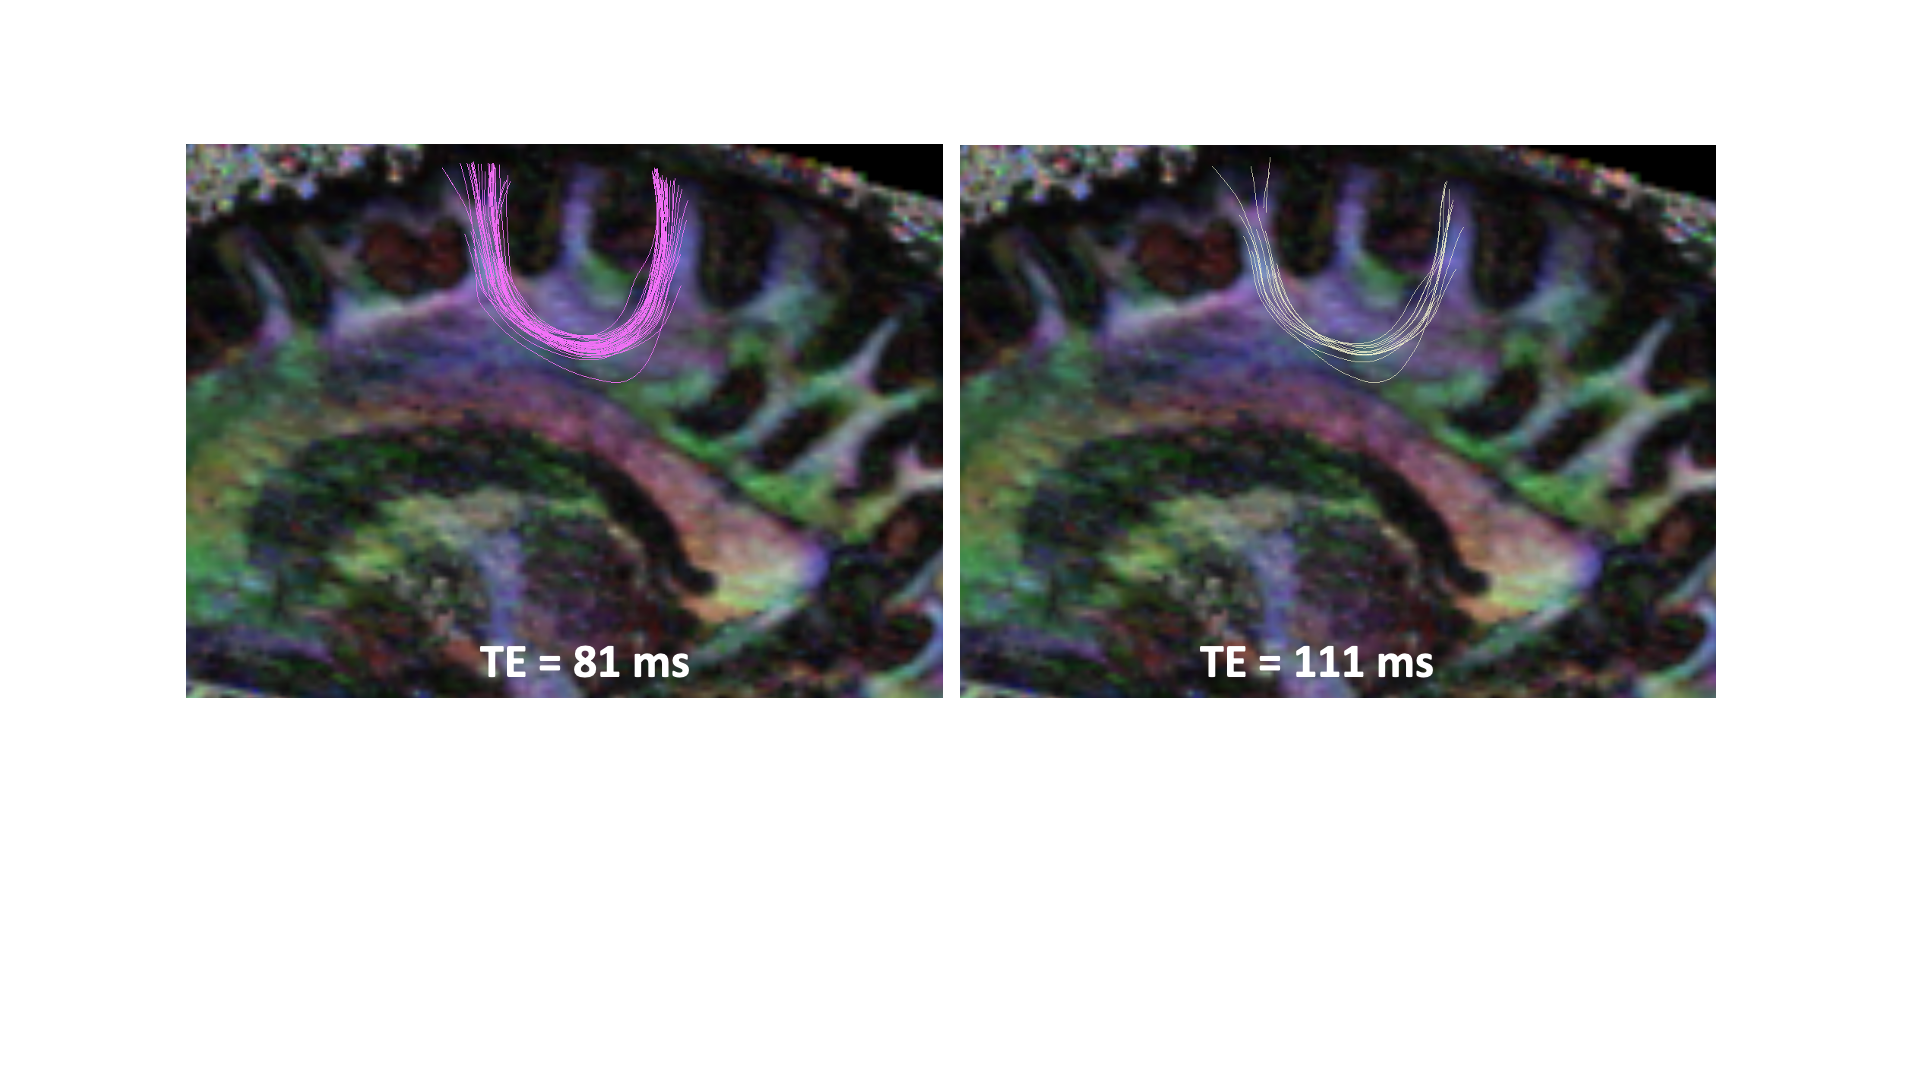
Fig. 1. Ability to trace the superficial white
matter (or u-fibers) is dependent on the echo time (TE) at which the data is
acquired. Many more u-fibers can be traced at TE=81ms compared to TE=111ms.
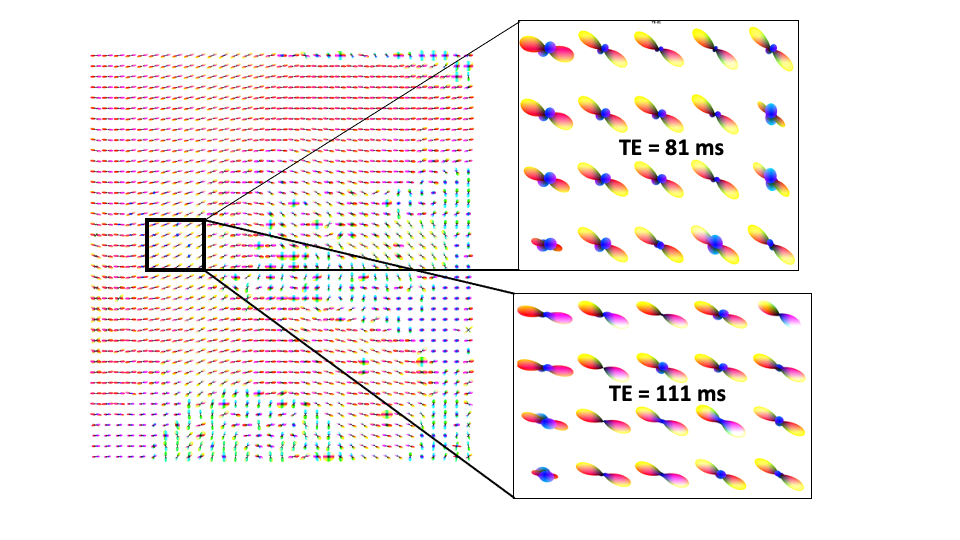
Fig 2. ODFs from a sagittal slice, with zoom-in of the ODF-field for TE=81ms and
TE=111ms. As can be seen, many more crossing fibers (blue) are observed at
TE=81ms compared to TE=111ms, thereby showing differences in tracing the
u-fibers.
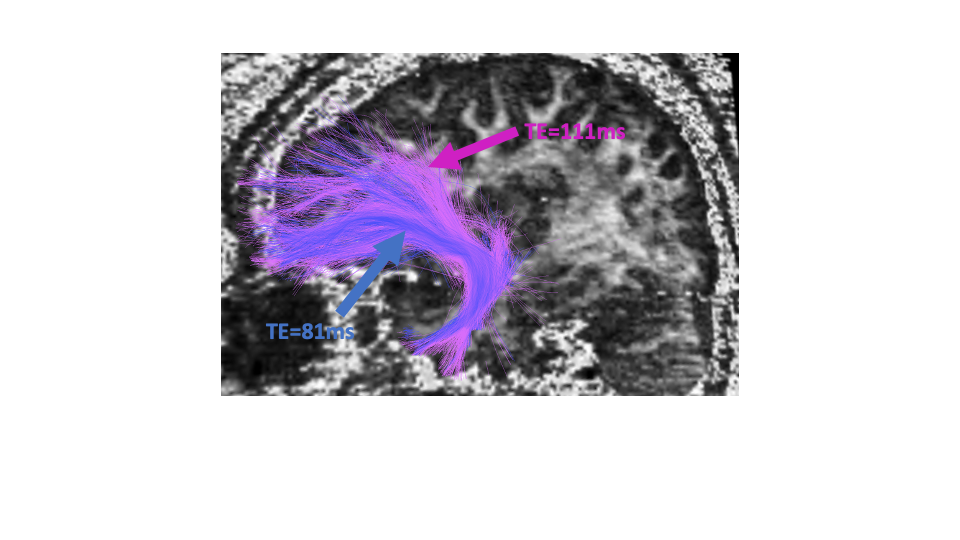
Fig 3. Right
uncinate fasciculus traced for TE=81ms (blue) and TE=111ms (pink). As can be
seen, more fibers are traced for the longer TE data, despite seeding in the
exact same locations.
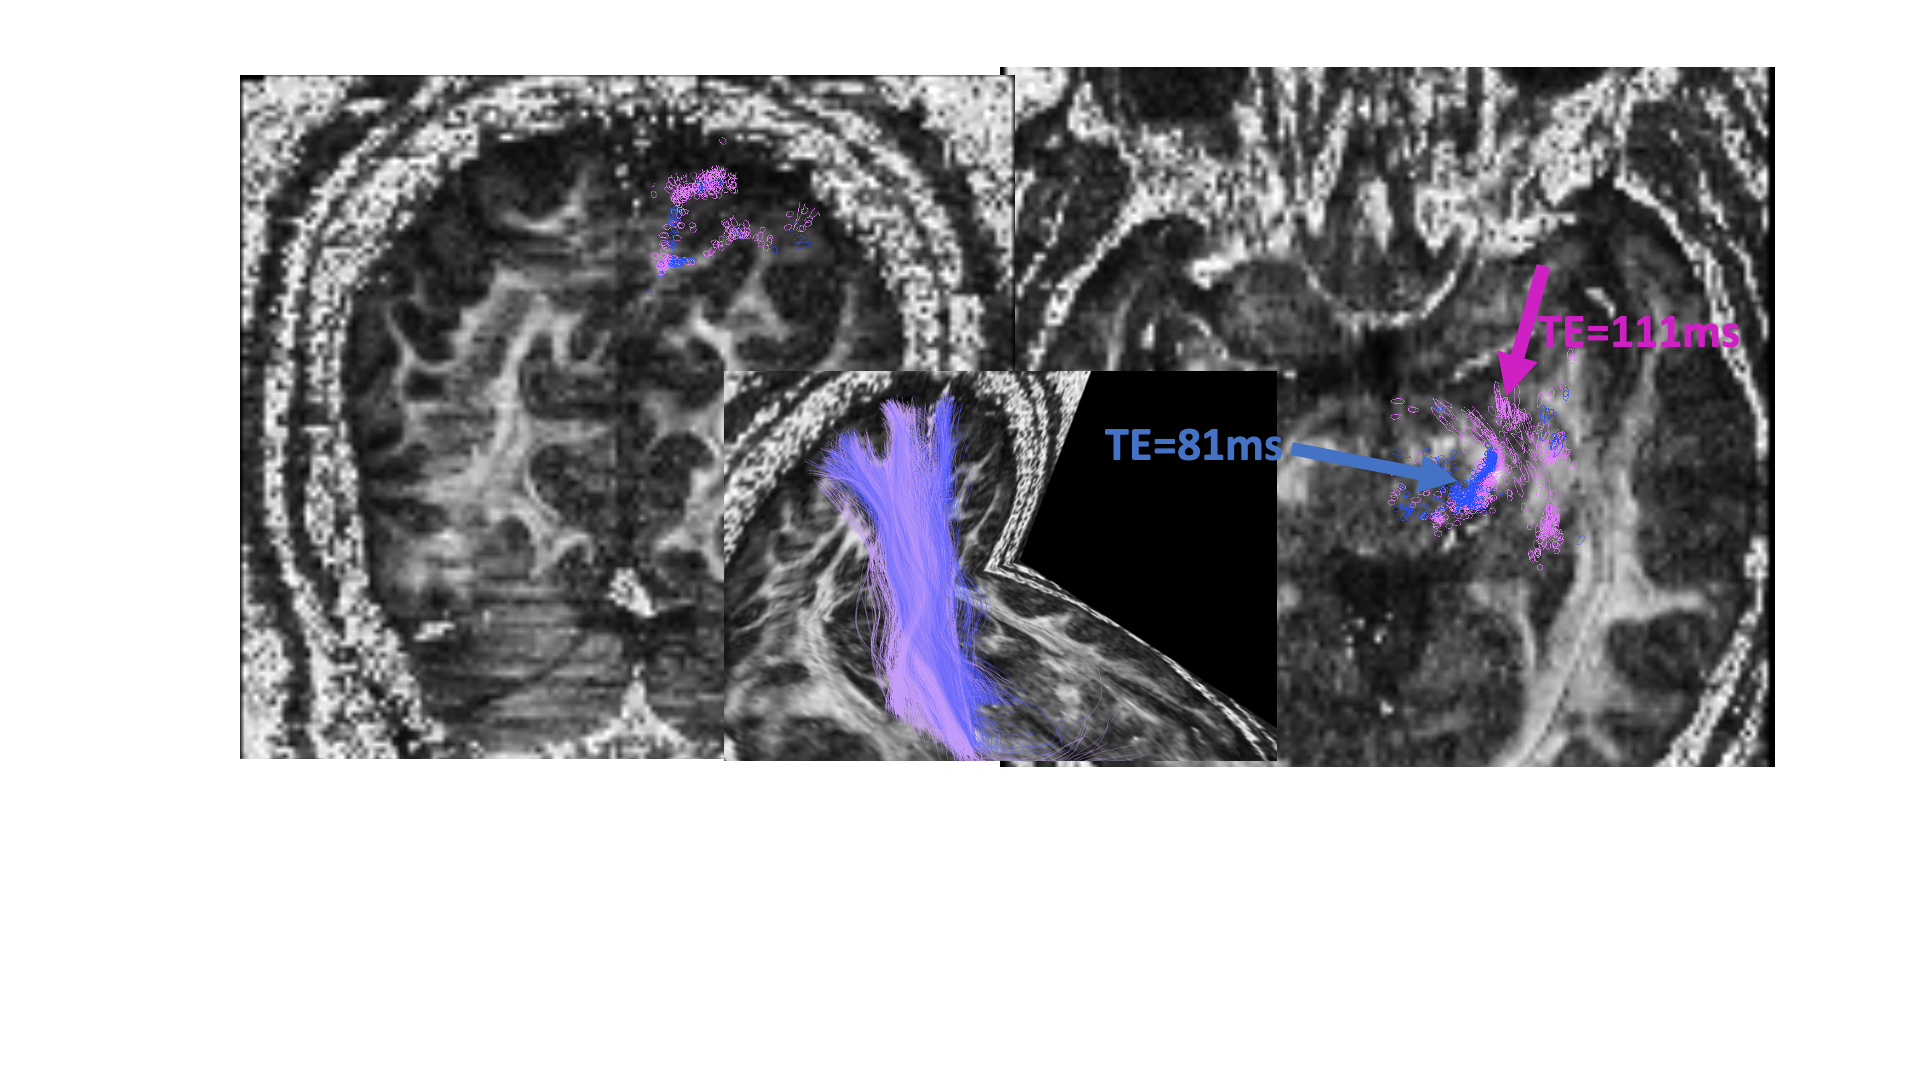
Fig 4. Tracing
the posterior limb of the internal capsule (PLIC) on both datasets of the same
individual. TE = 111 ms
(pink), TE = 81 ms(blue).
Shown on the FA slices are locations where the tractography differs between the two TE datasets (left slice: coronal, right slice: axial).
DOI: https://doi.org/10.58530/2022/1256